| source | dataset | Title | .html | .rData |
|---|---|---|---|---|
| oecd | QNA_EXPENDITURE_CAPITA | Quarterly National Accounts, GDP Per Capita | 2026-02-02 | 2026-02-09 |
| oecd | QNA_INCOME | Quarterly National Accounts, | 2026-01-16 | 2026-02-09 |
Quarterly National Accounts,
Data - OECD
Info
Last
| obsTime | Nobs |
|---|---|
| 2025-Q4 | 29 |
REF_AREA
Code
QNA_INCOME %>%
  left_join(REF_AREA, by = "REF_AREA") %>%
  group_by(REF_AREA, Ref_area) %>%
  summarise(Nobs = n()) %>%
  arrange(-Nobs) %>%
  print_table_conditional()
TRANSACTION
Code
QNA_INCOME %>%
  left_join(TRANSACTION, by = "TRANSACTION") %>%
  group_by(TRANSACTION, Transaction) %>%
  summarise(Nobs = n()) %>%
  arrange(-Nobs) %>%
print_table_conditional()| TRANSACTION | Transaction | Nobs |
|---|---|---|
| B1GQ | Gross domestic product | 13946 |
| D1 | Compensation of employees | 12274 |
| D2X3 | Taxes on production and imports less subsidies | 12130 |
| B2A3G | Operating surplus and mixed income, gross | 11983 |
| D2 | Taxes on production and imports | 10877 |
| D3 | Subsidies on production and imports | 10877 |
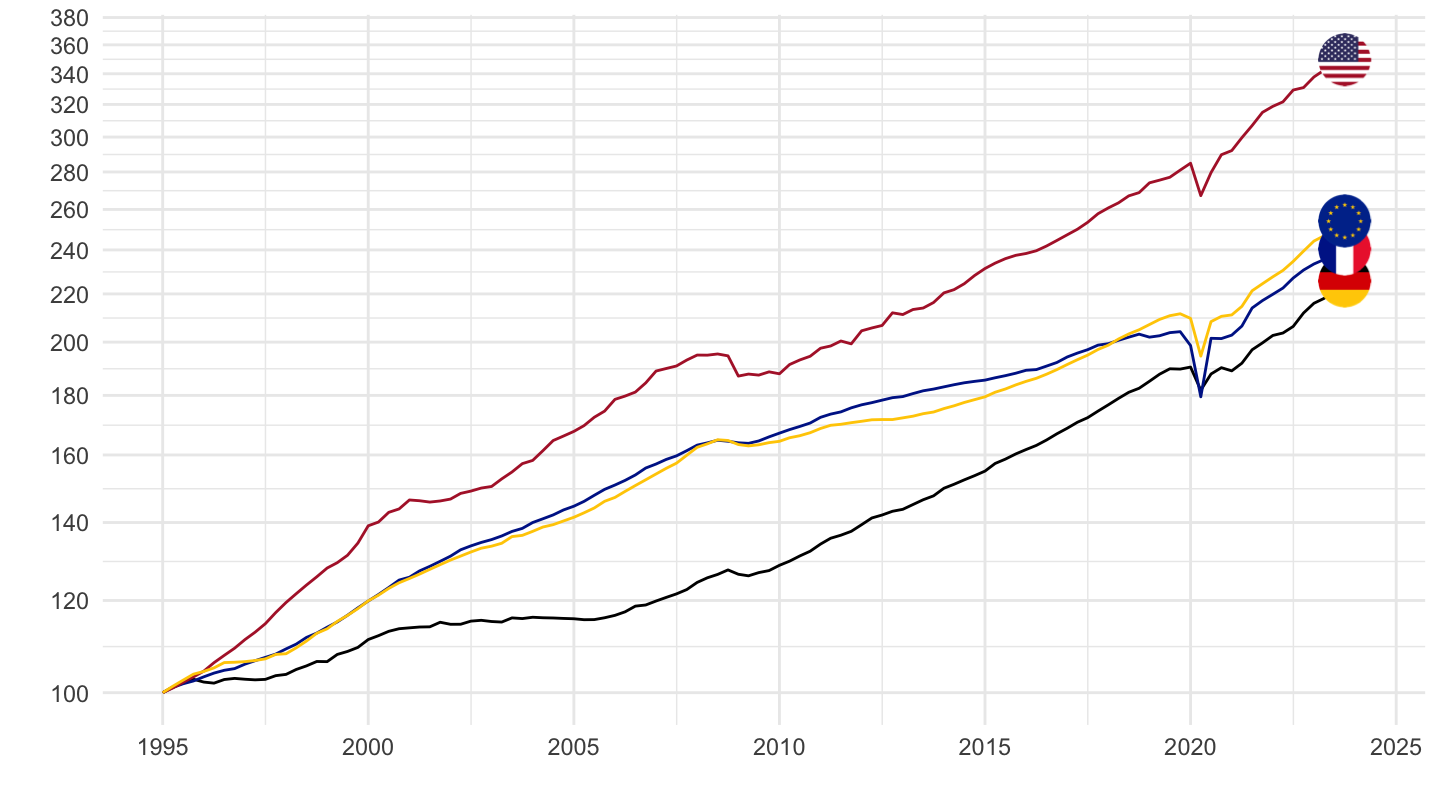
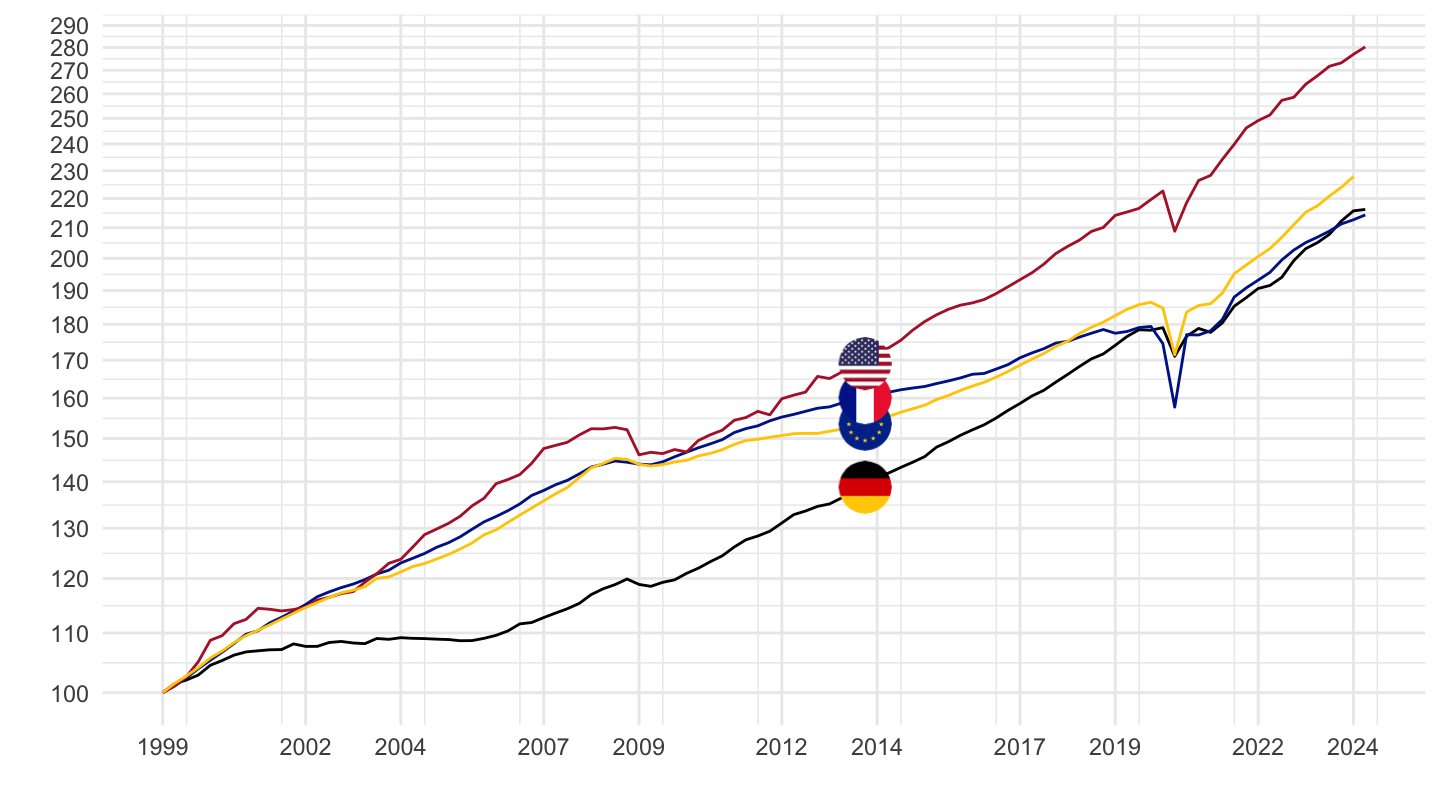
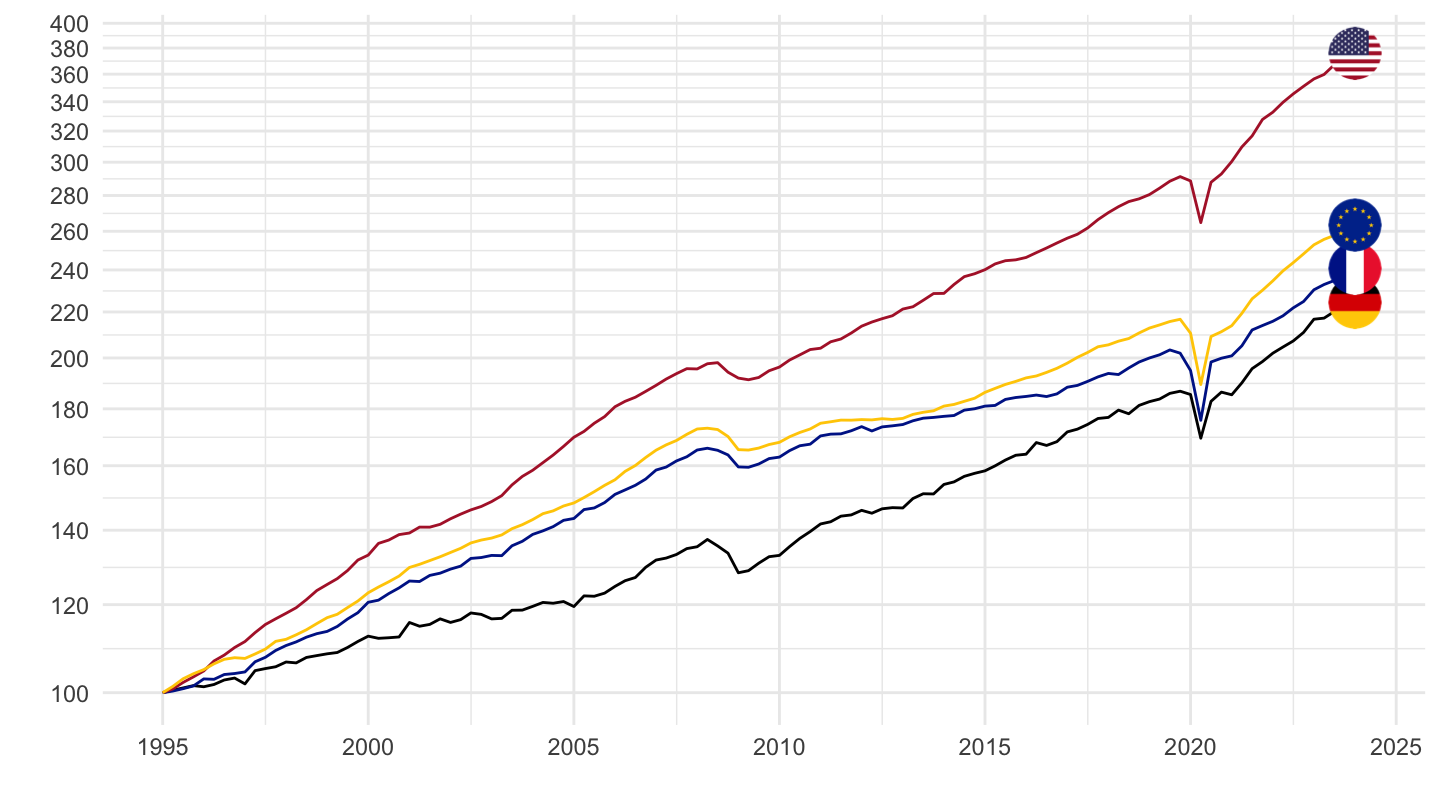
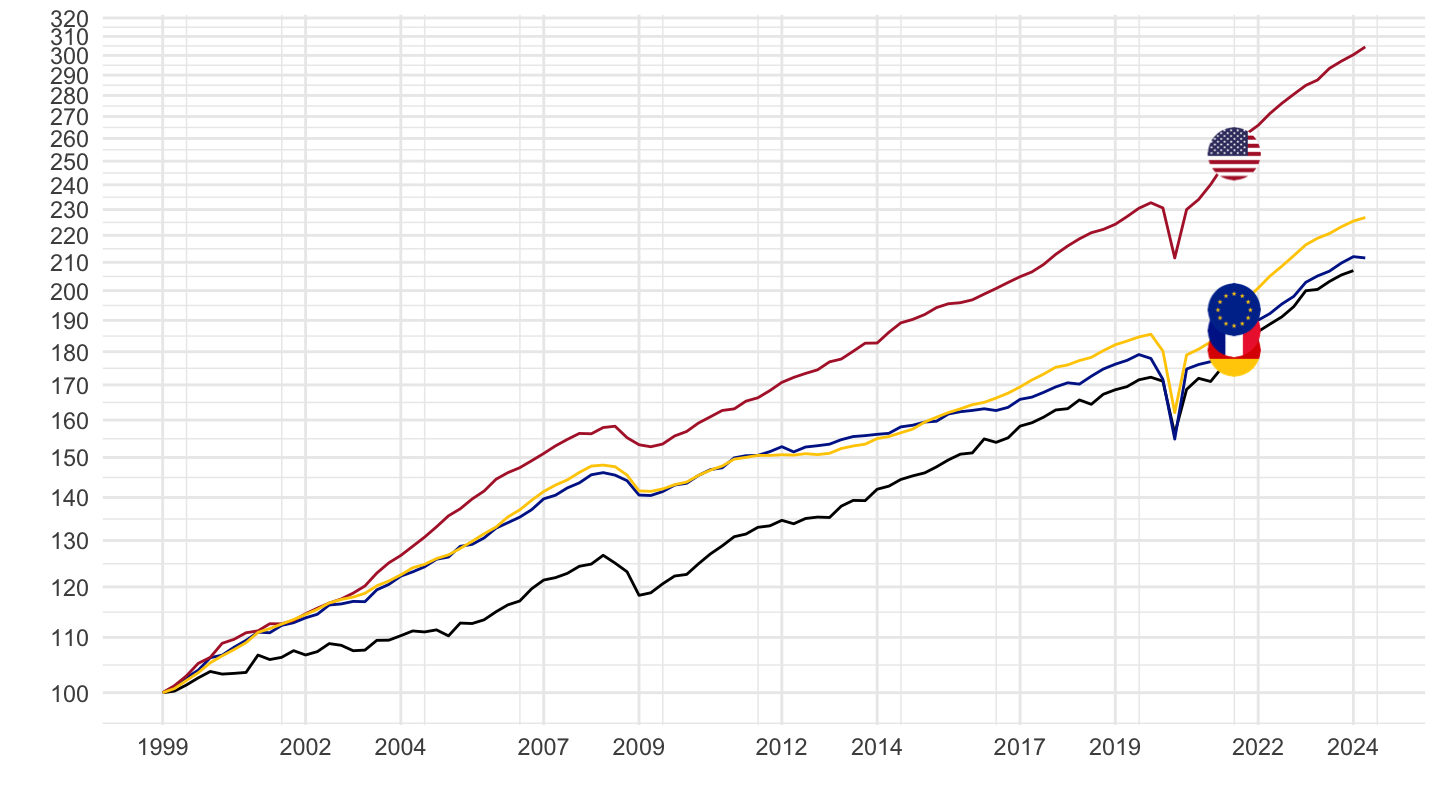
U.S., Europe, France, Germany
D1 - Compensation of employees
1995-
Code
QNA_INCOME %>%
  filter(REF_AREA %in% c("USA", "EA20", "FRA", "DEU"),
         FREQ == "Q",
         TRANSACTION == "D1",
         ADJUSTMENT == "Y") %>%
  quarter_to_date %>%
  arrange(desc(date)) %>%
  rename(LOCATION = REF_AREA) %>%
  left_join(QNA_var$LOCATION, by = "LOCATION") %>%
  filter(date >= as.Date("1995-01-01")) %>%
  mutate(Location = ifelse(LOCATION == "EA20", "Europe", Location)) %>%
  group_by(Location) %>%
  arrange(date) %>%
  mutate(obsValue = 100 * obsValue / obsValue[1]) %>%
  left_join(colors, by = c("Location" = "country")) %>%
  mutate(color = ifelse(LOCATION != "DEU", color2, color)) %>%
  ggplot(.) + theme_minimal() + xlab("") + ylab("") +
  geom_line(aes(x = date, y = obsValue, color = color)) + add_4flags +
  scale_color_identity() +
  scale_x_date(breaks = c(seq(1995, 2100, 5)) %>% paste0("-01-01") %>% as.Date,
               labels = date_format("%Y")) +
  theme(legend.position = "none") +
  scale_y_log10(breaks = seq(100, 500, 20))
1999-
Code
QNA_INCOME %>%
  filter(REF_AREA %in% c("USA", "EA20", "FRA", "DEU"),
         FREQ == "Q",
         TRANSACTION == "D1",
         ADJUSTMENT == "Y") %>%
  quarter_to_date %>%
  rename(LOCATION = REF_AREA) %>%
  left_join(QNA_var$LOCATION, by = "LOCATION") %>%
  filter(date >= as.Date("1999-01-01")) %>%
  mutate(Location = ifelse(LOCATION == "EA20", "Europe", Location)) %>%
  group_by(Location) %>%
  mutate(obsValue = 100 * obsValue / obsValue[date == as.Date("1999-01-01")]) %>%
  left_join(colors, by = c("Location" = "country")) %>%
  mutate(color = ifelse(LOCATION != "DEU", color2, color)) %>%
  ggplot(.) + theme_minimal() + xlab("") + ylab("") +
  geom_line(aes(x = date, y = obsValue, color = color)) + add_4flags +
  scale_color_identity() +
  scale_x_date(breaks = c(seq(1999, 2100, 5), seq(1997, 2100, 5)) %>% paste0("-01-01") %>% as.Date,
               labels = date_format("%Y")) +
  theme(legend.position = "none") +
  scale_y_log10(breaks = seq(50, 400, 10))
B1GQ - Gross domestic product
1995-
Code
QNA_INCOME %>%
  filter(REF_AREA %in% c("USA", "EA20", "FRA", "DEU"),
         FREQ == "Q",
         TRANSACTION == "B1GQ",
         ADJUSTMENT == "Y") %>%
  quarter_to_date %>%
  arrange(desc(date)) %>%
  rename(LOCATION = REF_AREA) %>%
  left_join(QNA_var$LOCATION, by = "LOCATION") %>%
  filter(date >= as.Date("1995-01-01")) %>%
  mutate(Location = ifelse(LOCATION == "EA20", "Europe", Location)) %>%
  group_by(Location) %>%
  arrange(date) %>%
  mutate(obsValue = 100 * obsValue / obsValue[1]) %>%
  left_join(colors, by = c("Location" = "country")) %>%
  mutate(color = ifelse(LOCATION != "DEU", color2, color)) %>%
  ggplot(.) + theme_minimal() + xlab("") + ylab("") +
  geom_line(aes(x = date, y = obsValue, color = color)) + add_4flags +
  scale_color_identity() +
  scale_x_date(breaks = c(seq(1995, 2100, 5)) %>% paste0("-01-01") %>% as.Date,
               labels = date_format("%Y")) +
  theme(legend.position = "none") +
  scale_y_log10(breaks = seq(100, 500, 20))
1999-
Code
QNA_INCOME %>%
  filter(REF_AREA %in% c("USA", "EA20", "FRA", "DEU"),
         FREQ == "Q",
         TRANSACTION == "B1GQ",
         ADJUSTMENT == "Y") %>%
  quarter_to_date %>%
  rename(LOCATION = REF_AREA) %>%
  left_join(QNA_var$LOCATION, by = "LOCATION") %>%
  filter(date >= as.Date("1999-01-01")) %>%
  mutate(Location = ifelse(LOCATION == "EA20", "Europe", Location)) %>%
  group_by(Location) %>%
  mutate(obsValue = 100 * obsValue / obsValue[date == as.Date("1999-01-01")]) %>%
  left_join(colors, by = c("Location" = "country")) %>%
  mutate(color = ifelse(LOCATION != "DEU", color2, color)) %>%
  ggplot(.) + theme_minimal() + xlab("") + ylab("") +
  geom_line(aes(x = date, y = obsValue, color = color)) + add_4flags +
  scale_color_identity() +
  scale_x_date(breaks = c(seq(1999, 2100, 5), seq(1997, 2100, 5)) %>% paste0("-01-01") %>% as.Date,
               labels = date_format("%Y")) +
  theme(legend.position = "none") +
  scale_y_log10(breaks = seq(50, 400, 10))