| source | dataset | Title | .html | .rData |
|---|---|---|---|---|
| oecd | QNA_EXPENDITURE_CAPITA | Quarterly National Accounts, GDP Per Capita | 2026-01-15 | 2026-01-15 |
| oecd | QNA_EXPENDITURE_USD | Quarterly GDP and components - expenditure approach | 2026-01-15 | 2026-01-09 |
Quarterly GDP and components - expenditure approach
Data - OECD
Info
Last
| obsTime | Nobs |
|---|---|
| 2025-Q3 | 312 |
REF_AREA
Code
QNA_EXPENDITURE_USD %>%
  left_join(REF_AREA, by = "REF_AREA") %>%
  group_by(REF_AREA, Ref_area) %>%
  summarise(Nobs = n()) %>%
  arrange(-Nobs) %>%
  print_table_conditional()
UNIT_MEASURE
Code
QNA_EXPENDITURE_USD %>%
  left_join(UNIT_MEASURE, by = "UNIT_MEASURE") %>%
  group_by(UNIT_MEASURE, Unit_measure) %>%
  summarise(Nobs = n()) %>%
  arrange(-Nobs) %>%
print_table_conditional()| UNIT_MEASURE | Unit_measure | Nobs |
|---|---|---|
| USD_PPP | US dollars, PPP converted | 170822 |
SECTOR
Code
QNA_EXPENDITURE_USD %>%
  left_join(SECTOR, by = "SECTOR") %>%
  group_by(SECTOR, Sector) %>%
  summarise(Nobs = n()) %>%
  arrange(-Nobs) %>%
print_table_conditional()| SECTOR | Sector | Nobs |
|---|---|---|
| S1 | Total economy | 114222 |
| S13 | General government | 28414 |
| S1M | Households and non-profit institutions serving households (NPISH) | 28186 |
ADJUSTMENT
Code
QNA_EXPENDITURE_USD %>%
  left_join(ADJUSTMENT, by = "ADJUSTMENT") %>%
  group_by(ADJUSTMENT, Adjustment) %>%
  summarise(Nobs = n()) %>%
  arrange(-Nobs) %>%
print_table_conditional()| ADJUSTMENT | Adjustment | Nobs |
|---|---|---|
| Y | Calendar and seasonally adjusted | 170822 |
PRICE_BASE
Code
QNA_EXPENDITURE_USD %>%
  left_join(PRICE_BASE, by = "PRICE_BASE") %>%
  group_by(PRICE_BASE, Price_base) %>%
  summarise(Nobs = n()) %>%
  arrange(-Nobs) %>%
print_table_conditional()| PRICE_BASE | Price_base | Nobs |
|---|---|---|
| LR | Chain linked volume (rebased) | 85812 |
| V | Current prices | 85010 |
FREQ
Code
QNA_EXPENDITURE_USD %>%
  left_join(FREQ, by = "FREQ") %>%
  group_by(FREQ, Freq) %>%
  summarise(Nobs = n()) %>%
  arrange(-Nobs) %>%
print_table_conditional()| FREQ | Freq | Nobs |
|---|---|---|
| Q | Quarterly | 136881 |
| A | Annual | 33941 |
TRANSACTION
Code
QNA_EXPENDITURE_USD %>%
  left_join(TRANSACTION, by = "TRANSACTION") %>%
  group_by(TRANSACTION, Transaction) %>%
  summarise(Nobs = n()) %>%
  arrange(-Nobs) %>%
print_table_conditional()| TRANSACTION | Transaction | Nobs |
|---|---|---|
| P3 | Final consumption expenditure | 56600 |
| B1GQ | Gross domestic product | 28900 |
| P6 | Exports of goods and services | 28454 |
| P7 | Imports of goods and services | 28454 |
| P51G | Gross fixed capital formation | 28414 |
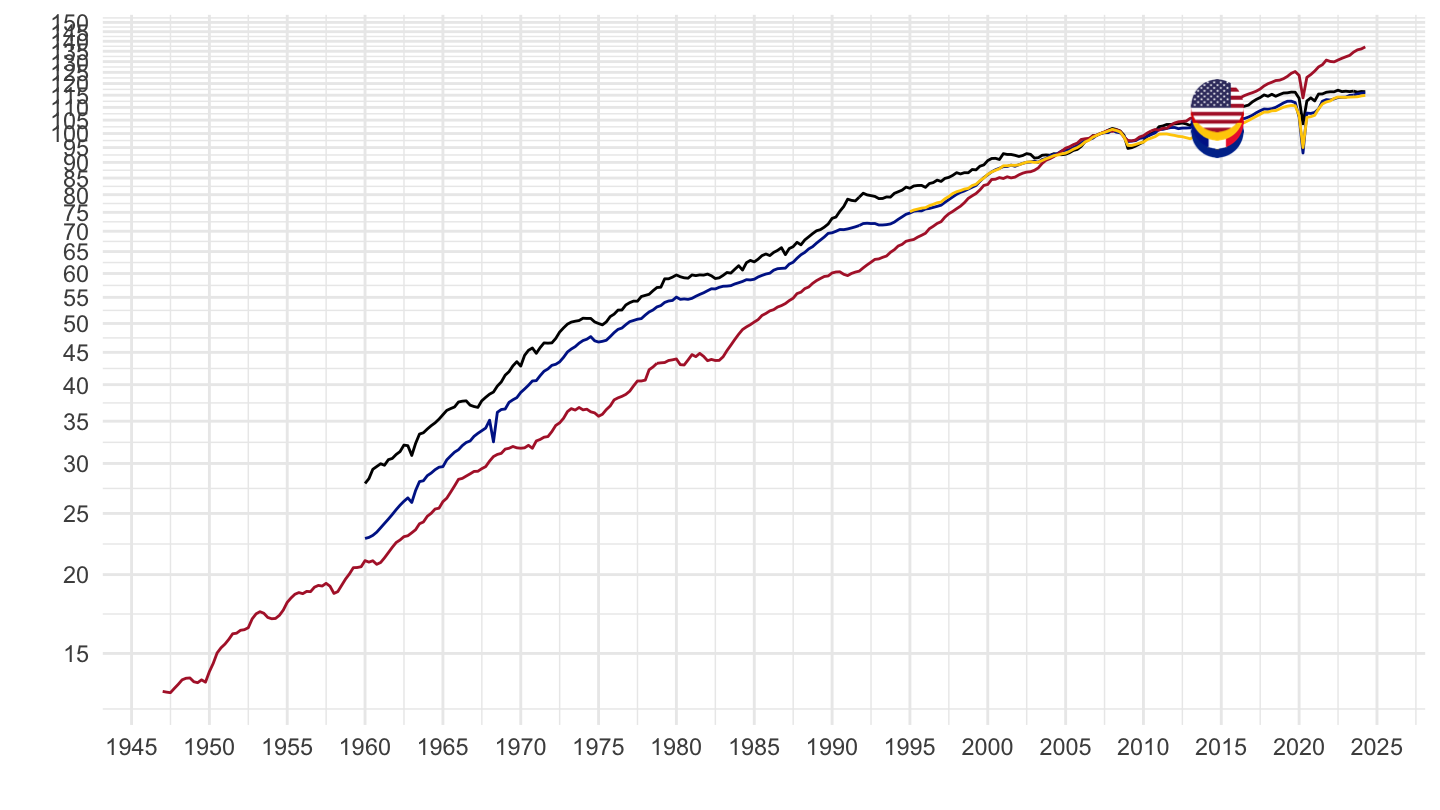
U.S., Europe, France, Germany
All
Code
QNA_EXPENDITURE_USD %>%
  filter(REF_AREA %in% c("USA", "EA20", "FRA", "DEU"),
         FREQ == "Q",
         TRANSACTION == "B1GQ",
         PRICE_BASE == "LR",
         ADJUSTMENT == "Y",
         SECTOR == "S1") %>%
  quarter_to_date %>%
  arrange(desc(date)) %>%
  rename(LOCATION = REF_AREA) %>%
  left_join(QNA_var$LOCATION, by = "LOCATION") %>%
  mutate(Location = ifelse(LOCATION == "EA20", "Europe", Location)) %>%
  group_by(Location) %>%
  mutate(obsValue = 100 * obsValue / obsValue[date == as.Date("2007-04-01")]) %>%
  left_join(colors, by = c("Location" = "country")) %>%
  mutate(color = ifelse(LOCATION != "DEU", color2, color)) %>%
  ggplot(.) + theme_minimal() + xlab("") + ylab("") +
  geom_line(aes(x = date, y = obsValue, color = color)) + add_4flags +
  scale_color_identity() +
  scale_x_date(breaks = c(seq(1900, 2100, 5)) %>% paste0("-01-01") %>% as.Date,
               labels = date_format("%Y")) +
  theme(legend.position = "none") +
  scale_y_log10(breaks = seq(5, 200, 5))
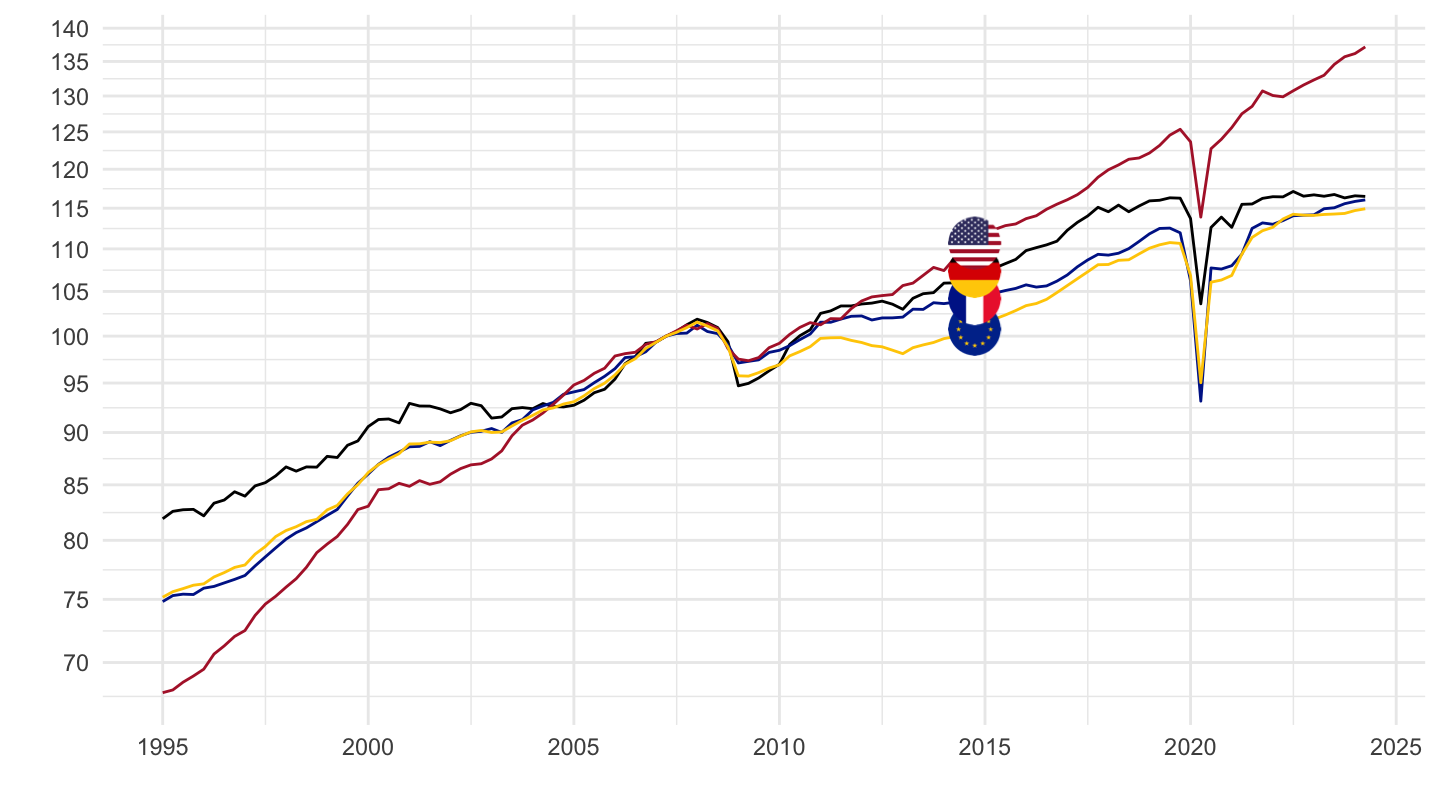
1995-
Code
QNA_EXPENDITURE_USD %>%
  filter(REF_AREA %in% c("USA", "EA20", "FRA", "DEU"),
         FREQ == "Q",
         TRANSACTION == "B1GQ",
         PRICE_BASE == "LR",
         ADJUSTMENT == "Y",
         SECTOR == "S1") %>%
  quarter_to_date %>%
  arrange(desc(date)) %>%
  rename(LOCATION = REF_AREA) %>%
  left_join(QNA_var$LOCATION, by = "LOCATION") %>%
  filter(date >= as.Date("1995-01-01")) %>%
  mutate(Location = ifelse(LOCATION == "EA20", "Europe", Location)) %>%
  group_by(Location) %>%
  mutate(obsValue = 100 * obsValue / obsValue[date == as.Date("2007-04-01")]) %>%
  left_join(colors, by = c("Location" = "country")) %>%
  mutate(color = ifelse(LOCATION != "DEU", color2, color)) %>%
  ggplot(.) + theme_minimal() + xlab("") + ylab("") +
  geom_line(aes(x = date, y = obsValue, color = color)) + add_4flags +
  scale_color_identity() +
  scale_x_date(breaks = c(seq(1995, 2100, 5)) %>% paste0("-01-01") %>% as.Date,
               labels = date_format("%Y")) +
  theme(legend.position = "none") +
  scale_y_log10(breaks = seq(50, 200, 5))
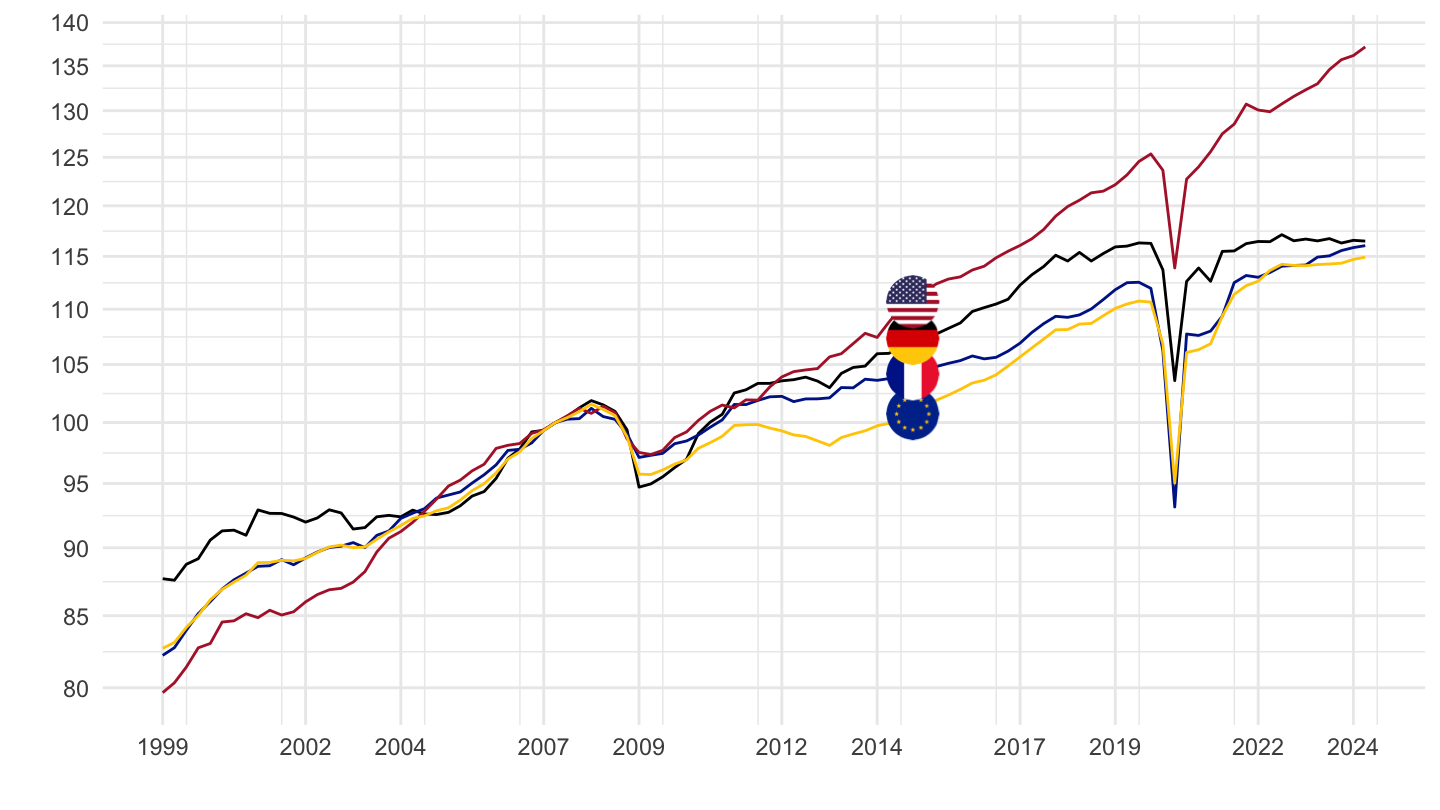
1999-
Tous
Code
QNA_EXPENDITURE_USD %>%
  filter(REF_AREA %in% c("USA", "EA20", "FRA", "DEU"),
         FREQ == "Q",
         TRANSACTION == "B1GQ",
         PRICE_BASE == "LR",
         ADJUSTMENT == "Y",
         SECTOR == "S1") %>%
  quarter_to_date %>%
  rename(LOCATION = REF_AREA) %>%
  left_join(QNA_var$LOCATION, by = "LOCATION") %>%
  filter(date >= as.Date("1999-01-01")) %>%
  mutate(Location = ifelse(LOCATION == "EA20", "Europe", Location)) %>%
  group_by(Location) %>%
  mutate(obsValue = 100 * obsValue / obsValue[date == as.Date("2007-04-01")]) %>%
  left_join(colors, by = c("Location" = "country")) %>%
  mutate(color = ifelse(LOCATION != "DEU", color2, color)) %>%
  ggplot(.) + theme_minimal() + xlab("") + ylab("") +
  geom_line(aes(x = date, y = obsValue, color = color)) + add_4flags +
  scale_color_identity() +
  scale_x_date(breaks = c(seq(1999, 2100, 5), seq(1997, 2100, 5)) %>% paste0("-01-01") %>% as.Date,
               labels = date_format("%Y")) +
  theme(legend.position = "none") +
  scale_y_log10(breaks = seq(50, 200, 5))
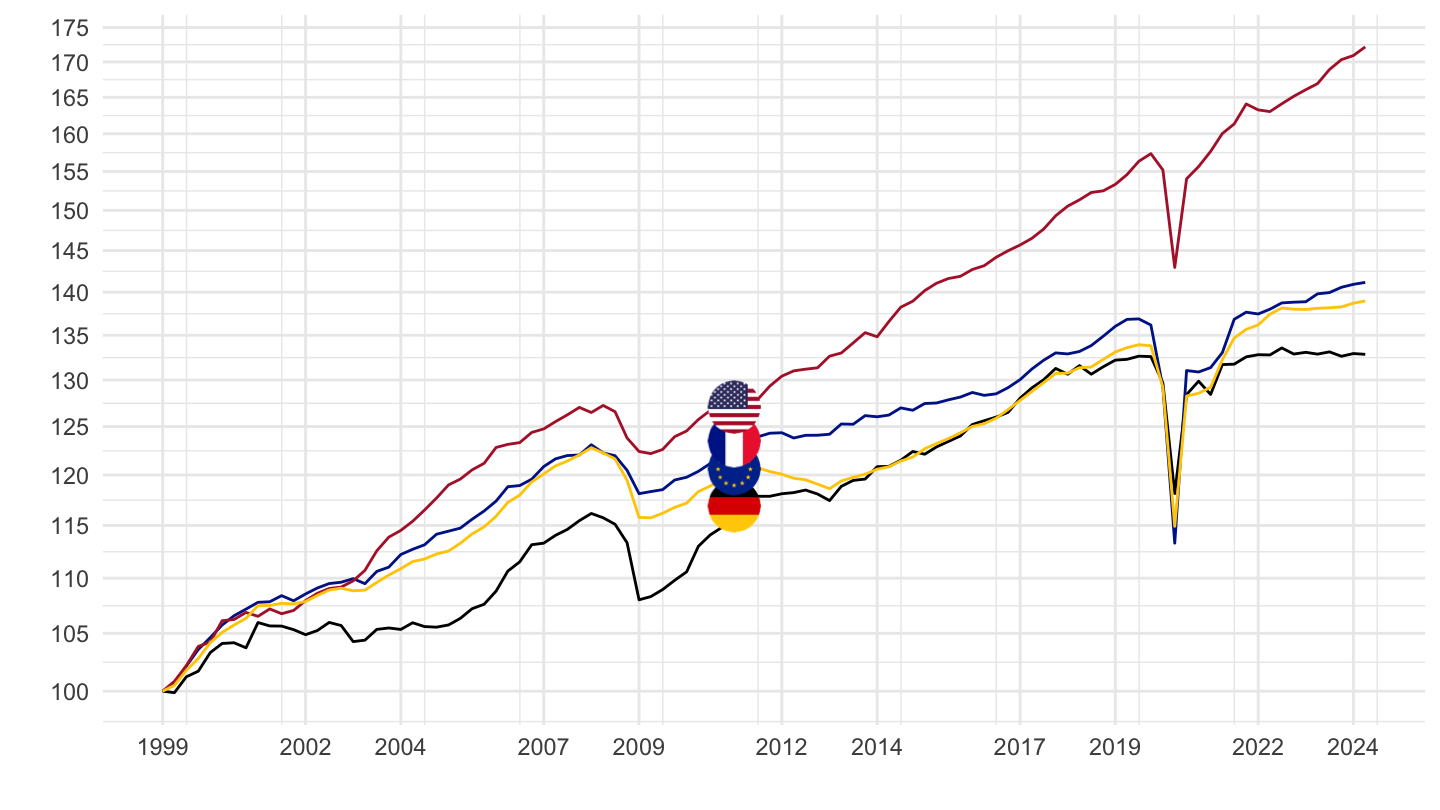
Base 100 = 1999
Code
QNA_EXPENDITURE_USD %>%
  filter(REF_AREA %in% c("USA", "EA20", "FRA", "DEU"),
         FREQ == "Q",
         TRANSACTION == "B1GQ",
         PRICE_BASE == "LR",
         ADJUSTMENT == "Y",
         SECTOR == "S1") %>%
  quarter_to_date %>%
  rename(LOCATION = REF_AREA) %>%
  left_join(QNA_var$LOCATION, by = "LOCATION") %>%
  filter(date >= as.Date("1999-01-01")) %>%
  mutate(Location = ifelse(LOCATION == "EA20", "Europe", Location)) %>%
  group_by(Location) %>%
  mutate(obsValue = 100 * obsValue / obsValue[date == as.Date("1999-01-01")]) %>%
  left_join(colors, by = c("Location" = "country")) %>%
  mutate(color = ifelse(LOCATION != "DEU", color2, color)) %>%
  ggplot(.) + theme_minimal() + xlab("") + ylab("") +
  geom_line(aes(x = date, y = obsValue, color = color)) + add_4flags +
  scale_color_identity() +
  scale_x_date(breaks = c(seq(1999, 2100, 5), seq(1997, 2100, 5)) %>% paste0("-01-01") %>% as.Date,
               labels = date_format("%Y")) +
  theme(legend.position = "none") +
  scale_y_log10(breaks = seq(50, 200, 5))