
Last data update: 06 oct. 2026, 15:04
Last compile: 19 oct. 2026, 23:09
Les remboursements de capital se déduisent de l’identité de stock :
\[\text{Remboursements}_t = \text{Production}_t - \Delta\text{Encours}_t\]
MIR1.M.FR.B.A22.A.5.A.2254U6.EUR.N, total ; MIR1.M.FR.B.A22HR…, hors renégociations, disponible depuis 2011). Moins précise que l’ACPR : arrondie à 0,1 Md€ et de champ différent (écarts annuels de −20 % à +40 % avec l’ACPR sur 2012-2026). À prendre comme un ordre de grandeur.BSI1.M.FR.N.R.A220Z.A.4.U6.2250.Z01.E, ménages et ISBLSM, depuis 1993) plutôt que la variation brute d’encours, qui contient une rupture en 2014.Limites : la variation d’encours est nette de titrisation et d’amortissements comptables, et le solde production − Δ encours contient donc aussi les remboursements anticipés. Rembourser du capital est de l’épargne, pas une perte de richesse : l’indicateur mesure le revenu arbitrable.
remboursements_credit_habitat |>
  filter(!is.na(ratio_brut)) |>
  select(date, `(A) Production brute` = ratio_brut, `(B) Production hors refinancements` = ratio_hors_refi) |>
  pivot_longer(-date) |>
  ggplot(aes(x = date, y = value, color = name)) + geom_line() +
  theme_minimal() + xlab("") + ylab("Remboursements de capital / RDB (cumul 4 trimestres)") +
  scale_color_manual(values = viridis(3)[1:2]) +
  scale_x_date(date_breaks = "1 year", date_labels = "%Y") +
  scale_y_continuous(labels = percent_format(accuracy = 1)) +
  theme(legend.title = element_blank(), legend.position = "bottom")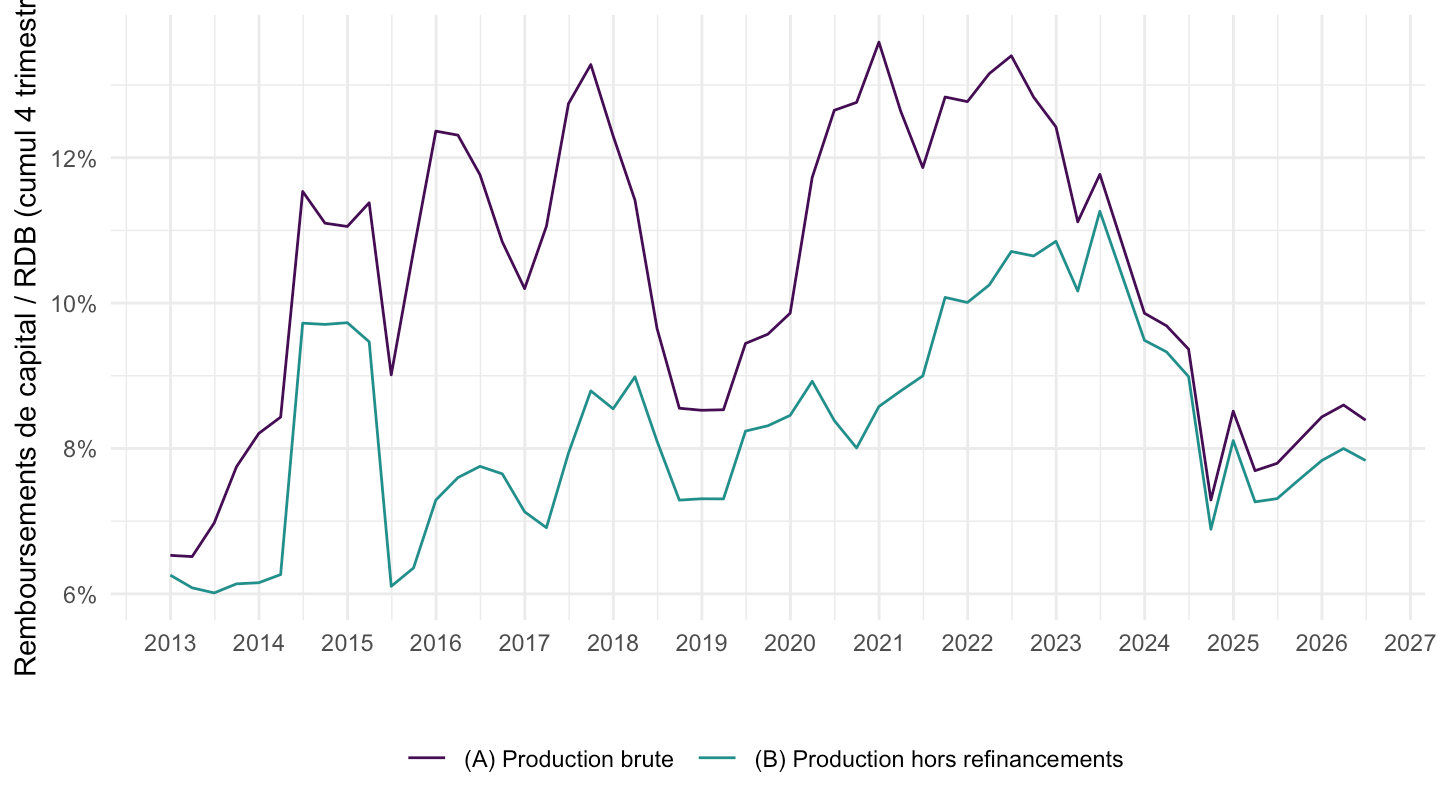
L’ACPR ne publie la production mensuelle que depuis 2012. Avant, on dispose de quatre approximations, de plus en plus grossières (graphiques depuis 1995) :
remboursements_credit_habitat |>
  filter(date >= "1995-01-01") |>
  select(date, `Proxy (taux d'amortissement constant)` = ratio_proxy,
         `Production MIR, total` = ratio_mir_brut, `Production MIR, hors renégociations` = ratio_mir_hors_reneg,
         `Production ACPR, hors refinancements` = ratio_hors_refi) |>
  pivot_longer(-date) |>
  filter(!is.na(value)) |>
  ggplot(aes(x = date, y = value, color = name)) + geom_line() +
  theme_minimal() + xlab("") + ylab("Remboursements de capital / RDB (cumul 4 trimestres)") +
  scale_color_manual(values = viridis(5)[1:4]) +
  scale_x_date(date_breaks = "2 years", date_labels = "%Y") +
  scale_y_continuous(labels = percent_format(accuracy = 1)) +
  theme(legend.title = element_blank(), legend.position = "bottom")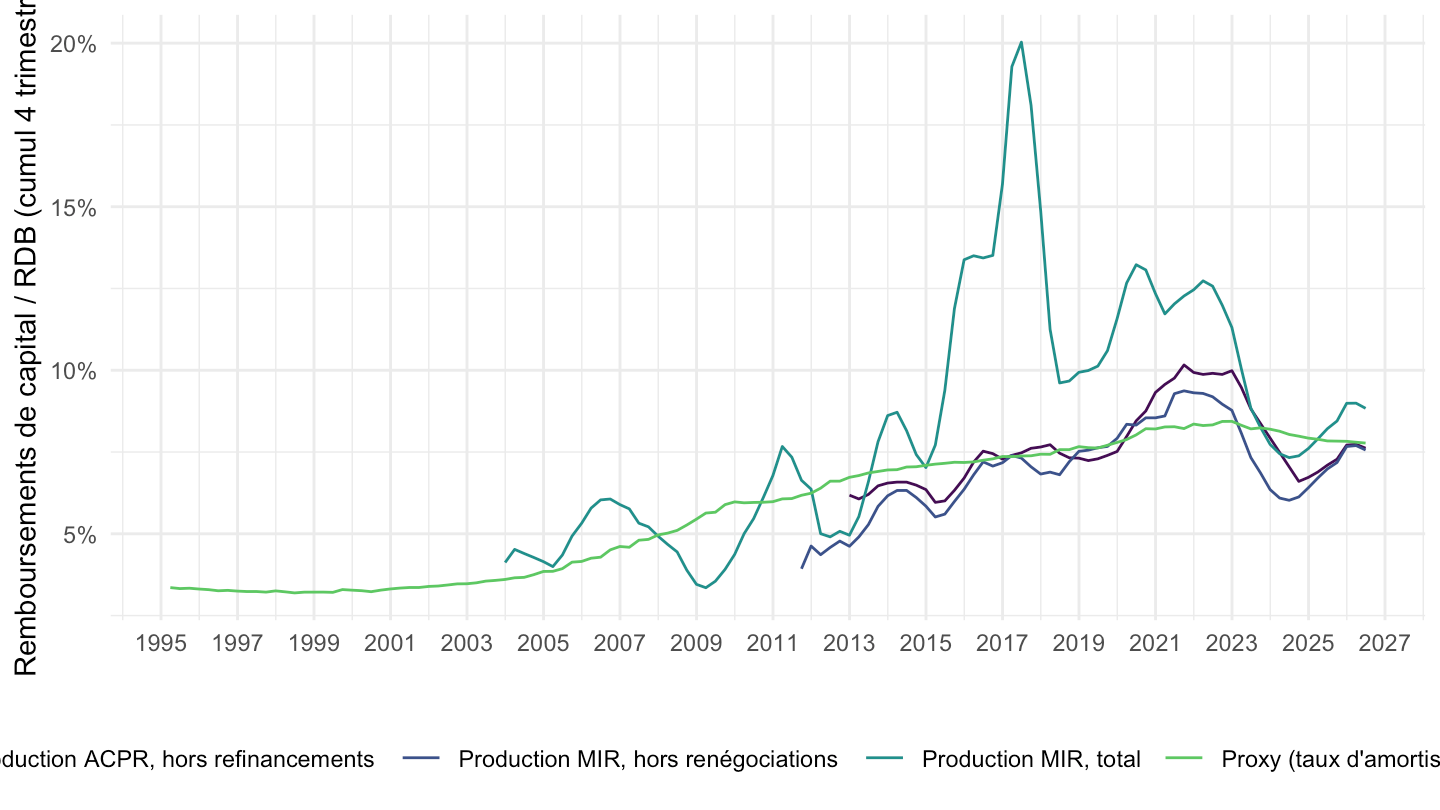
remboursements_credit_habitat |>
  filter(!is.na(encours_rdb), date >= "1995-01-01") |>
  ggplot(aes(x = date, y = encours_rdb)) + geom_line(color = viridis(3)[1]) +
  theme_minimal() + xlab("") + ylab("Encours de crédits à l'habitat / RDB (cumul 4 trimestres)") +
  scale_x_date(date_breaks = "2 years", date_labels = "%Y") +
  scale_y_continuous(labels = percent_format(accuracy = 1))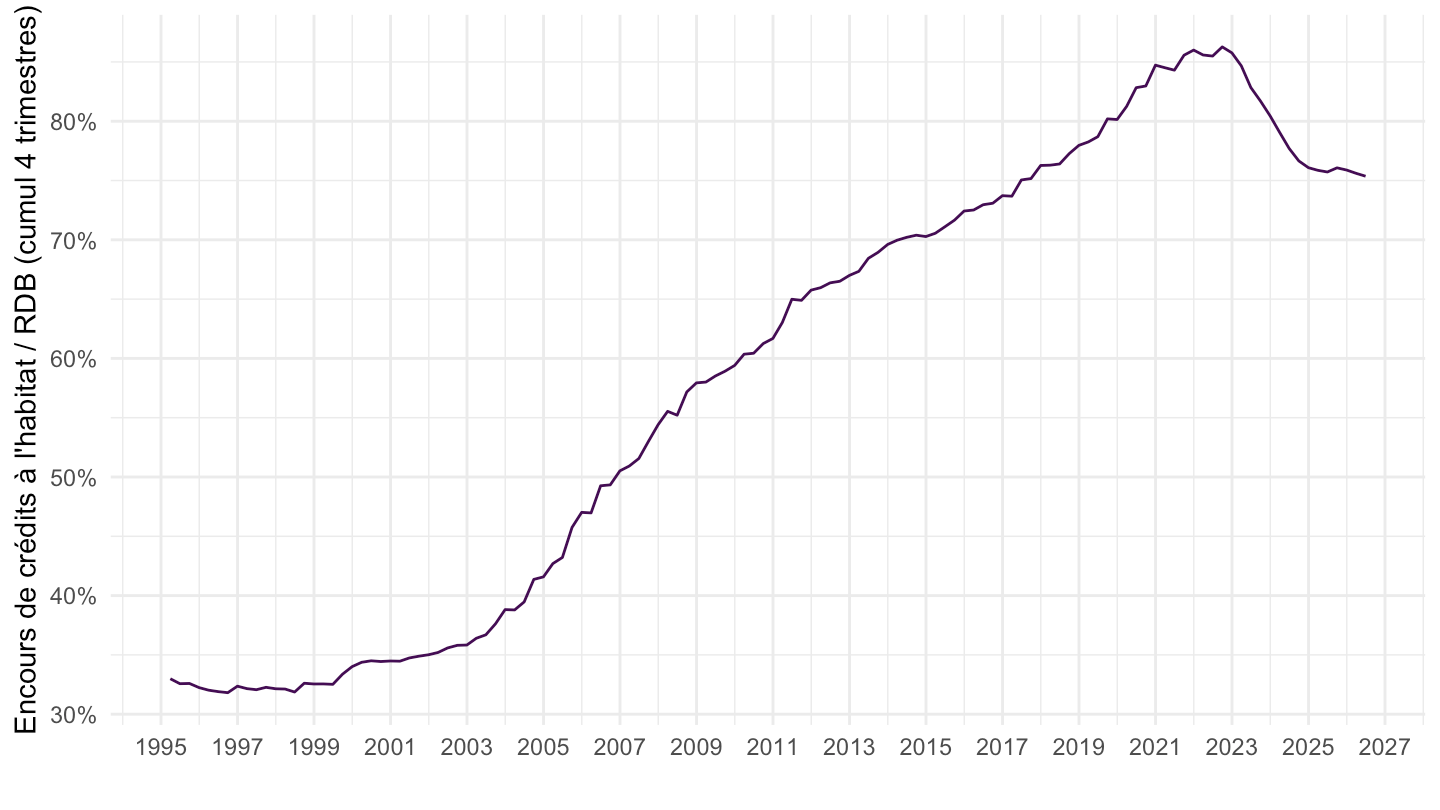
remboursements_credit_habitat |>
  filter(!is.na(dsr_menages), date >= "1995-01-01") |>
  ggplot(aes(x = date, y = dsr_menages)) + geom_line(color = viridis(3)[1]) +
  theme_minimal() + xlab("") + ylab("Service de la dette des ménages (intérêts + capital, % du revenu)") +
  scale_x_date(date_breaks = "2 years", date_labels = "%Y") +
  scale_y_continuous(labels = percent_format(accuracy = 1))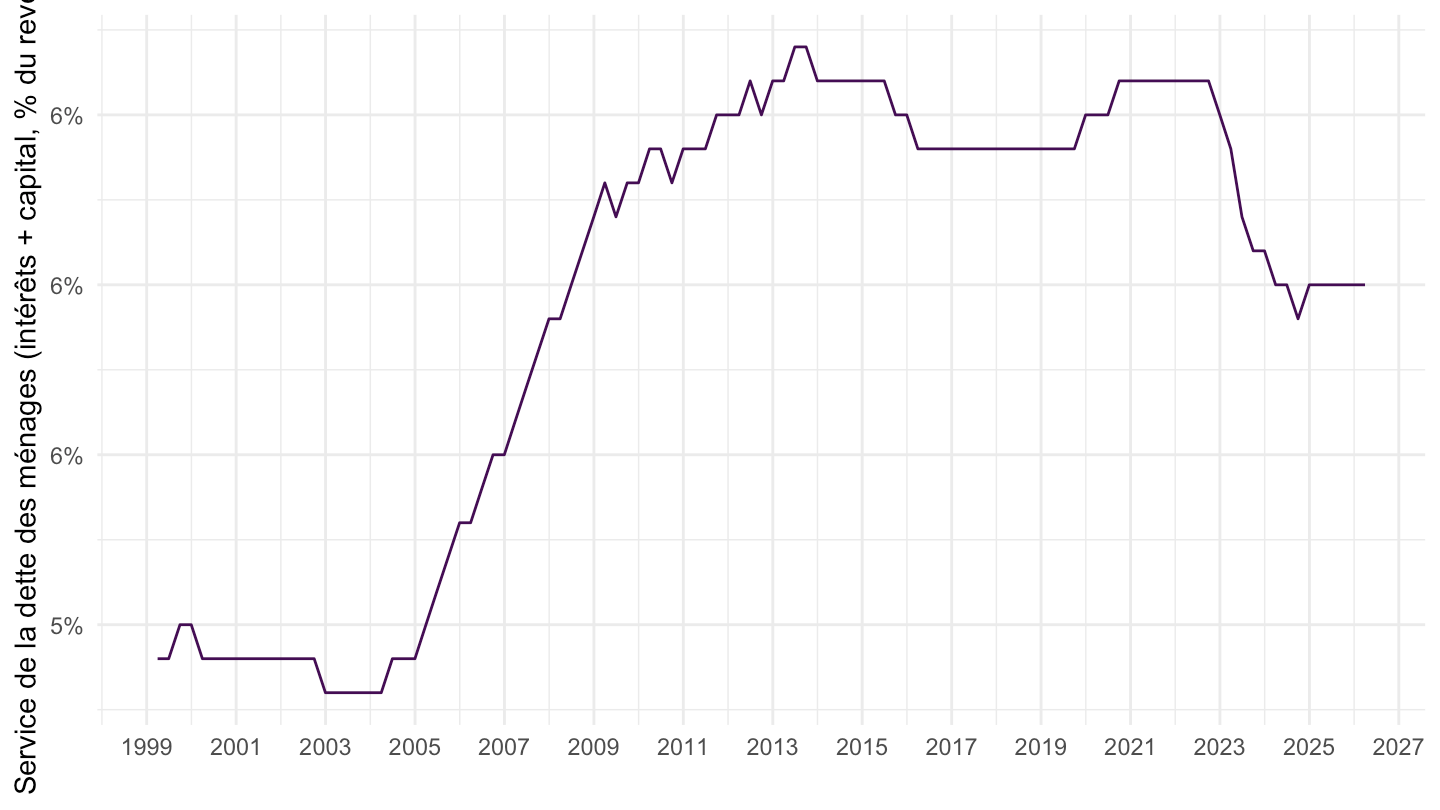
remboursements_credit_habitat |>
  filter(!is.na(rdb_4t)) |>
  transmute(date,
            `Revenu disponible brut` = rdb_4t,
            `RDB − remboursements (A, brute)` = rdb_4t - rembt_brut_4t,
            `RDB − remboursements (B, hors refinancements)` = rdb_4t - rembt_hors_refi_4t) |>
  pivot_longer(-date) |>
  ggplot(aes(x = date, y = value / 1000, color = name)) + geom_line() +
  theme_minimal() + xlab("") + ylab("Milliards d'euros (cumul 4 trimestres)") +
  scale_color_manual(values = viridis(4)[1:3]) +
  scale_x_date(date_breaks = "1 year", date_labels = "%Y") +
  scale_y_continuous(labels = label_number(big.mark = " ")) +
  theme(legend.title = element_blank(), legend.position = "bottom")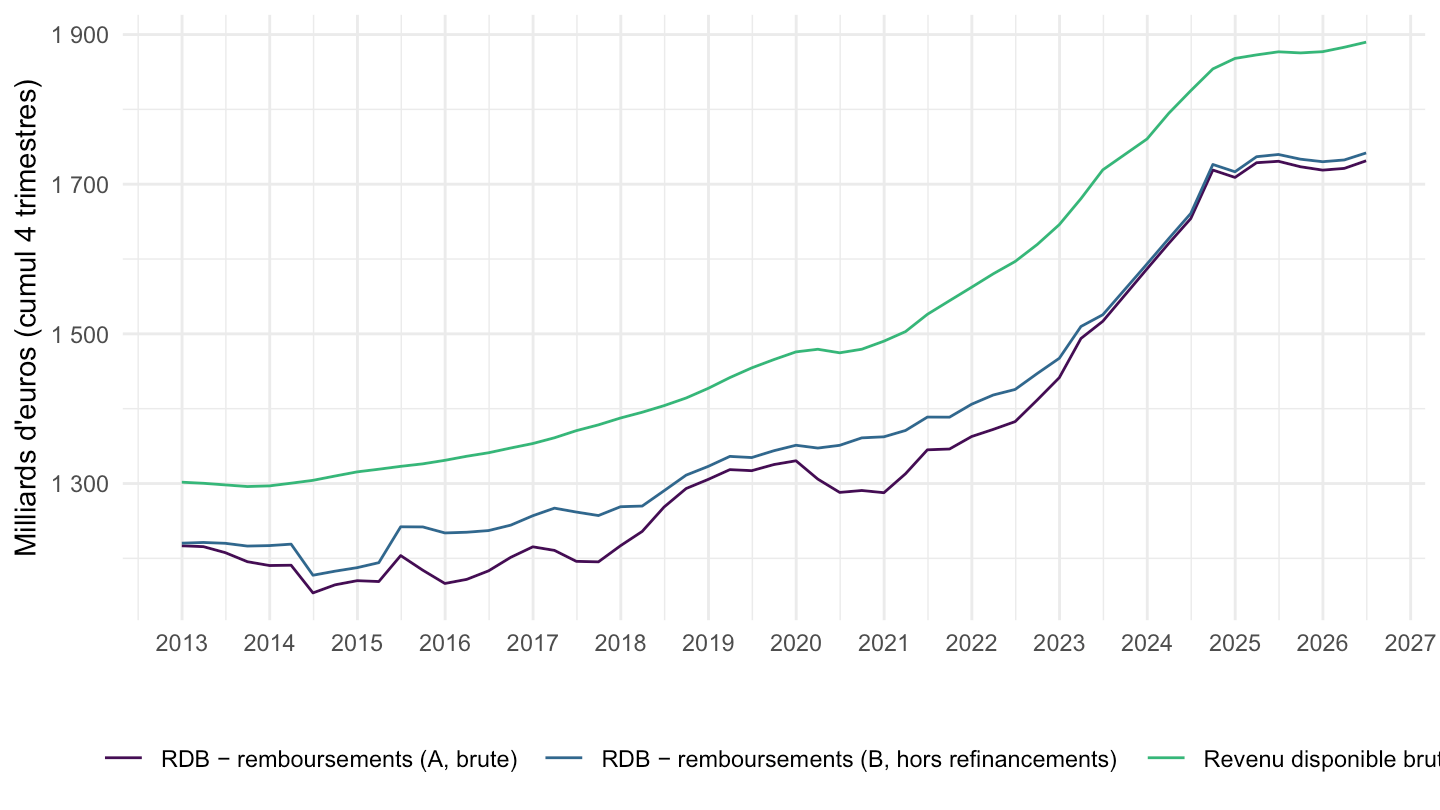
remboursements_credit_habitat |>
  filter(!is.na(rdb_4t)) |>
  transmute(date,
            `Revenu disponible brut` = rdb_4t,
            `RDB − remboursements (B, hors refinancements)` = rdb_4t - rembt_hors_refi_4t) |>
  pivot_longer(-date) |>
  group_by(name) |>
  mutate(ga = value / lag(value, 4) - 1) |>
  filter(!is.na(ga)) |>
  ggplot(aes(x = date, y = ga, color = name)) + geom_line() +
  theme_minimal() + xlab("") + ylab("Glissement annuel (%)") +
  scale_color_manual(values = viridis(3)[1:2]) +
  scale_x_date(date_breaks = "1 year", date_labels = "%Y") +
  scale_y_continuous(labels = percent_format(accuracy = 1)) +
  theme(legend.title = element_blank(), legend.position = "bottom")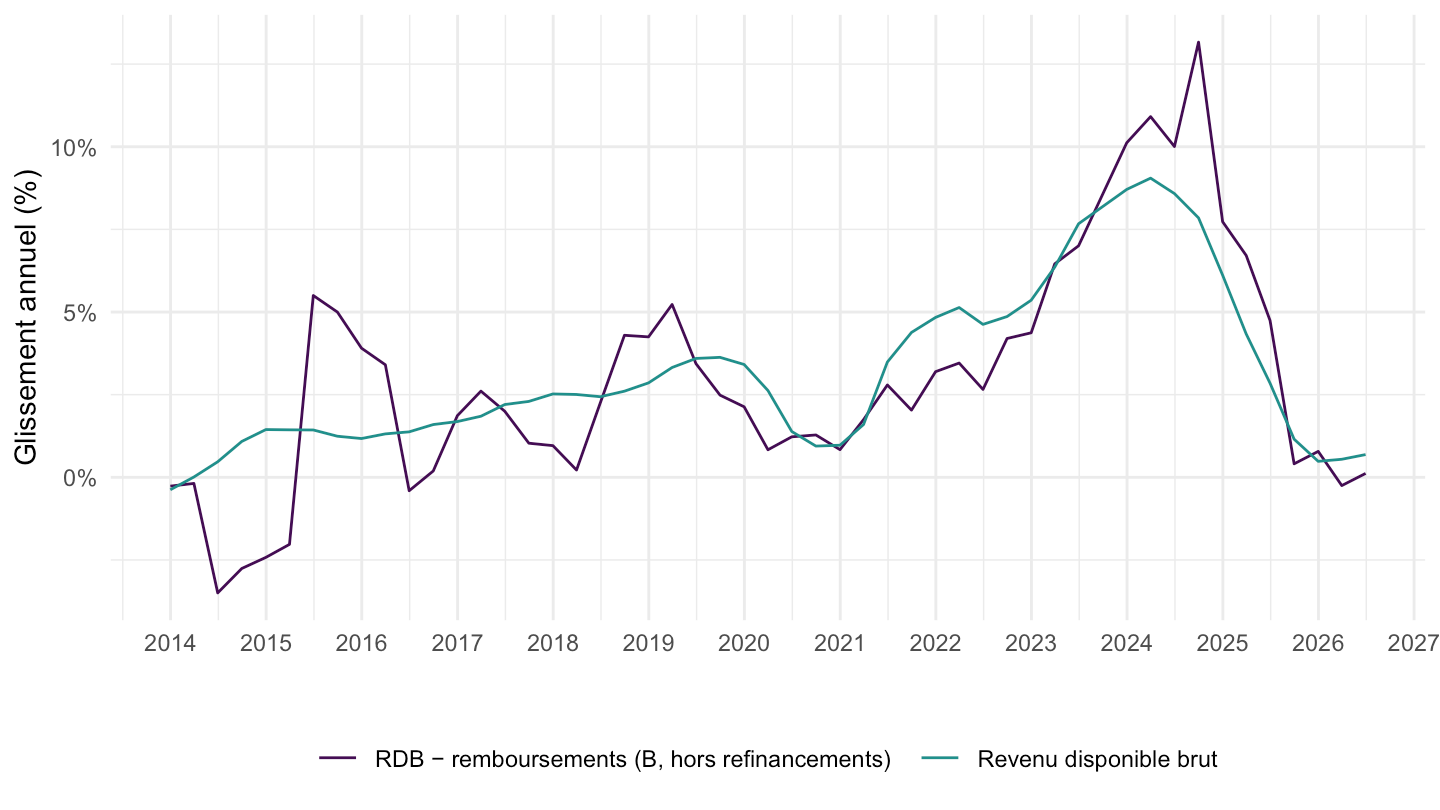
remboursements_credit_habitat |>
  filter(!is.na(rdb_4t)) |>
  transmute(date,
            `Production brute` = prod_brute_4t,
            `Production hors refinancements` = prod_hors_refi_4t,
            `Variation d'encours` = variation_encours_4t,
            `Remboursements (A)` = rembt_brut_4t,
            `Remboursements (B)` = rembt_hors_refi_4t) |>
  pivot_longer(-date) |>
  ggplot(aes(x = date, y = value / 1000, color = name)) + geom_line() +
  theme_minimal() + xlab("") + ylab("Milliards d'euros (cumul 4 trimestres)") +
  scale_color_manual(values = viridis(6)[1:5]) +
  scale_x_date(date_breaks = "1 year", date_labels = "%Y") +
  theme(legend.title = element_blank(), legend.position = "bottom")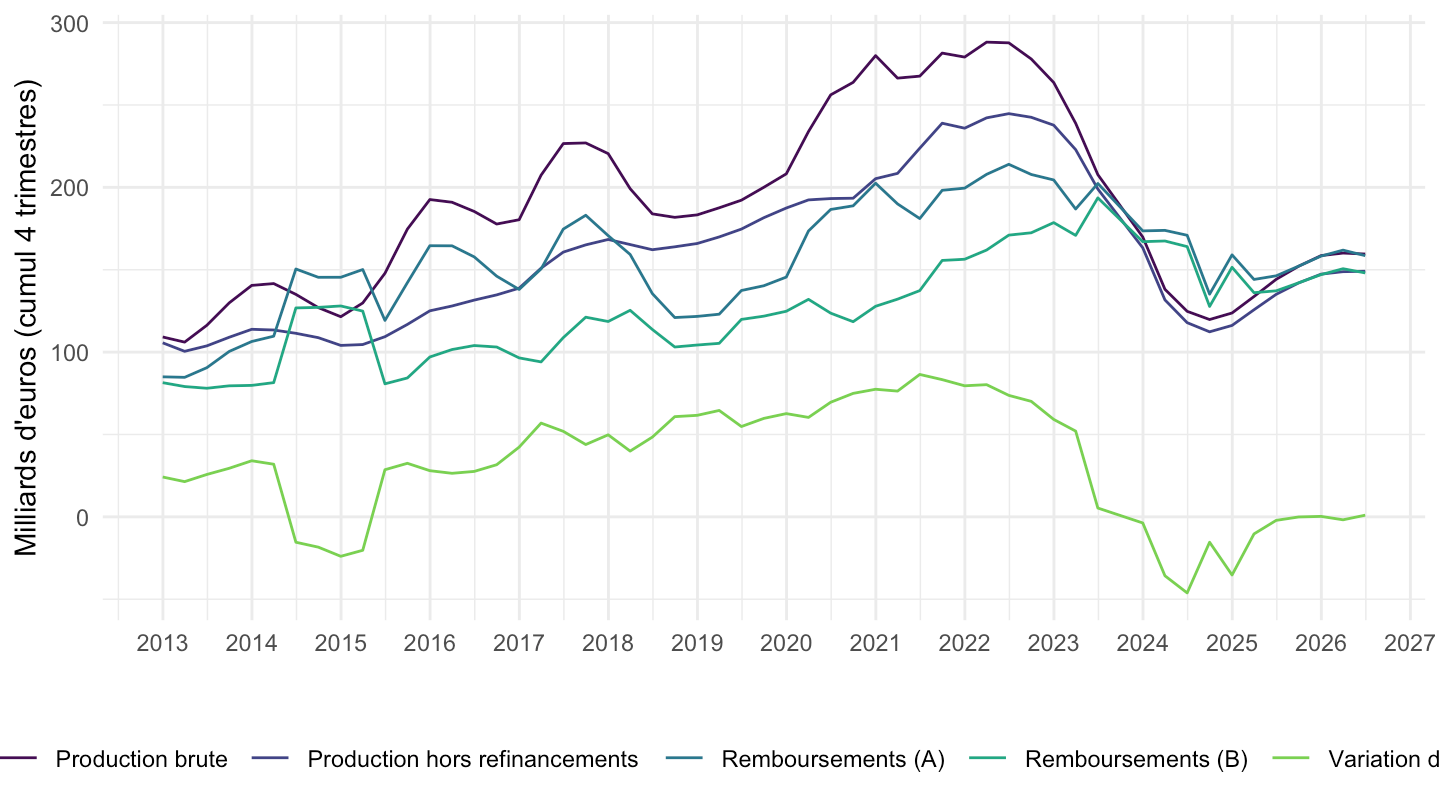
remboursements_credit_habitat |>
  filter(!is.na(taux_amortissement_brut)) |>
  select(date, `(A) Production brute` = taux_amortissement_brut,
         `(B) Production hors refinancements` = taux_amortissement_hors_refi) |>
  pivot_longer(-date) |>
  ggplot(aes(x = date, y = value, color = name)) + geom_line() +
  theme_minimal() + xlab("") + ylab("Remboursements 4T / encours il y a un an") +
  scale_color_manual(values = viridis(3)[1:2]) +
  scale_x_date(date_breaks = "1 year", date_labels = "%Y") +
  scale_y_continuous(labels = percent_format(accuracy = 1)) +
  theme(legend.title = element_blank(), legend.position = "bottom")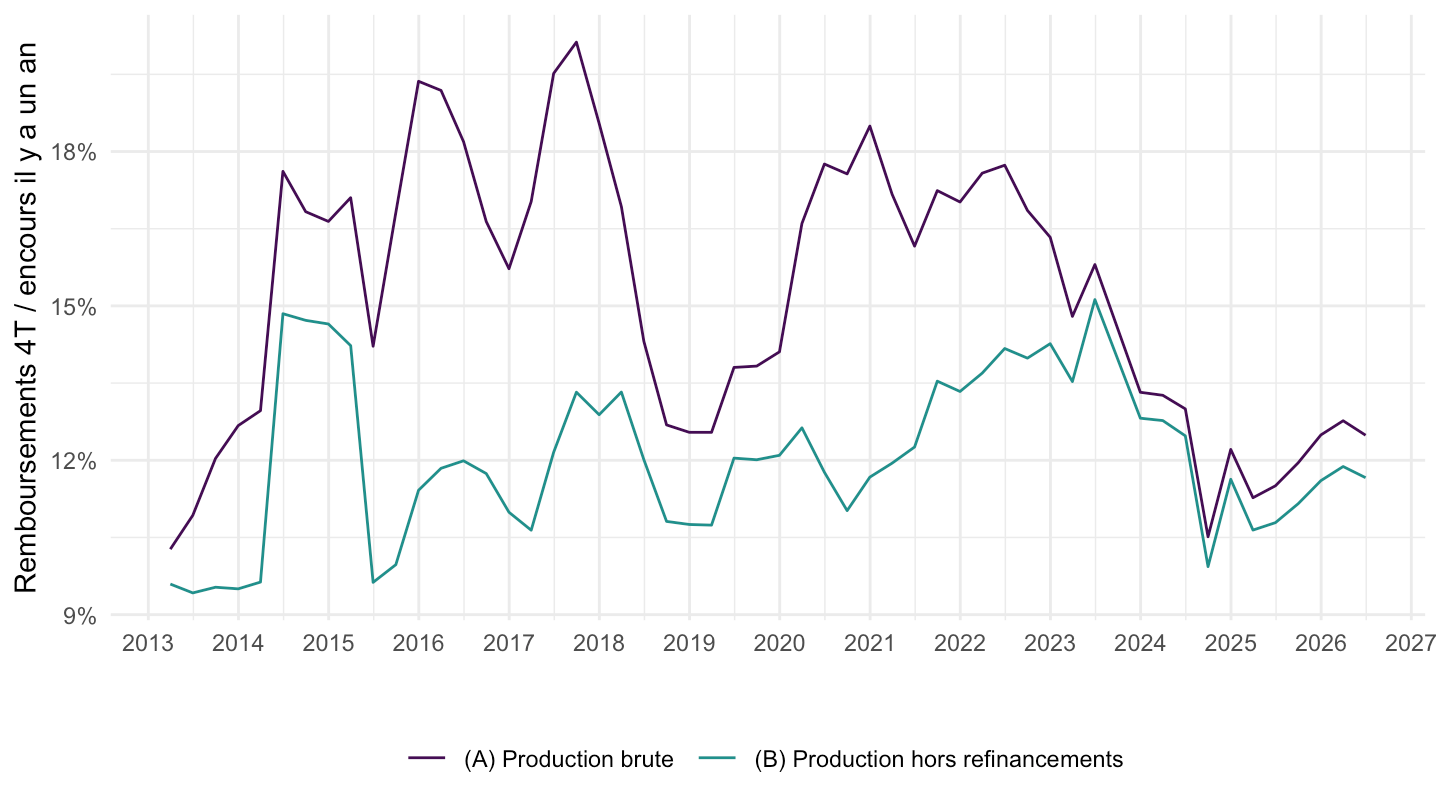
remboursements_credit_habitat |>
  arrange(desc(date)) |>
  select(date, rdb, prod_brute, prod_hors_refi, variation_encours, rembt_brut, rembt_hors_refi,
         ratio_brut, ratio_hors_refi) |>
  mutate(across(c(ratio_brut, ratio_hors_refi), ~ round(100 * .x, 1)),
         across(c(rdb, prod_brute, prod_hors_refi, variation_encours, rembt_brut, rembt_hors_refi), round)) |>
  print_table_conditional()