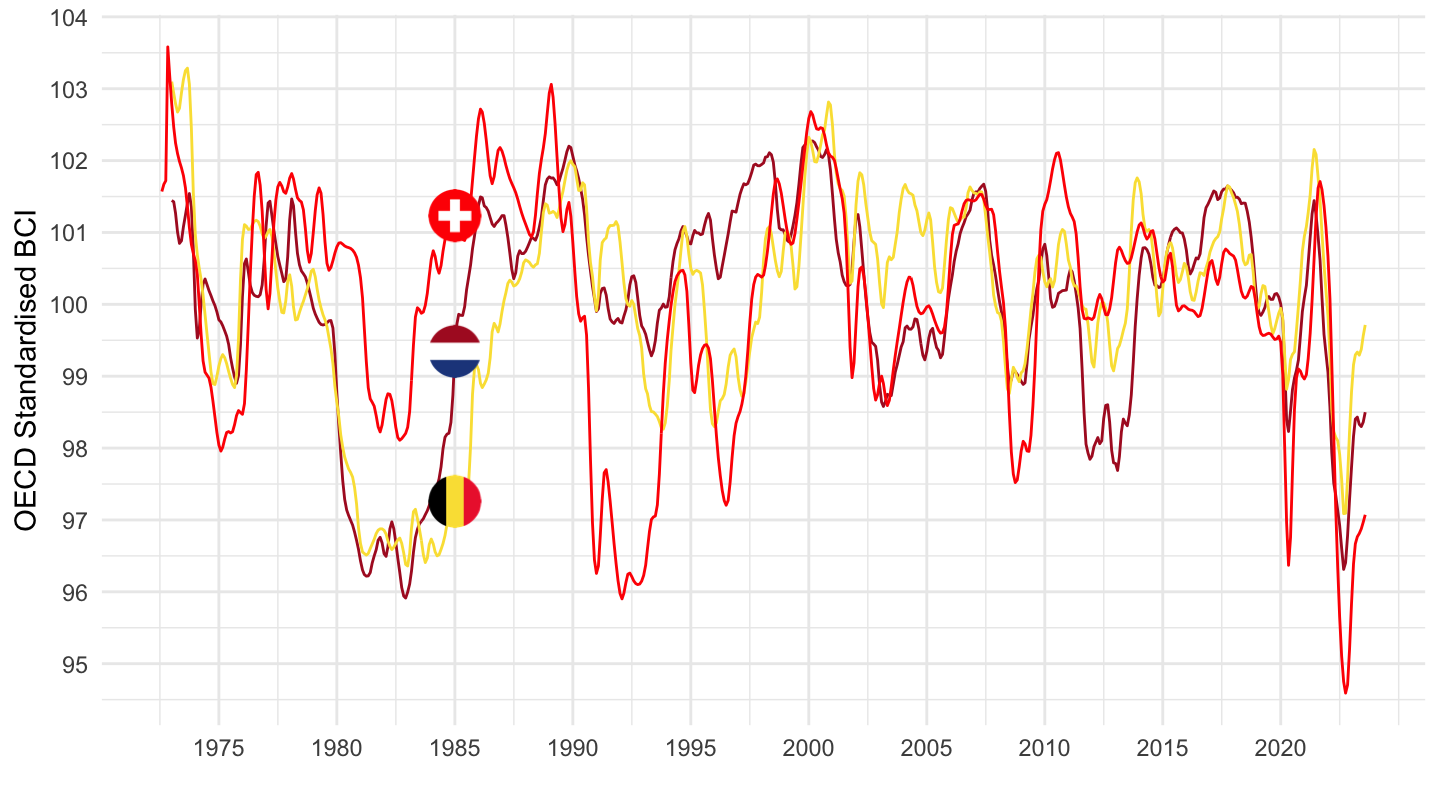
Last observation: Q2 2023 (N = 32) · août 2023 (N = 118) · 2022 (N = 5)
First observation: févr. 1947 (N = 3) · Q1 1947 (N = 1) · 1960 (N = 1)
Last data update: 02 août 2026, 09:00
Last compile: 09 oct. 2026, 23:17
Documentation: http://www.oecd.org/sdd/leading-indicators/41629509.pdf
Leading Indicators Turning Point: http://www.oecd.org/sdd/leading-indicators/CLI-components-and-turning-points.pdf.
MEI_CLI |>
  # OECD Standardised Business Confidence Indicator
  filter(LOCATION %in% c("FRA", "DEU", "JPN"),
         SUBJECT == "BSCICP03") |>
  month_to_date() |>
  left_join(MEI_CLI_var$LOCATION, by = "LOCATION") |>
  group_by(LOCATION) |>
  add_flag_color("Location") |>
  ggplot() + geom_line(aes(x = date, y = obsValue, color = color)) +
  scale_color_identity() + add_3flags +
  theme_minimal() + xlab("") + ylab("OECD Standardised BCI") +
  scale_x_date(breaks = seq(1940, 2100, 5) |> paste0("-01-01") |> as.Date(),
               labels = date_format("%Y")) +
  scale_y_continuous(breaks = seq(-10, 200, 1),
                     labels = dollar_format(accuracy = 1, prefix = "")) +
  theme(legend.position = c(0.2, 0.90),
        legend.title = element_blank())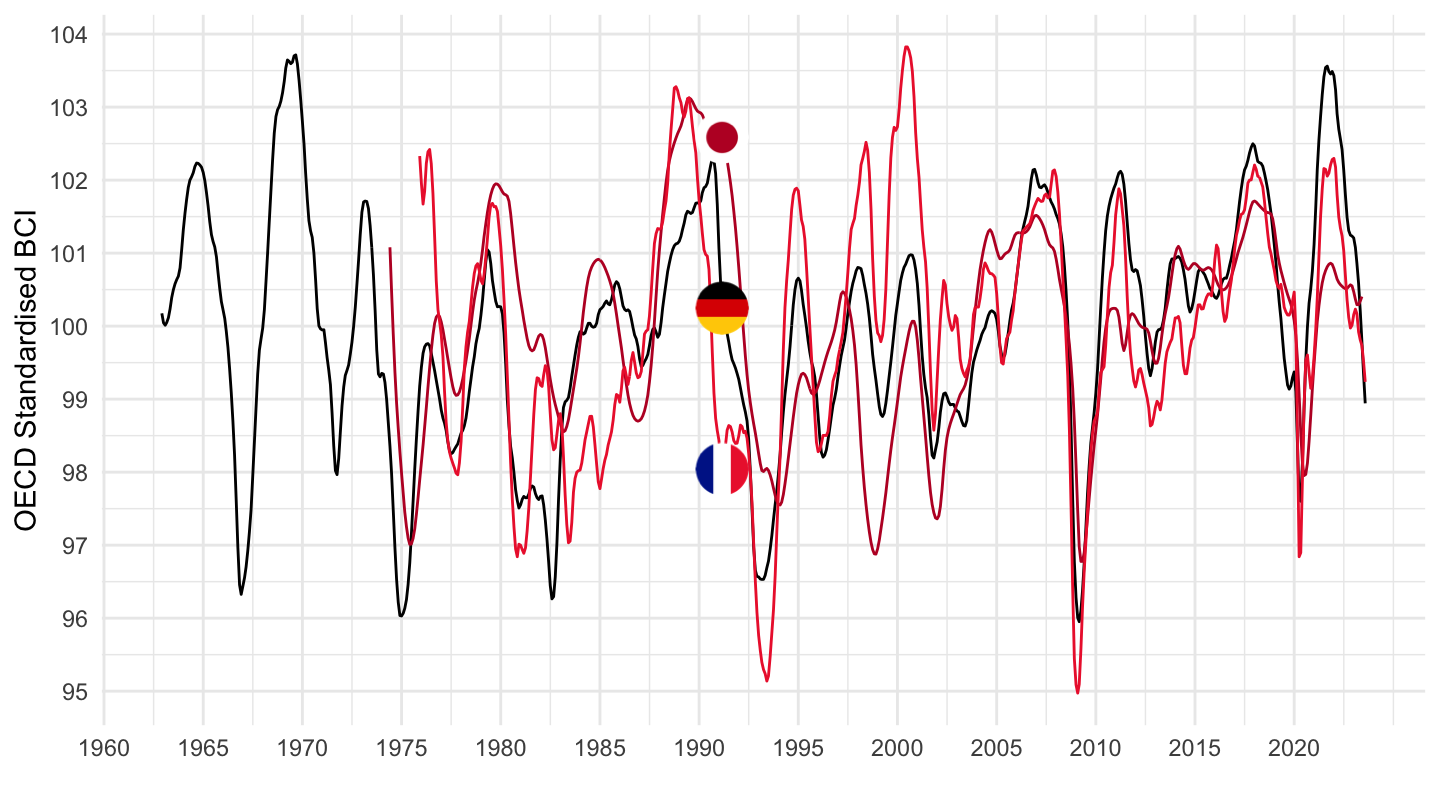
MEI_CLI |>
  # OECD Standardised Business Confidence Indicator
  filter(LOCATION %in% c("FRA", "DEU", "JPN"),
         SUBJECT == "BSCICP03") |>
  month_to_date() |>
  filter(date >= as.Date("1995-01-01")) |>
  left_join(MEI_CLI_var$LOCATION, by = "LOCATION") |>
  group_by(LOCATION) |>
  add_flag_color("Location") |>
  ggplot() + geom_line(aes(x = date, y = obsValue, color = color)) +
  scale_color_identity() + add_3flags +
  theme_minimal() + xlab("") + ylab("OECD Standardised BCI") +
  scale_x_date(breaks = seq(1940, 2100, 5) |> paste0("-01-01") |> as.Date(),
               labels = date_format("%Y")) +
  scale_y_continuous(breaks = seq(-10, 200, 1),
                     labels = dollar_format(accuracy = 1, prefix = "")) +
  theme(legend.position = c(0.2, 0.90),
        legend.title = element_blank())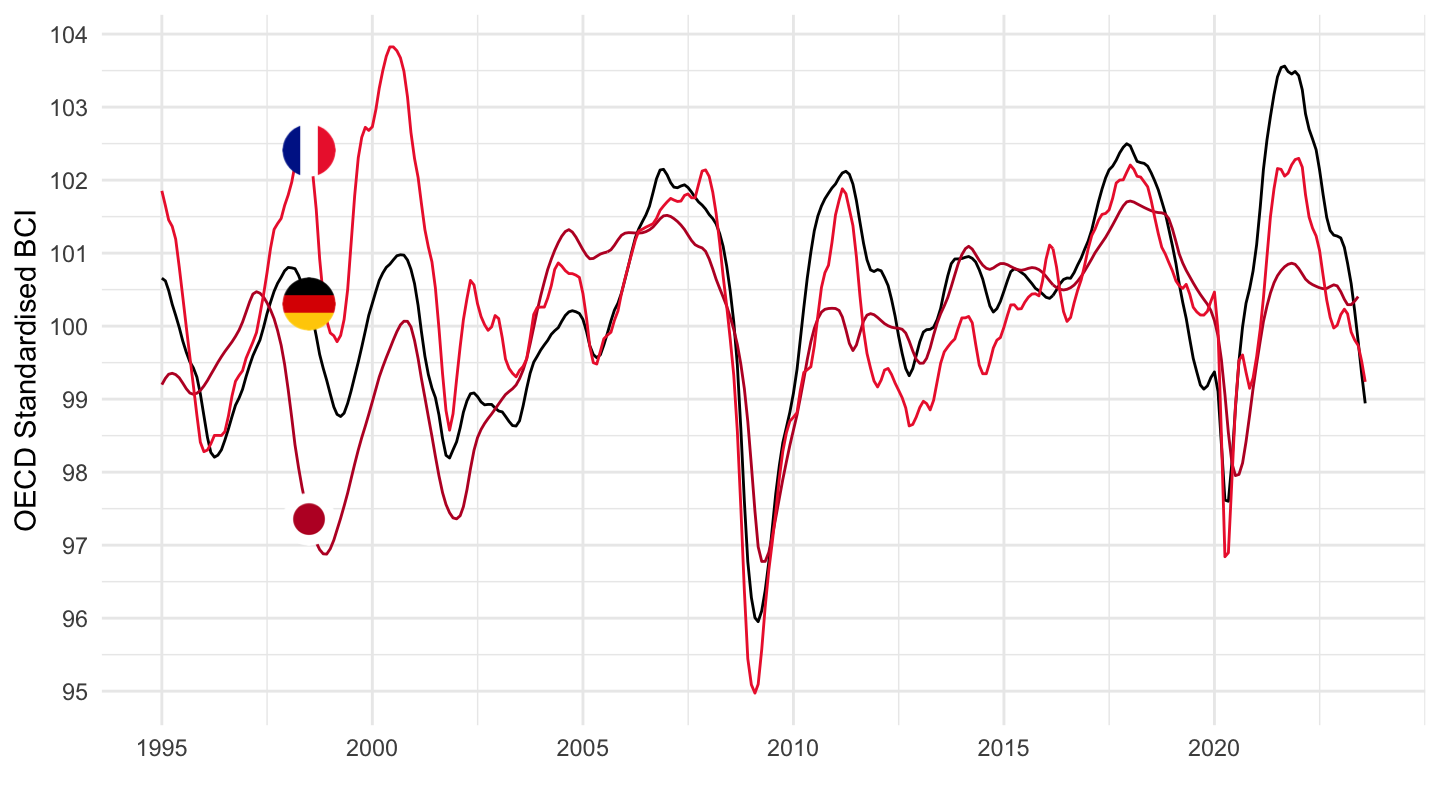
MEI_CLI |>
  # OECD Standardised Business Confidence Indicator
  filter(LOCATION %in% c("ITA", "USA", "GBR"),
         SUBJECT == "BSCICP03") |>
  month_to_date() |>
  left_join(MEI_CLI_var$LOCATION, by = "LOCATION") |>
  group_by(LOCATION) |>
  add_flag_color("Location") |>
  ggplot() + geom_line(aes(x = date, y = obsValue, color = color)) +
  scale_color_identity() + add_3flags +
  theme_minimal() + xlab("") + ylab("OECD Standardised BCI") +
  scale_x_date(breaks = seq(1940, 2100, 10) |> paste0("-01-01") |> as.Date(),
               labels = date_format("%Y")) +
  scale_y_continuous(breaks = seq(-10, 200, 1),
                     labels = dollar_format(accuracy = 1, prefix = "")) +
  theme(legend.position = c(0.2, 0.90),
        legend.title = element_blank())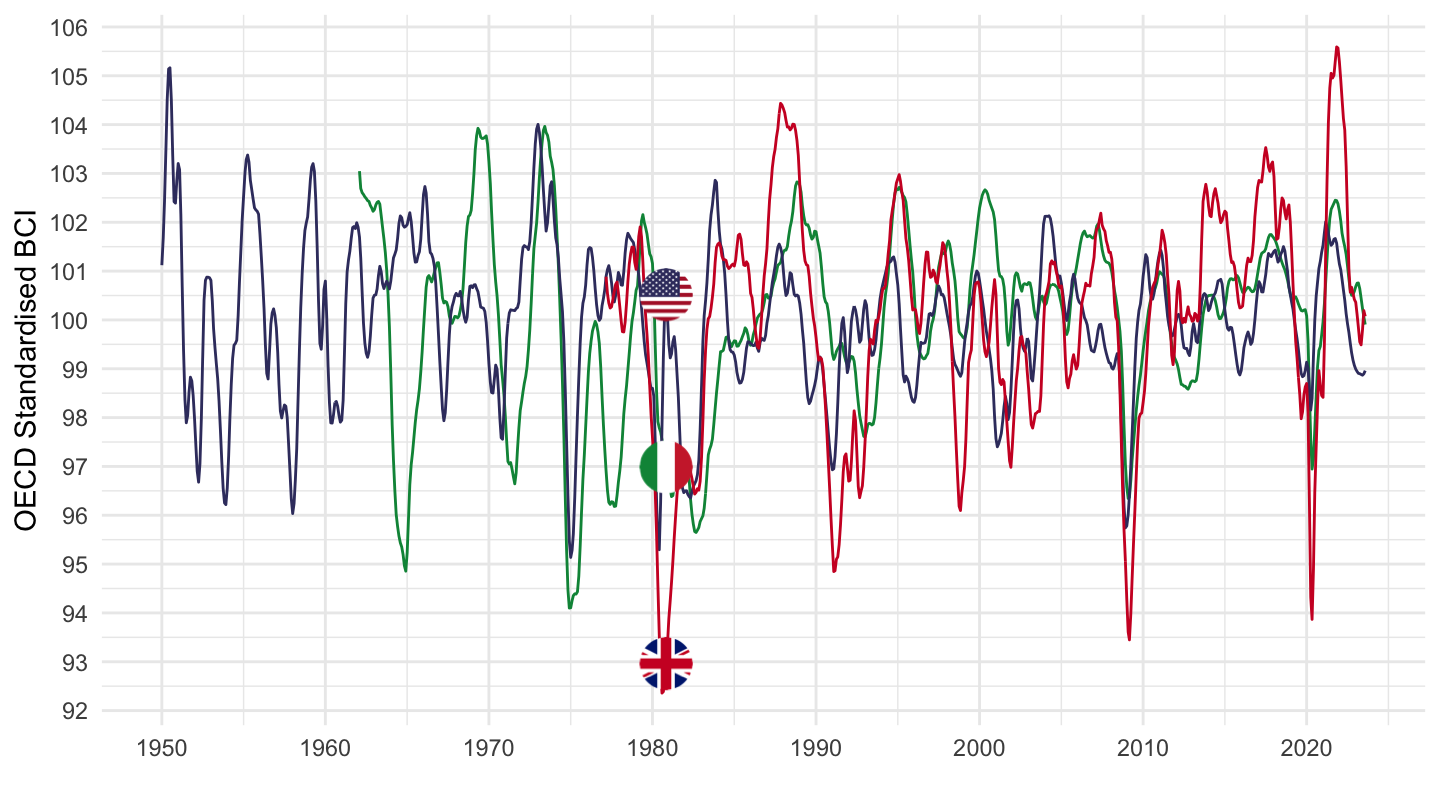
MEI_CLI |>
  # OECD Standardised Business Confidence Indicator
  filter(LOCATION %in% c("ITA", "USA", "GBR"),
         SUBJECT == "BSCICP03") |>
  month_to_date() |>
  filter(date >= as.Date("1995-01-01")) |>
  left_join(MEI_CLI_var$LOCATION, by = "LOCATION") |>
  group_by(LOCATION) |>
  add_flag_color("Location") |>
  ggplot() + geom_line(aes(x = date, y = obsValue, color = color)) +
  scale_color_identity() + add_3flags +
  theme_minimal() + xlab("") + ylab("OECD Standardised BCI") +
  scale_x_date(breaks = seq(1940, 2100, 5) |> paste0("-01-01") |> as.Date(),
               labels = date_format("%Y")) +
  scale_y_continuous(breaks = seq(-10, 200, 1),
                     labels = dollar_format(accuracy = 1, prefix = "")) +
  theme(legend.position = c(0.2, 0.90),
        legend.title = element_blank())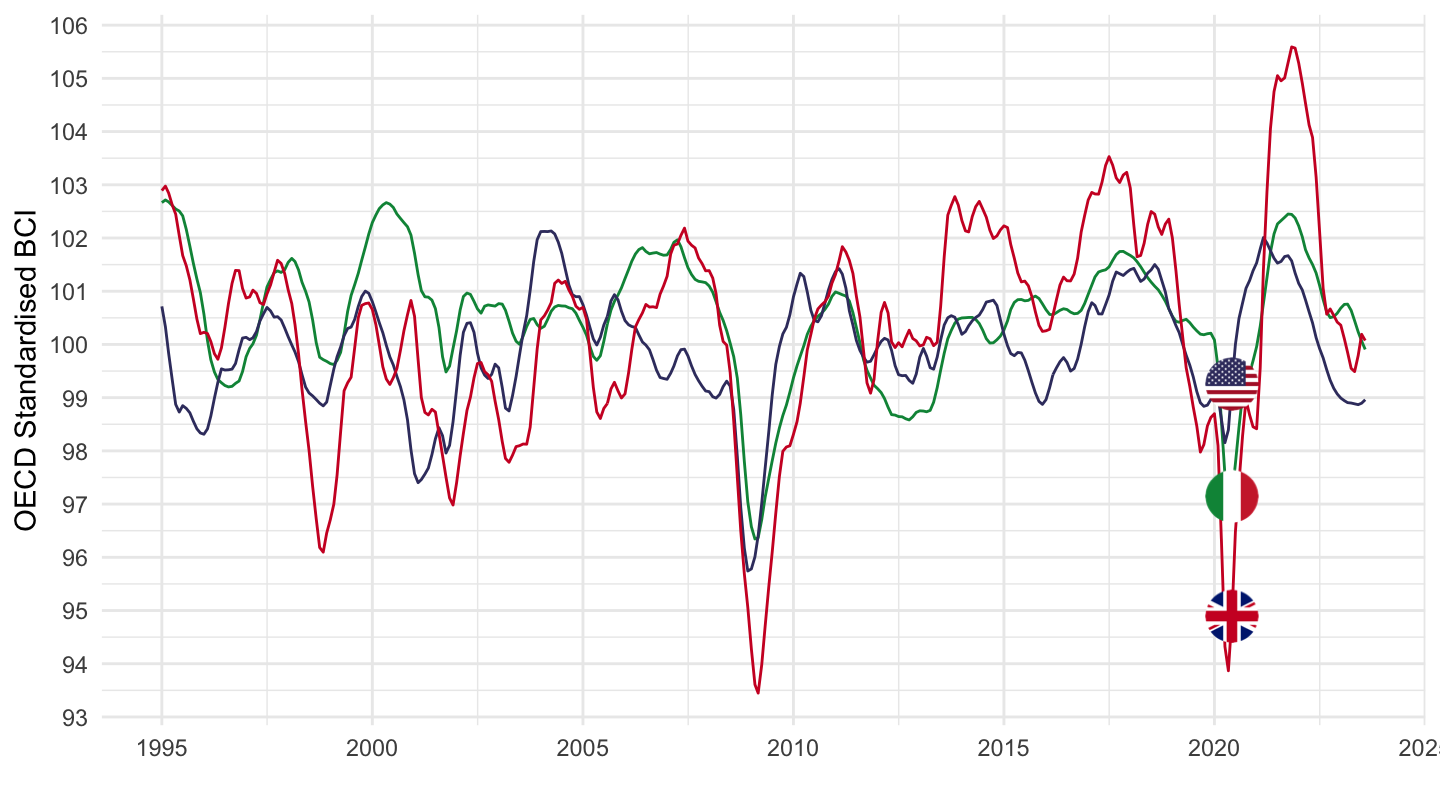
MEI_CLI |>
  left_join(MEI_CLI_var$LOCATION, by = "LOCATION") |>
  filter(SUBJECT == "CSCICP03") |>
  group_by(LOCATION, Location, FREQUENCY) |>
  arrange(obsTime) |>
  summarise(Nobs = n(),
            obsTime1 = first(obsTime),
            obsTime2 = last(obsTime)) |>
  arrange(-Nobs) |>
print_table_conditional()MEI_CLI |>
# CSCICP03: Consumer Confidence Indicator (CCI)
filter(LOCATION %in% c("FRA", "DEU", "JPN"),
SUBJECT == "CSCICP03") |>
month_to_date() |>
left_join(MEI_CLI_var$LOCATION, by = "LOCATION") |>
group_by(LOCATION) |>
add_flag_color("Location") |>
ggplot() + geom_line(aes(x = date, y = obsValue, color = color)) +
scale_color_identity() + add_3flags +
theme_minimal() + xlab("") + ylab("OECD Standardised BCI") +
scale_x_date(breaks = seq(1940, 2100, 5) |> paste0("-01-01") |> as.Date(),
labels = date_format("%Y")) +
scale_y_continuous(breaks = seq(-10, 200, 1),
labels = dollar_format(accuracy = 1, prefix = "")) +
theme(legend.position = c(0.2, 0.90),
legend.title = element_blank())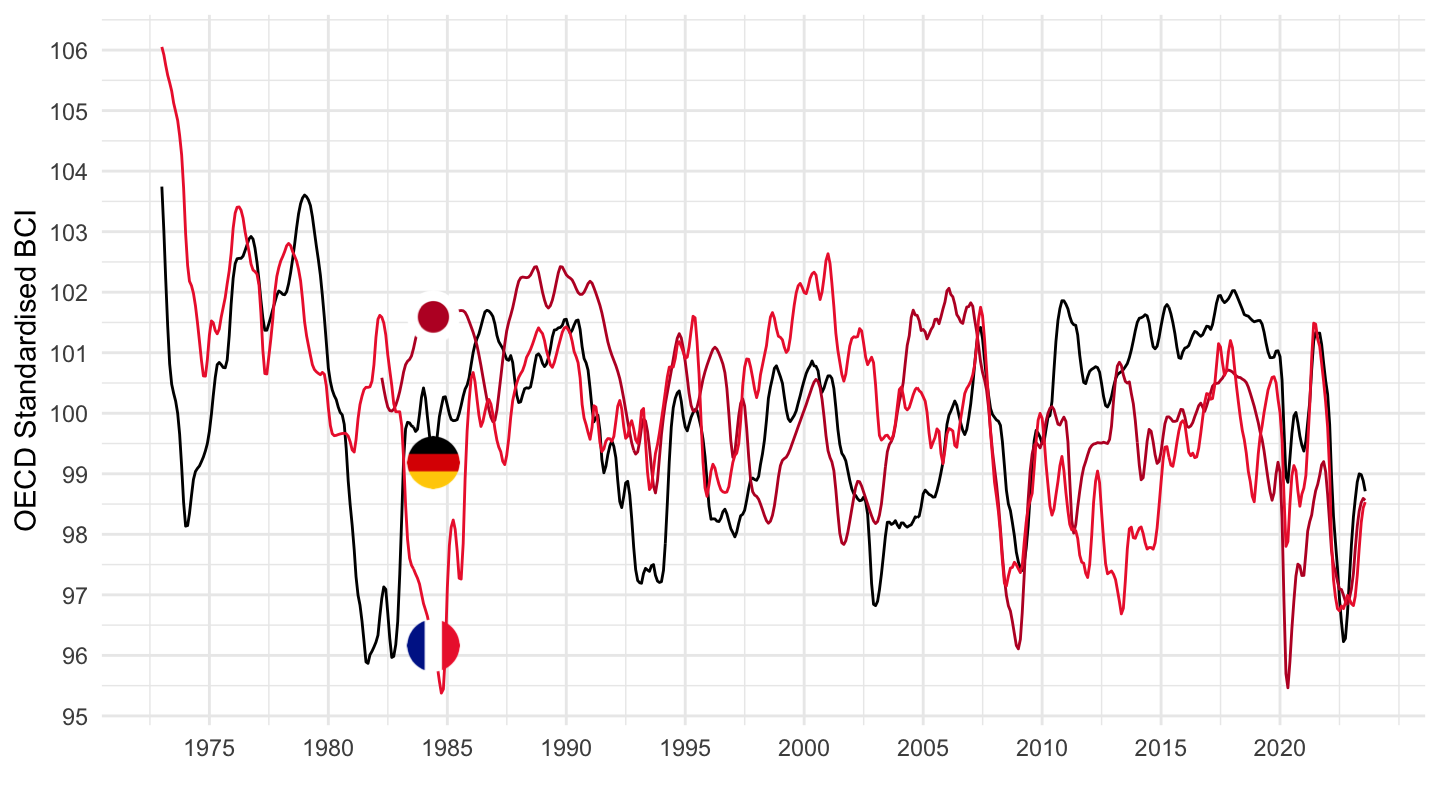
MEI_CLI |>
  # CSCICP03: Consumer Confidence Indicator (CCI)
  filter(LOCATION %in% c("FRA", "DEU", "JPN"),
         SUBJECT == "CSCICP03") |>
  month_to_date() |>
  left_join(MEI_CLI_var$LOCATION, by = "LOCATION") |>
  group_by(LOCATION) |>
  add_flag_color("Location") |>
  filter(date >= as.Date("2010-01-01")) |>
  ggplot() + geom_line(aes(x = date, y = obsValue, color = color)) +
  scale_color_identity() + add_3flags +
  theme_minimal() + xlab("") + ylab("OECD Standardised BCI") +
  scale_x_date(breaks = seq(1940, 2100, 2) |> paste0("-01-01") |> as.Date(),
               labels = date_format("%Y")) +
  scale_y_continuous(breaks = seq(-10, 200, 1),
                     labels = dollar_format(accuracy = 1, prefix = "")) +
  theme(legend.position = c(0.2, 0.90),
        legend.title = element_blank())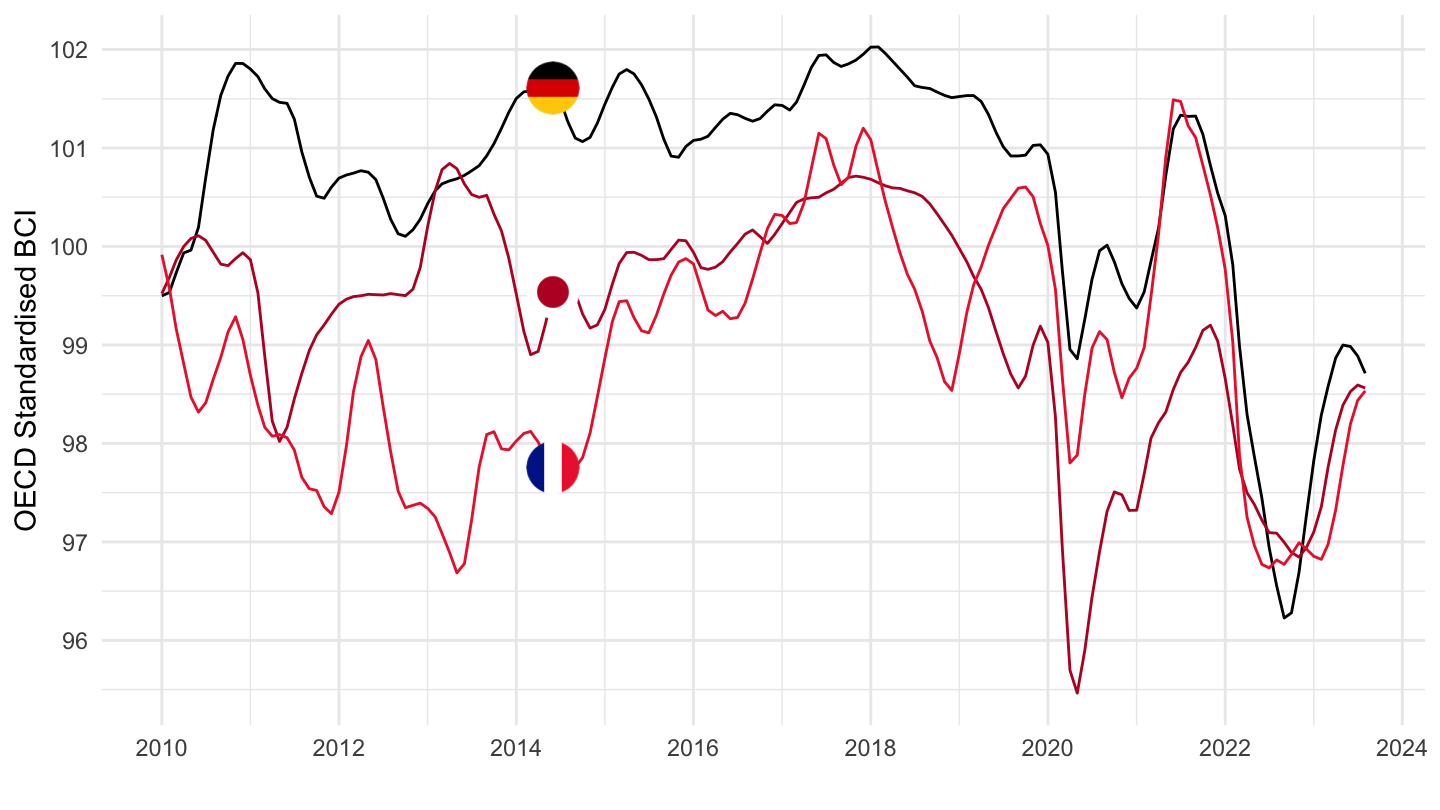
MEI_CLI |>
  # CSCICP03: Consumer Confidence Indicator (CCI)
  filter(LOCATION %in% c("FRA", "DEU", "ITA"),
         SUBJECT == "CSCICP03") |>
  month_to_date() |>
  left_join(MEI_CLI_var$LOCATION, by = "LOCATION") |>
  group_by(LOCATION) |>
  add_flag_color("Location") |>
  ggplot() + geom_line(aes(x = date, y = obsValue, color = color)) +
  scale_color_identity() + add_3flags +
  theme_minimal() + xlab("") + ylab("OECD Standardised BCI") +
  scale_x_date(breaks = seq(1940, 2100, 5) |> paste0("-01-01") |> as.Date(),
               labels = date_format("%Y")) +
  scale_y_continuous(breaks = seq(-10, 200, 1),
                     labels = dollar_format(accuracy = 1, prefix = "")) +
  theme(legend.position = c(0.2, 0.90),
        legend.title = element_blank())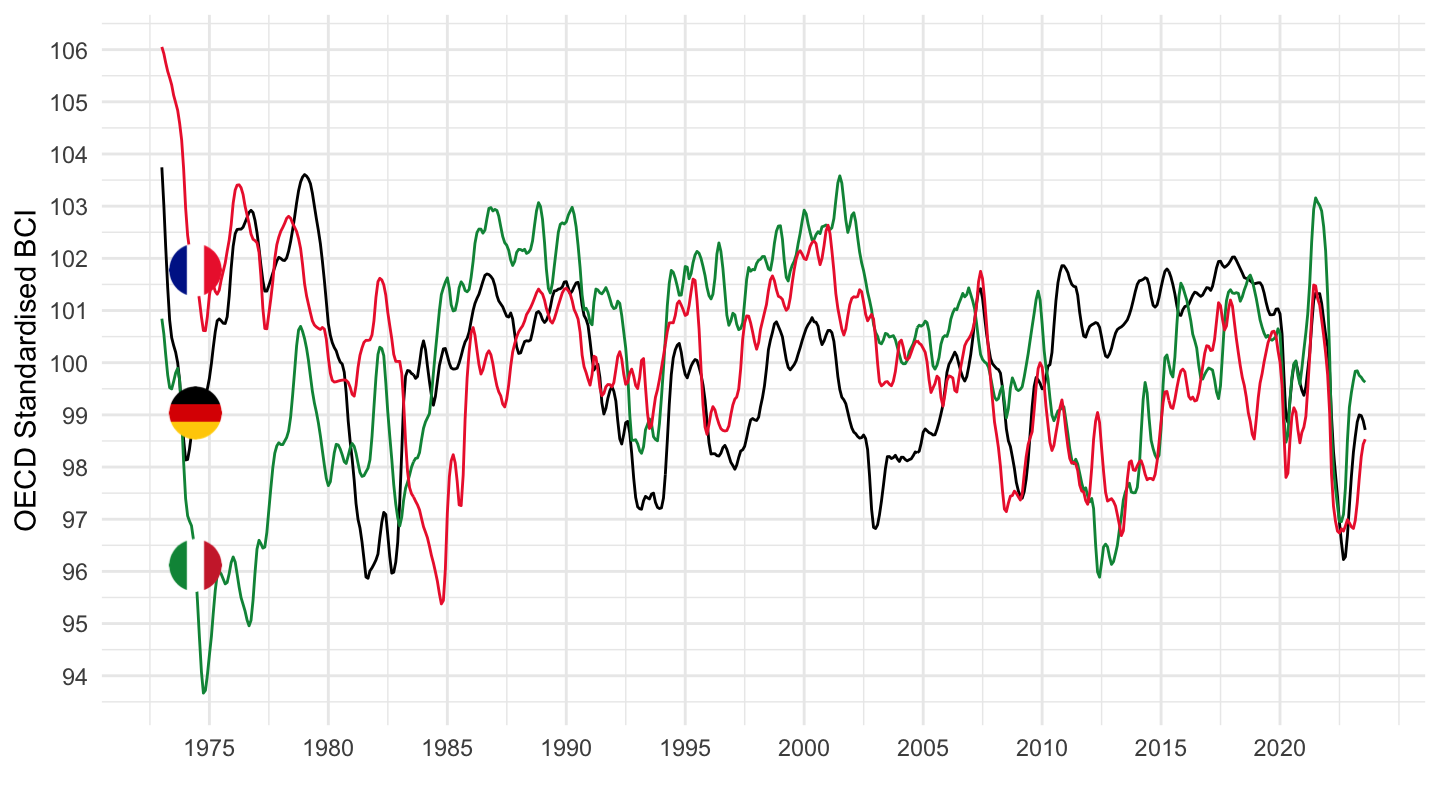
MEI_CLI |>
  # CSCICP03: Consumer Confidence Indicator (CCI)
  filter(LOCATION %in% c("FRA", "DEU", "ITA"),
         SUBJECT == "CSCICP03") |>
  month_to_date() |>
  left_join(MEI_CLI_var$LOCATION, by = "LOCATION") |>
  group_by(LOCATION) |>
  add_flag_color("Location") |>
  filter(date >= as.Date("2010-01-01")) |>
  ggplot() + geom_line(aes(x = date, y = obsValue, color = color)) +
  scale_color_identity() + add_3flags +
  theme_minimal() + xlab("") + ylab("OECD Standardised BCI") +
  scale_x_date(breaks = seq(1940, 2100, 2) |> paste0("-01-01") |> as.Date(),
               labels = date_format("%Y")) +
  scale_y_continuous(breaks = seq(-10, 200, 1),
                     labels = dollar_format(accuracy = 1, prefix = "")) +
  theme(legend.position = c(0.2, 0.90),
        legend.title = element_blank())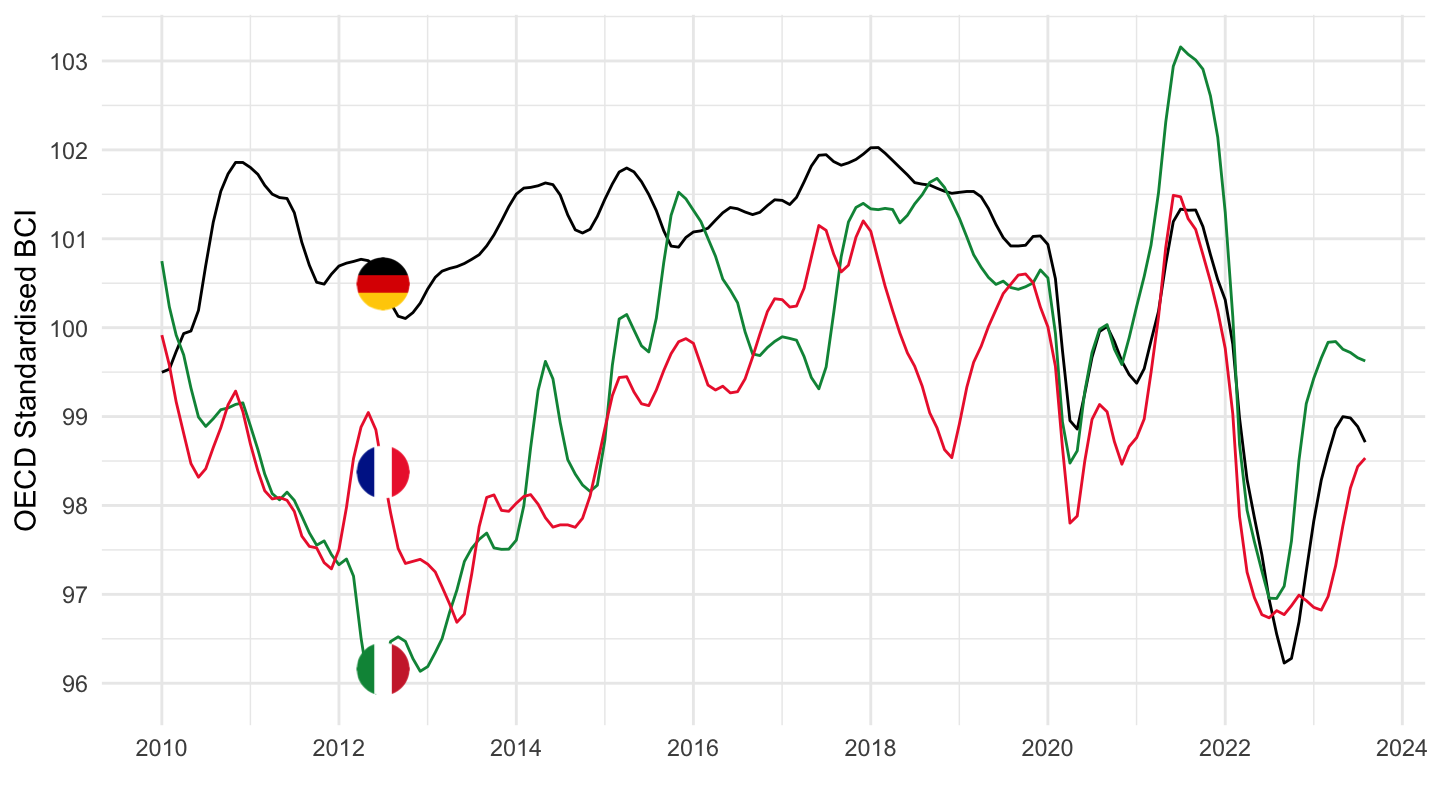
MEI_CLI |>
  # CSCICP03: Consumer Confidence Indicator (CCI)
  filter(LOCATION %in% c("ITA", "USA", "GBR"),
         SUBJECT == "CSCICP03") |>
  month_to_date() |>
  left_join(MEI_CLI_var$LOCATION, by = "LOCATION") |>
  group_by(LOCATION) |>
  add_flag_color("Location") |>
  ggplot() + geom_line(aes(x = date, y = obsValue, color = color)) +
  scale_color_identity() + add_3flags +
  theme_minimal() + xlab("") + ylab("OECD Standardised BCI") +
  scale_x_date(breaks = seq(1940, 2100, 5) |> paste0("-01-01") |> as.Date(),
               labels = date_format("%Y")) +
  scale_y_continuous(breaks = seq(-10, 200, 1),
                     labels = dollar_format(accuracy = 1, prefix = "")) +
  theme(legend.position = c(0.2, 0.90),
        legend.title = element_blank())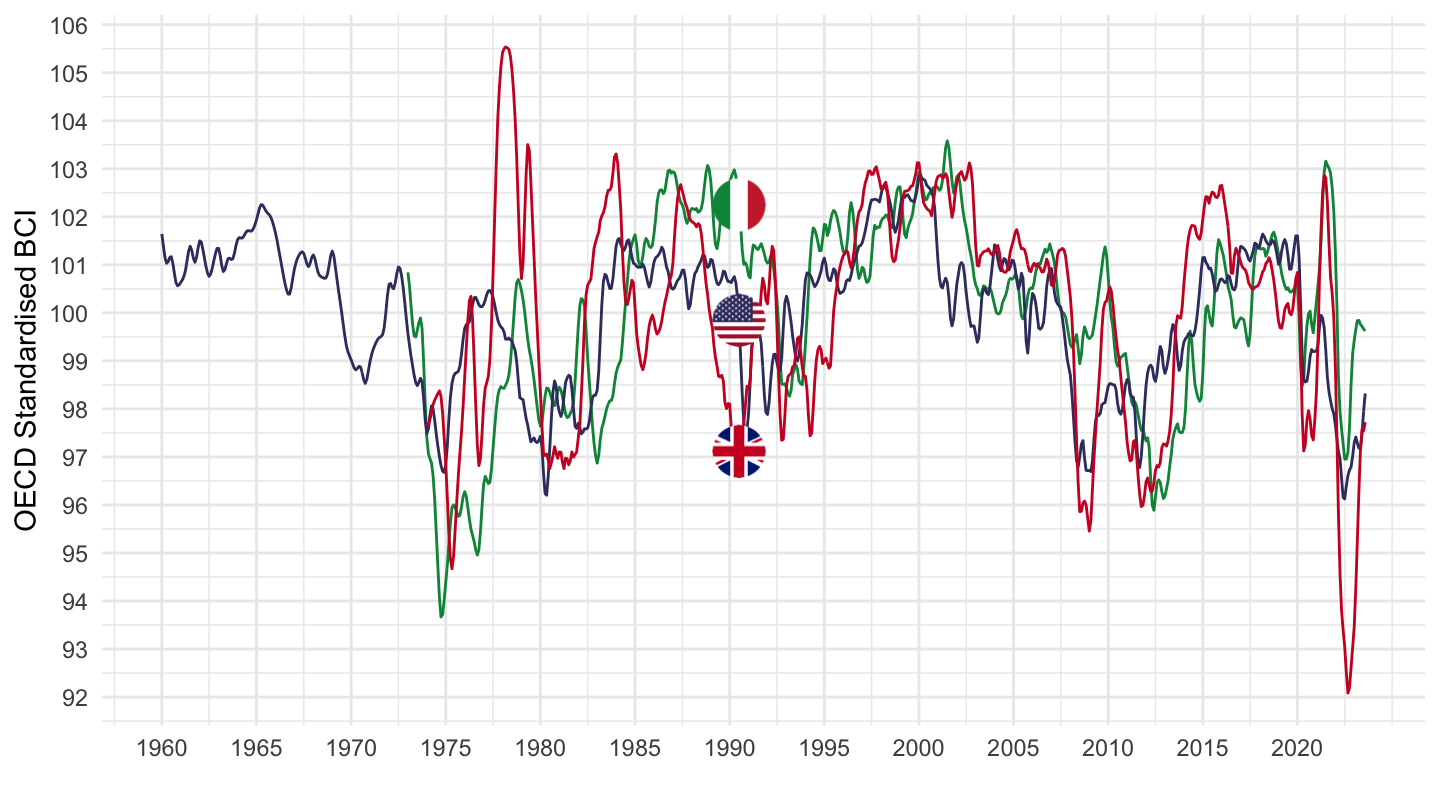
MEI_CLI |>
  # CSCICP03: Consumer Confidence Indicator (CCI)
  filter(LOCATION %in% c("CHE", "BEL", "NLD"),
         SUBJECT == "CSCICP03") |>
  month_to_date() |>
  left_join(MEI_CLI_var$LOCATION, by = "LOCATION") |>
  group_by(LOCATION) |>
  add_flag_color("Location") |>
  ggplot() + geom_line(aes(x = date, y = obsValue, color = color)) +
  scale_color_identity() + add_3flags +
  theme_minimal() + xlab("") + ylab("OECD Standardised BCI") +
  scale_x_date(breaks = seq(1940, 2100, 5) |> paste0("-01-01") |> as.Date(),
               labels = date_format("%Y")) +
  scale_y_continuous(breaks = seq(-10, 200, 1),
                     labels = dollar_format(accuracy = 1, prefix = "")) +
  theme(legend.position = c(0.2, 0.90),
        legend.title = element_blank())