Economic Outlook No 114 - November 2023

Data - OECD

Code
source("../../code/R-markdown/init_oecd.R")
The following packages are a base install and will not be unloaded:

The following packages were not previously loaded:

Le chargement a nécessité le package : tidyverse
── Attaching core tidyverse packages ──────────────────────── tidyverse 2.0.0 ──
✔ dplyr     1.1.4     ✔ readr     2.1.5
✔ forcats   1.0.0     ✔ stringr   1.5.1
✔ ggplot2   3.5.2     ✔ tibble    3.3.0
✔ lubridate 1.9.4     ✔ tidyr     1.3.1
✔ purrr     1.1.0     
── Conflicts ────────────────────────────────────────── tidyverse_conflicts() ──
✖ dplyr::filter() masks stats::filter()
✖ dplyr::lag()    masks stats::lag()
ℹ Use the conflicted package (<http://conflicted.r-lib.org/>) to force all conflicts to become errors
Le chargement a nécessité le package : RPostgres

Le chargement a nécessité le package : scales


Attachement du package : 'scales'


L'objet suivant est masqué depuis 'package:purrr':

    discard


L'objet suivant est masqué depuis 'package:readr':

    col_factor


Le chargement a nécessité le package : knitr

Le chargement a nécessité le package : kableExtra


Attachement du package : 'kableExtra'


L'objet suivant est masqué depuis 'package:dplyr':

    group_rows


Le chargement a nécessité le package : DT

Le chargement a nécessité le package : viridis

Le chargement a nécessité le package : viridisLite


Attachement du package : 'viridis'


L'objet suivant est masqué depuis 'package:scales':

    viridis_pal


Le chargement a nécessité le package : ggrepel

Le chargement a nécessité le package : rsdmx

Le chargement a nécessité le package : mFilter

Le chargement a nécessité le package : OECD

Le chargement a nécessité le package : stargazer


Please cite as: 


 Hlavac, Marek (2022). stargazer: Well-Formatted Regression and Summary Statistics Tables.

 R package version 5.2.3. https://CRAN.R-project.org/package=stargazer 


Le chargement a nécessité le package : choroplethr

Le chargement a nécessité le package : choroplethrMaps

Le chargement a nécessité le package : pander

Le chargement a nécessité le package : AER

Le chargement a nécessité le package : car

Le chargement a nécessité le package : carData


Attachement du package : 'car'


L'objet suivant est masqué depuis 'package:dplyr':

    recode


L'objet suivant est masqué depuis 'package:purrr':

    some


Le chargement a nécessité le package : lmtest

Le chargement a nécessité le package : zoo


Attachement du package : 'zoo'


Les objets suivants sont masqués depuis 'package:base':

    as.Date, as.Date.numeric


Le chargement a nécessité le package : sandwich

Le chargement a nécessité le package : survival

Le chargement a nécessité le package : latex2exp

Le chargement a nécessité le package : pracma


Attachement du package : 'pracma'


L'objet suivant est masqué depuis 'package:car':

    logit


L'objet suivant est masqué depuis 'package:purrr':

    cross


Le chargement a nécessité le package : ggimage
Code
load_data("oecd/EO110_INTERNET.RData")
load_data("oecd/EO111_INTERNET.RData")
load_data("oecd/EO112_INTERNET.RData")
load_data("oecd/EO113_INTERNET.RData")
load_data("oecd/EO114_INTERNET.RData")
load_data("oecd/EO_115.RData")
load_data("oecd/EO_116.RData")
load_data("oecd/EO_117.RData")
load_data("oecd/EO114_INTERNET_var2.RData")
load_data("us/nber_recessions.RData")
Info

source dataset .html .RData
oecd EO 2024-06-01 2025-09-29
oecd EO114_INTERNET 2025-08-25 2023-12-08

EO_115

Code
EO_115_extract <- EO_115 %>%
  filter(FREQ == "Q",
         REF_AREA == "DEU",
         MEASURE == "GDPV") %>%
  select(obsTime, obsValue)

EO_116

Code
EO_116_extract <- EO_116 %>%
  filter(FREQ == "Q",
         REF_AREA == "DEU",
         MEASURE == "GDPV") %>%
  select(obsTime, obsValue)

EO_117

Code
EO_117_extract <- EO_117 %>%
  filter(FREQ == "Q",
         REF_AREA == "DEU",
         MEASURE == "GDPV") %>%
  select(obsTime, obsValue)

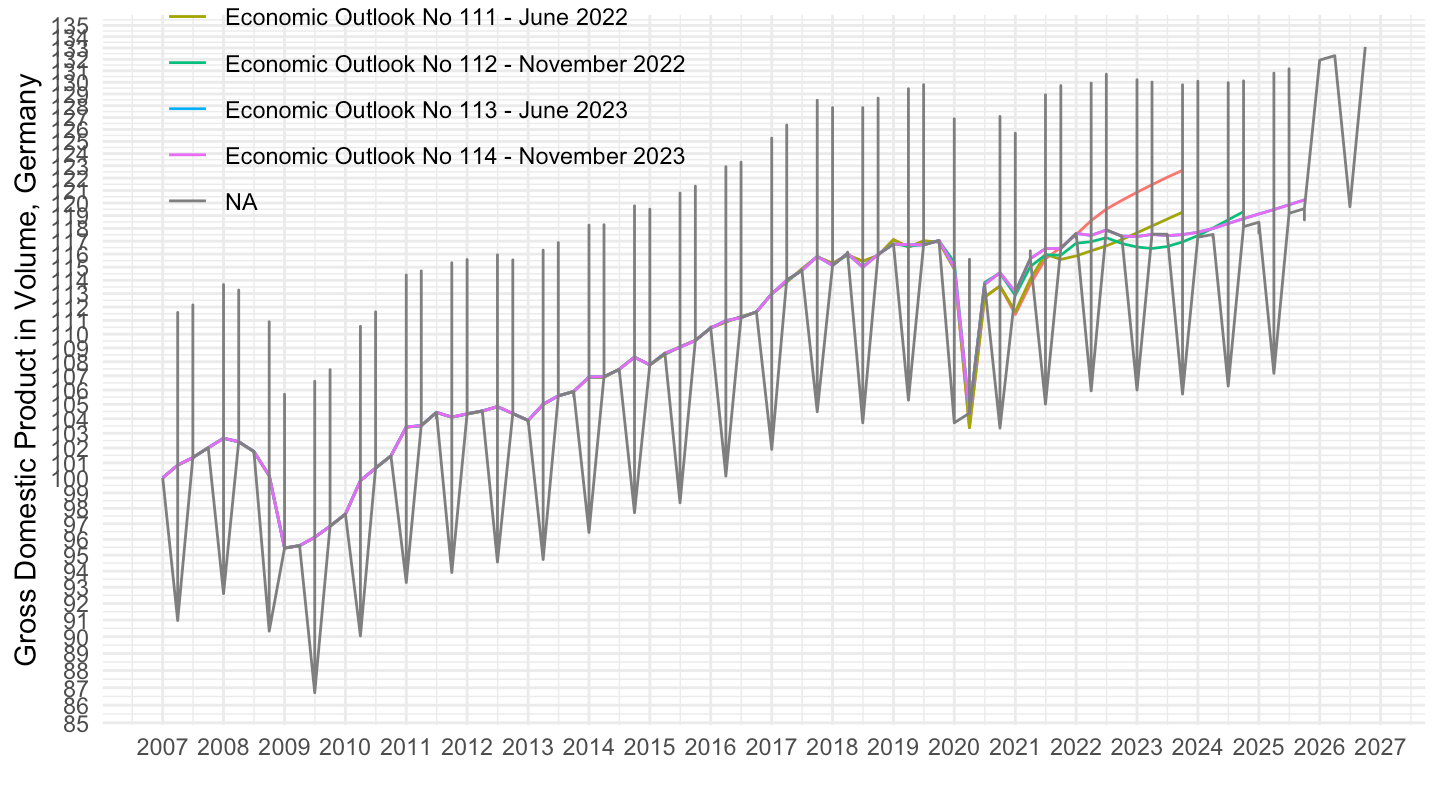
Germany - Vintages

GDP in Volume

Since 2014Q1

Code
EO110_INTERNET %>%
  mutate(vintage = "Economic Outlook No 110 - December 2021") %>%
  bind_rows(EO111_INTERNET %>%
              mutate(vintage = "Economic Outlook No 111 - June 2022")) %>%
  bind_rows(EO112_INTERNET %>%
              mutate(vintage = "Economic Outlook No 112 - November 2022")) %>%
  bind_rows(EO114_INTERNET %>%
              mutate(vintage = "Economic Outlook No 113 - June 2023")) %>%
  bind_rows(EO114_INTERNET %>%
              mutate(vintage = "Economic Outlook No 114 - November 2023")) %>%
  filter(VARIABLE == "GDPV", 
         LOCATION == "DEU",
         FREQUENCY == "Q") %>%
  bind_rows(EO_115_extract) %>%
  bind_rows(EO_116_extract) %>%
  bind_rows(EO_117_extract) %>%
  quarter_to_date() %>%
  filter(date >= as.Date("2007-01-01")) %>%
  group_by(vintage) %>%
  mutate(obsValue = 100*obsValue/obsValue[date == as.Date("2007-01-01")]) %>%
  ggplot + geom_line(aes(x = date, y = obsValue, color = vintage)) +
  xlab("") + ylab("Gross Domestic Product in Volume, Germany") + theme_minimal() +
  scale_x_date(breaks = seq(1920, 2100, 1) %>% paste0("-01-01") %>% as.Date,
               labels = date_format("%Y")) +
  theme(legend.position = c(0.25, 0.9),
        legend.title = element_blank()) +
  scale_y_log10(breaks = seq(20, 200, 1))

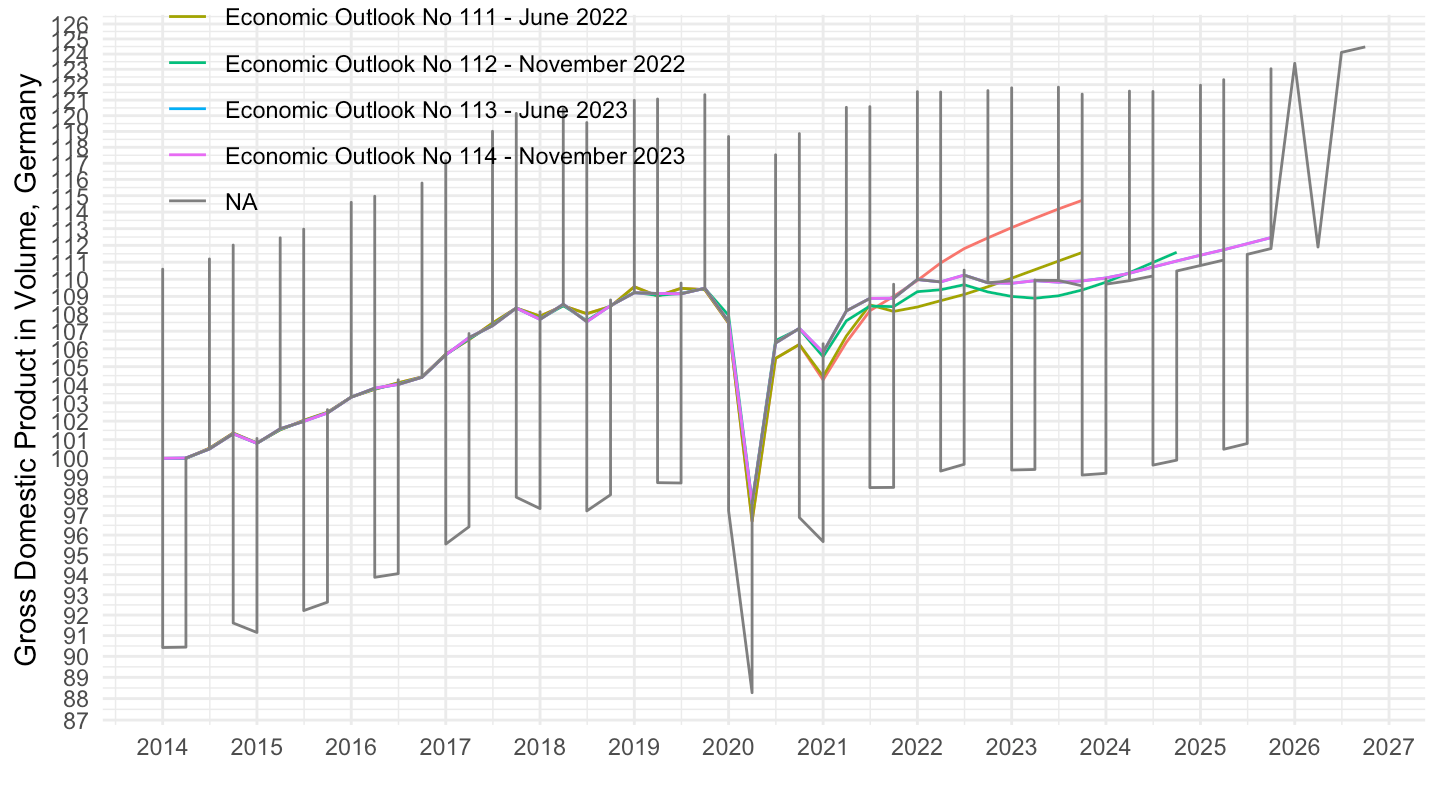
Since 2014Q1

Code
EO110_INTERNET %>%
  mutate(vintage = "Economic Outlook No 110 - December 2021") %>%
  bind_rows(EO111_INTERNET %>%
              mutate(vintage = "Economic Outlook No 111 - June 2022")) %>%
  bind_rows(EO112_INTERNET %>%
              mutate(vintage = "Economic Outlook No 112 - November 2022")) %>%
  bind_rows(EO114_INTERNET %>%
              mutate(vintage = "Economic Outlook No 113 - June 2023")) %>%
  bind_rows(EO114_INTERNET %>%
              mutate(vintage = "Economic Outlook No 114 - November 2023")) %>%
  filter(VARIABLE == "GDPV", 
         LOCATION == "DEU",
         FREQUENCY == "Q") %>%
  bind_rows(EO_115_extract) %>%
  bind_rows(EO_116_extract) %>%
  bind_rows(EO_117_extract) %>%
  quarter_to_date() %>%
  filter(date >= as.Date("2014-01-01")) %>%
  group_by(vintage) %>%
  mutate(obsValue = 100*obsValue/obsValue[date == as.Date("2014-01-01")]) %>%
  ggplot + geom_line(aes(x = date, y = obsValue, color = vintage)) +
  xlab("") + ylab("Gross Domestic Product in Volume, Germany") + theme_minimal() +
  scale_x_date(breaks = seq(1920, 2100, 1) %>% paste0("-01-01") %>% as.Date,
               labels = date_format("%Y")) +
  theme(legend.position = c(0.25, 0.9),
        legend.title = element_blank()) +
  scale_y_log10(breaks = seq(20, 200, 1))

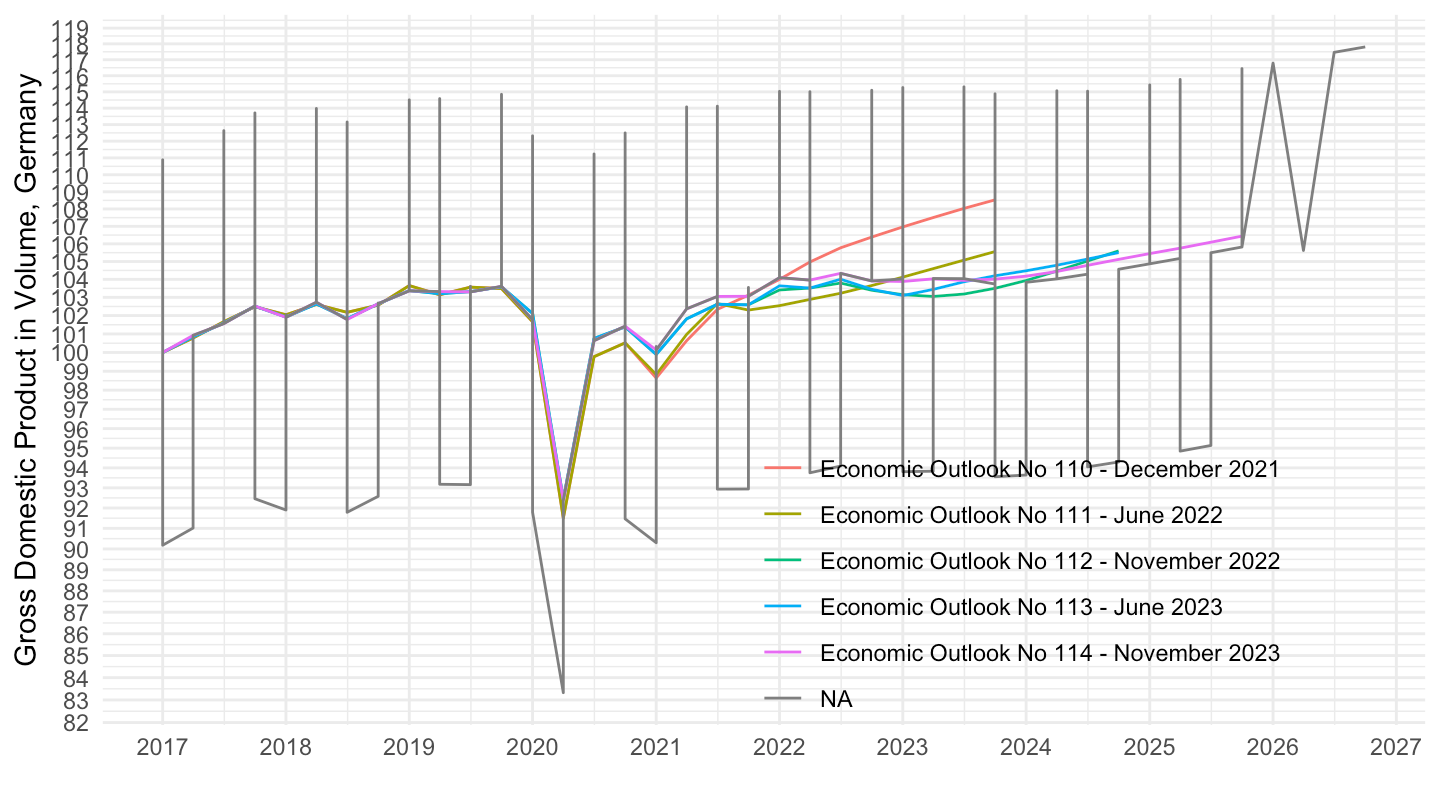
Since 2017Q1

Code
EO110_INTERNET %>%
  mutate(vintage = "Economic Outlook No 110 - December 2021") %>%
  bind_rows(EO111_INTERNET %>%
              mutate(vintage = "Economic Outlook No 111 - June 2022")) %>%
  bind_rows(EO112_INTERNET %>%
              mutate(vintage = "Economic Outlook No 112 - November 2022")) %>%
  bind_rows(EO113_INTERNET %>%
              mutate(vintage = "Economic Outlook No 113 - June 2023")) %>%
  bind_rows(EO114_INTERNET %>%
              mutate(vintage = "Economic Outlook No 114 - November 2023")) %>%
  filter(VARIABLE == "GDPV", 
         LOCATION == "DEU",
         FREQUENCY == "Q") %>%
  bind_rows(EO_115_extract) %>%
  bind_rows(EO_116_extract) %>%
  bind_rows(EO_117_extract) %>%
  quarter_to_date() %>%
  filter(date >= as.Date("2017-01-01")) %>%
  group_by(vintage) %>%
  mutate(obsValue = 100*obsValue/obsValue[date == as.Date("2017-01-01")]) %>%
  ggplot + geom_line(aes(x = date, y = obsValue, color = vintage)) +
  xlab("") + ylab("Gross Domestic Product in Volume, Germany") + theme_minimal() +
  scale_x_date(breaks = seq(1920, 2100, 1) %>% paste0("-01-01") %>% as.Date,
               labels = date_format("%Y")) +
  theme(legend.position = c(0.7, 0.2),
        legend.title = element_blank()) +
  scale_y_log10(breaks = seq(20, 200, 1))

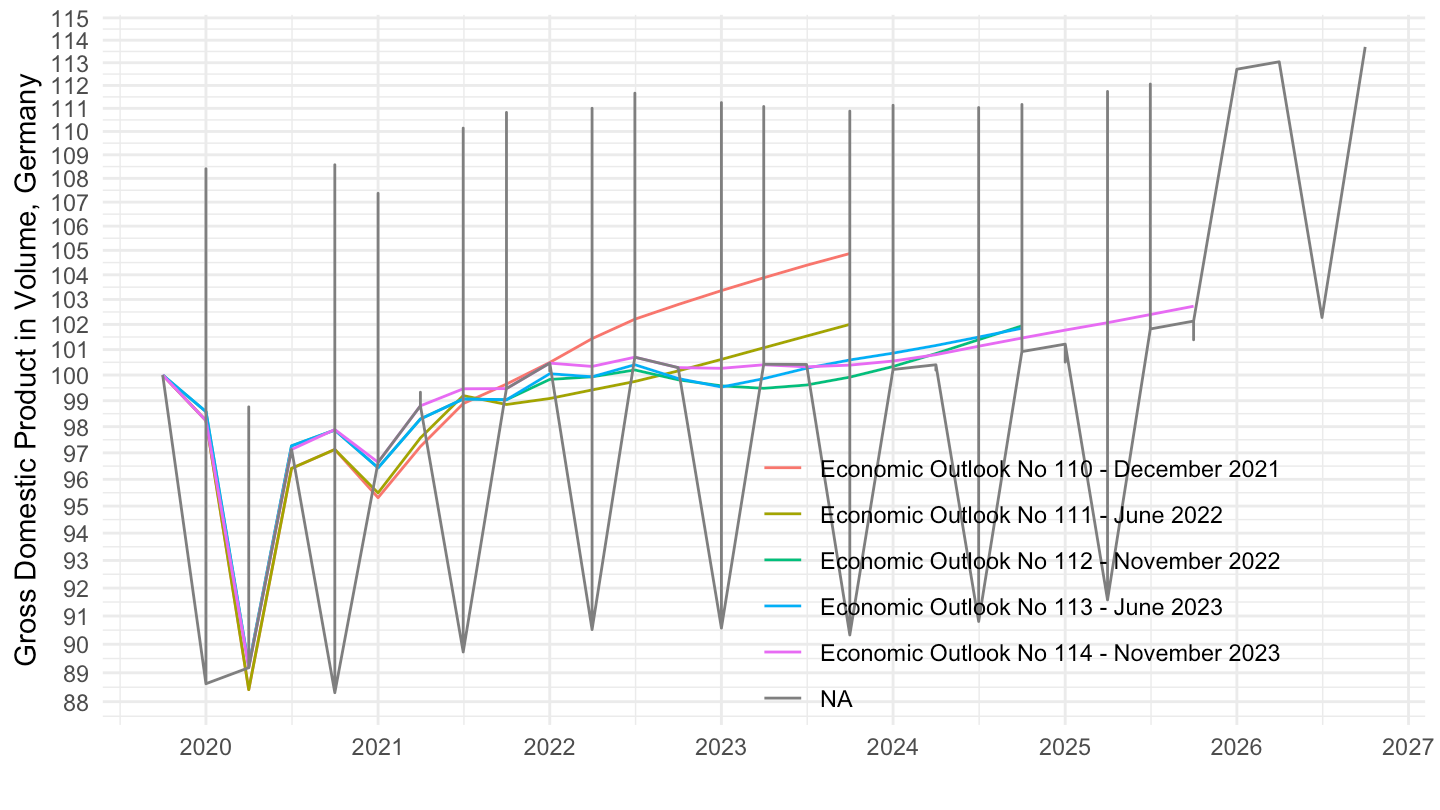
Since 2019Q4

Code
EO110_INTERNET %>%
  mutate(vintage = "Economic Outlook No 110 - December 2021") %>%
  bind_rows(EO111_INTERNET %>%
              mutate(vintage = "Economic Outlook No 111 - June 2022")) %>%
  bind_rows(EO112_INTERNET %>%
              mutate(vintage = "Economic Outlook No 112 - November 2022")) %>%
  bind_rows(EO113_INTERNET %>%
              mutate(vintage = "Economic Outlook No 113 - June 2023")) %>%
  bind_rows(EO114_INTERNET %>%
              mutate(vintage = "Economic Outlook No 114 - November 2023")) %>%
  filter(VARIABLE == "GDPV", 
         LOCATION == "DEU",
         FREQUENCY == "Q") %>%
  bind_rows(EO_115_extract) %>%
  bind_rows(EO_116_extract) %>%
  bind_rows(EO_117_extract) %>%
  quarter_to_date() %>%
  filter(date >= as.Date("2019-10-01")) %>%
  group_by(vintage) %>%
  mutate(obsValue = 100*obsValue/obsValue[date == as.Date("2019-10-01")]) %>%
  ggplot + geom_line(aes(x = date, y = obsValue, color = vintage)) +
  xlab("") + ylab("Gross Domestic Product in Volume, Germany") + theme_minimal() +
  scale_x_date(breaks = seq(1920, 2100, 1) %>% paste0("-01-01") %>% as.Date,
               labels = date_format("%Y")) +
  theme(legend.position = c(0.7, 0.2),
        legend.title = element_blank()) +
  scale_y_log10(breaks = seq(20, 200, 1))

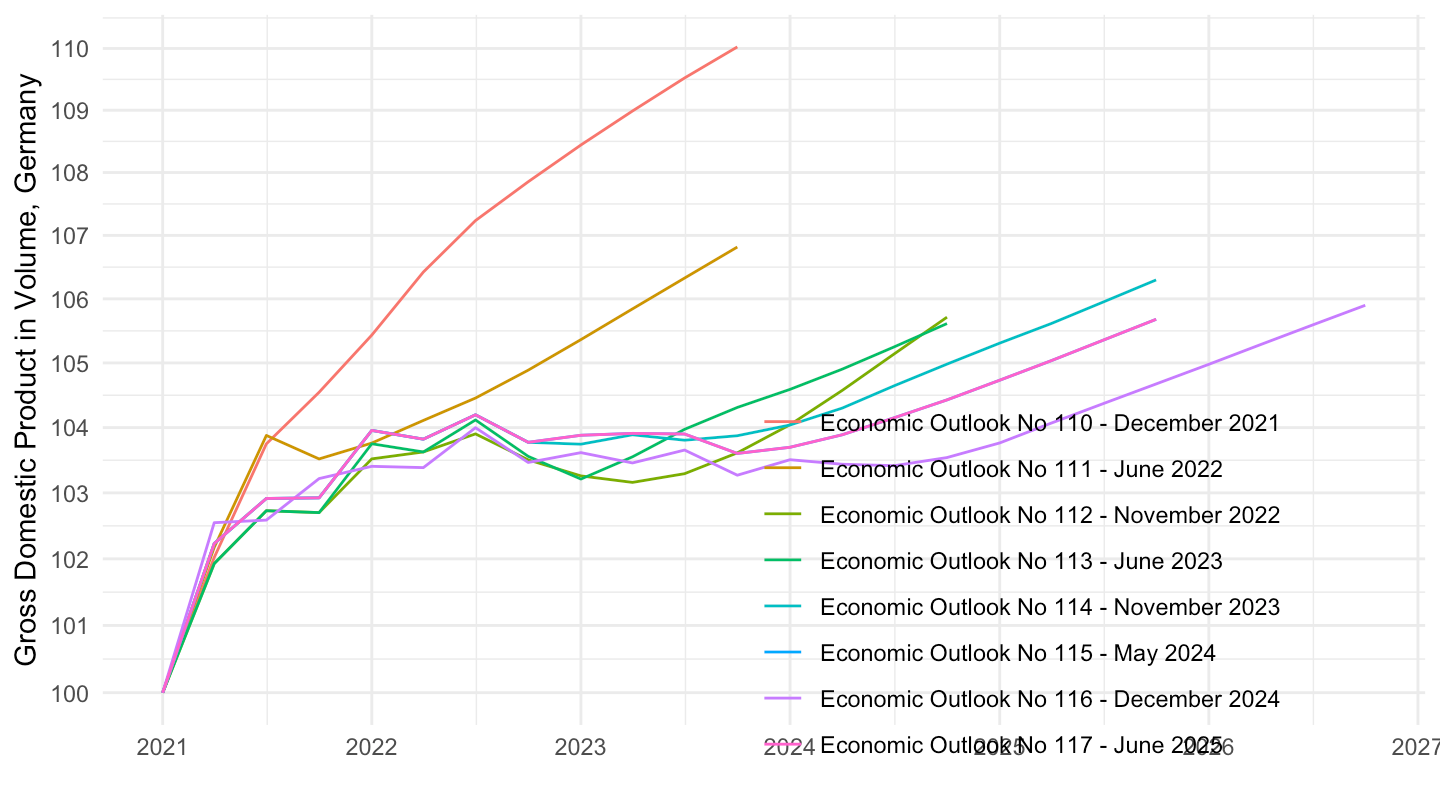
Since 2021

Code
EO110_INTERNET %>%
  mutate(vintage = "Economic Outlook No 110 - December 2021") %>%
  bind_rows(EO111_INTERNET %>%
              mutate(vintage = "Economic Outlook No 111 - June 2022")) %>%
  bind_rows(EO112_INTERNET %>%
              mutate(vintage = "Economic Outlook No 112 - November 2022")) %>%
  bind_rows(EO113_INTERNET %>%
              mutate(vintage = "Economic Outlook No 113 - June 2023")) %>%
  bind_rows(EO114_INTERNET %>%
              mutate(vintage = "Economic Outlook No 114 - November 2023")) %>%
  filter(VARIABLE == "GDPV", 
         LOCATION == "DEU",
         FREQUENCY == "Q") %>%
  bind_rows(EO_115_extract %>%
              mutate(vintage = "Economic Outlook No 115 - May 2024")) %>%
  bind_rows(EO_116_extract %>%
              mutate(vintage = "Economic Outlook No 116 - December 2024")) %>%
  bind_rows(EO_117_extract %>%
              mutate(vintage = "Economic Outlook No 117 - June 2025")) %>%
  quarter_to_date() %>%
  filter(date >= as.Date("2021-01-01")) %>%
  group_by(vintage) %>%
  mutate(obsValue = 100*obsValue/obsValue[date == as.Date("2021-01-01")]) %>%
  ggplot + geom_line(aes(x = date, y = obsValue, color = vintage)) +
  xlab("") + ylab("Gross Domestic Product in Volume, Germany") + theme_minimal() +
  scale_x_date(breaks = seq(1920, 2100, 1) %>% paste0("-01-01") %>% as.Date,
               labels = date_format("%Y")) +
  theme(legend.position = c(0.7, 0.2),
        legend.title = element_blank()) +
  scale_y_log10(breaks = seq(20, 200, 1))

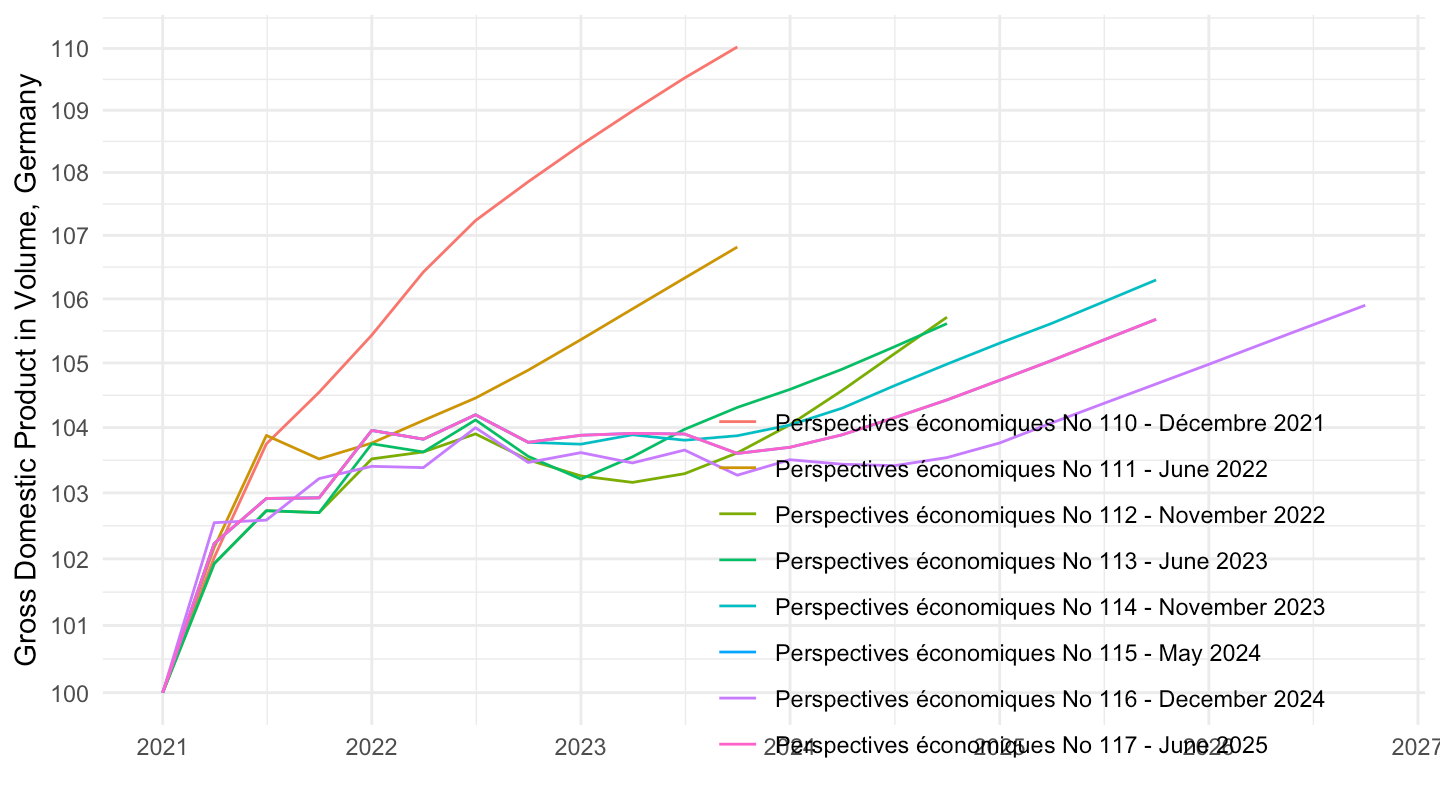
French

Code
EO110_INTERNET %>%
  mutate(vintage = "Perspectives économiques No 110 - Décembre 2021") %>%
  bind_rows(EO111_INTERNET %>%
              mutate(vintage = "Perspectives économiques No 111 - June 2022")) %>%
  bind_rows(EO112_INTERNET %>%
              mutate(vintage = "Perspectives économiques No 112 - November 2022")) %>%
  bind_rows(EO113_INTERNET %>%
              mutate(vintage = "Perspectives économiques No 113 - June 2023")) %>%
  bind_rows(EO114_INTERNET %>%
              mutate(vintage = "Perspectives économiques No 114 - November 2023")) %>%
  filter(VARIABLE == "GDPV", 
         LOCATION == "DEU",
         FREQUENCY == "Q") %>%
  bind_rows(EO_115_extract %>%
              mutate(vintage = "Perspectives économiques No 115 - May 2024")) %>%
  bind_rows(EO_116_extract %>%
              mutate(vintage = "Perspectives économiques No 116 - December 2024")) %>%
  bind_rows(EO_117_extract %>%
              mutate(vintage = "Perspectives économiques No 117 - June 2025")) %>%
  quarter_to_date() %>%
  filter(date >= as.Date("2021-01-01")) %>%
  group_by(vintage) %>%
  mutate(obsValue = 100*obsValue/obsValue[date == as.Date("2021-01-01")]) %>%
  ggplot + geom_line(aes(x = date, y = obsValue, color = vintage)) +
  xlab("") + ylab("Gross Domestic Product in Volume, Germany") + theme_minimal() +
  scale_x_date(breaks = seq(1920, 2100, 1) %>% paste0("-01-01") %>% as.Date,
               labels = date_format("%Y")) +
  theme(legend.position = c(0.7, 0.2),
        legend.title = element_blank()) +
  scale_y_log10(breaks = seq(20, 200, 1))

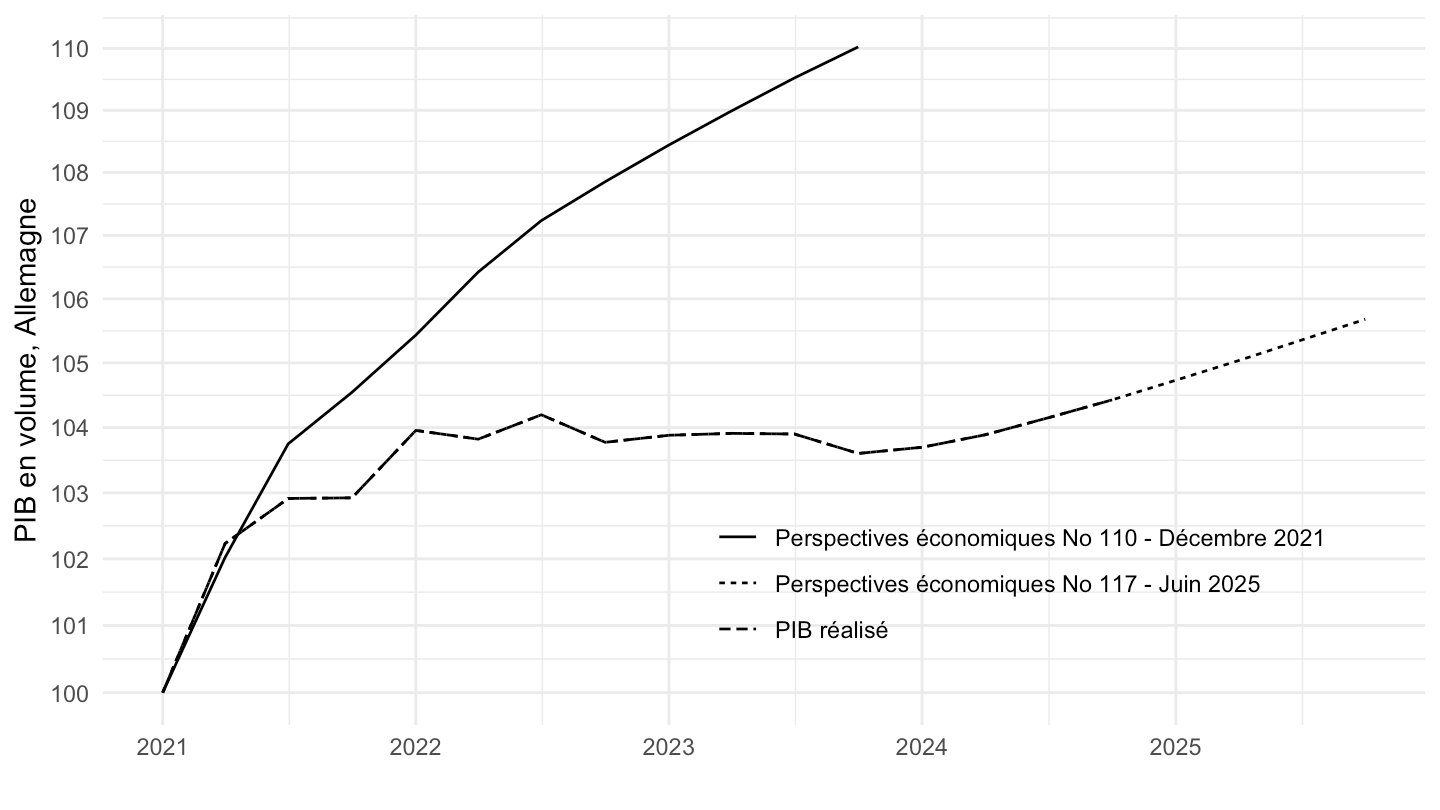
French

Code
EO110_INTERNET %>%
  mutate(vintage = "Perspectives économiques No 110 - Décembre 2021") %>%
  filter(VARIABLE == "GDPV", 
         LOCATION == "DEU",
         FREQUENCY == "Q") %>%
  bind_rows(EO_117_extract %>%
              mutate(vintage = "Perspectives économiques No 117 - Juin 2025")) %>%
  quarter_to_date() %>%
  filter(date >= as.Date("2021-01-01")) %>%
  bind_rows(EO_117_extract %>%
              mutate(vintage = "PIB réalisé") %>%
              quarter_to_date() %>%
              filter(date <= as.Date("2024-10-01"),
                     date >= as.Date("2021-01-01"))) %>%
  group_by(vintage) %>%
  mutate(obsValue = 100*obsValue/obsValue[date == as.Date("2021-01-01")]) %>%
  ggplot + geom_line(aes(x = date, y = obsValue, linetype = vintage)) +
  xlab("") + ylab("PIB en volume, Allemagne") + theme_minimal() +
  scale_x_date(breaks = seq(1920, 2100, 1) %>% paste0("-01-01") %>% as.Date,
               labels = date_format("%Y")) +
  theme(legend.position = c(0.7, 0.2),
        legend.title = element_blank()) +
  scale_y_log10(breaks = seq(20, 200, 1))

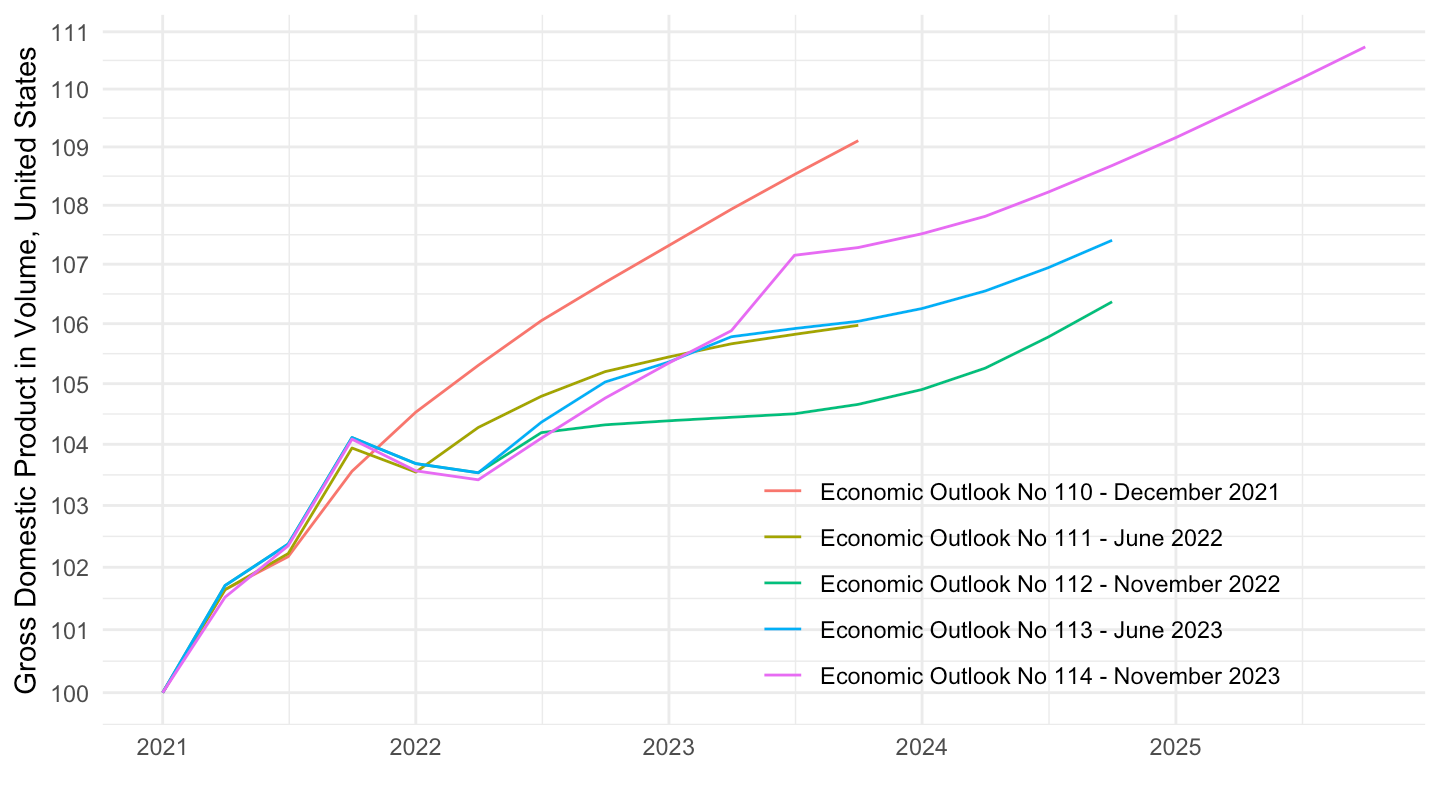
U.S. Since 2021

Code
EO110_INTERNET %>%
  mutate(vintage = "Economic Outlook No 110 - December 2021") %>%
  bind_rows(EO111_INTERNET %>%
              mutate(vintage = "Economic Outlook No 111 - June 2022")) %>%
  bind_rows(EO112_INTERNET %>%
              mutate(vintage = "Economic Outlook No 112 - November 2022")) %>%
  bind_rows(EO113_INTERNET %>%
              mutate(vintage = "Economic Outlook No 113 - June 2023")) %>%
  bind_rows(EO114_INTERNET %>%
              mutate(vintage = "Economic Outlook No 114 - November 2023")) %>%
  filter(VARIABLE == "GDPV", 
         LOCATION == "USA",
         FREQUENCY == "Q") %>%
  quarter_to_date() %>%
  filter(date >= as.Date("2021-01-01")) %>%
  group_by(vintage) %>%
  mutate(obsValue = 100*obsValue/obsValue[date == as.Date("2021-01-01")]) %>%
  ggplot + geom_line(aes(x = date, y = obsValue, color = vintage)) +
  xlab("") + ylab("Gross Domestic Product in Volume, United States") + theme_minimal() +
  scale_x_date(breaks = seq(1920, 2100, 1) %>% paste0("-01-01") %>% as.Date,
               labels = date_format("%Y")) +
  theme(legend.position = c(0.7, 0.2),
        legend.title = element_blank()) +
  scale_y_log10(breaks = seq(20, 200, 1))

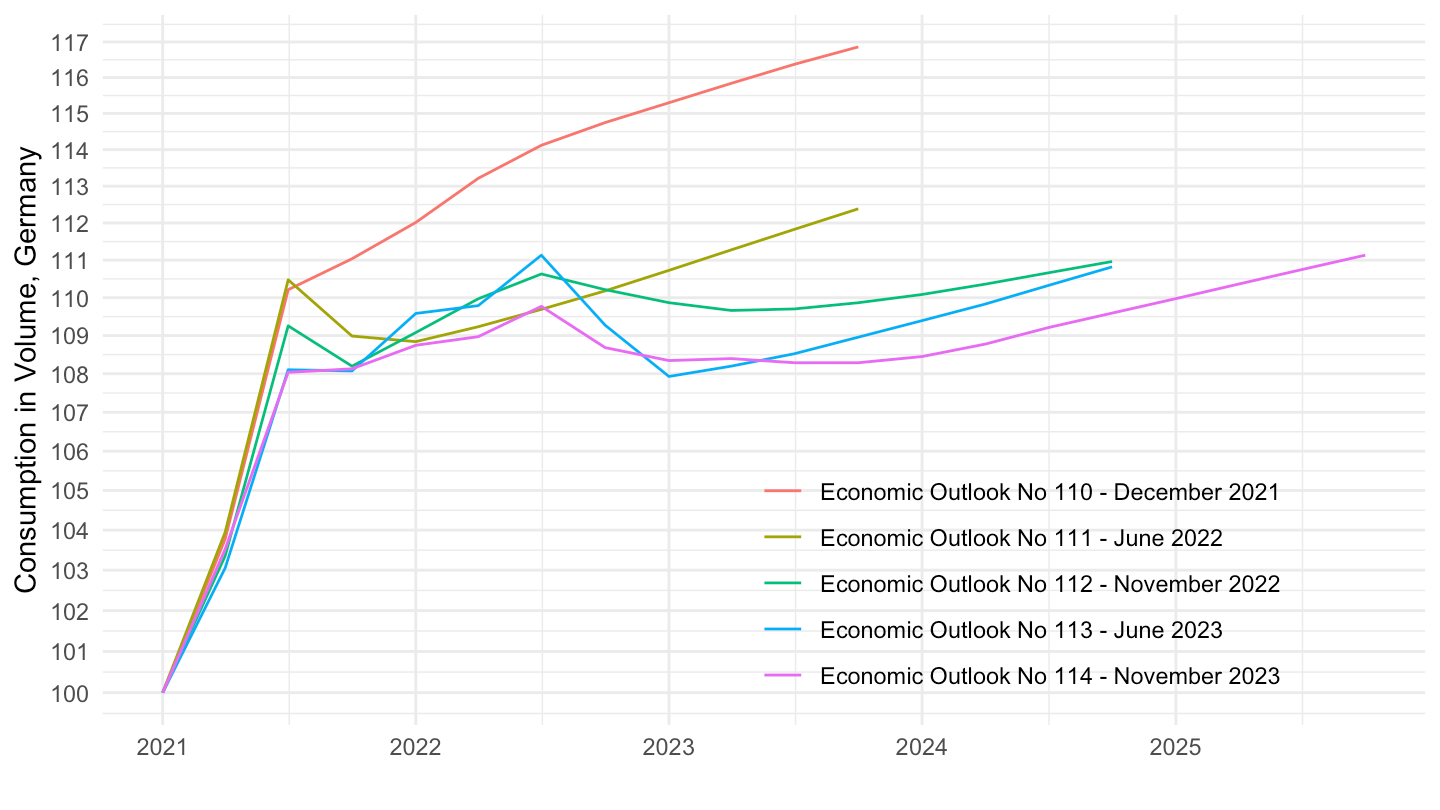
Consumption in Volume

Code
EO110_INTERNET %>%
  mutate(vintage = "Economic Outlook No 110 - December 2021") %>%
  bind_rows(EO111_INTERNET %>%
              mutate(vintage = "Economic Outlook No 111 - June 2022")) %>%
  bind_rows(EO112_INTERNET %>%
              mutate(vintage = "Economic Outlook No 112 - November 2022")) %>%
  bind_rows(EO113_INTERNET %>%
              mutate(vintage = "Economic Outlook No 113 - June 2023")) %>%
  bind_rows(EO114_INTERNET %>%
              mutate(vintage = "Economic Outlook No 114 - November 2023")) %>%
  filter(VARIABLE == "CPV", 
         LOCATION == "DEU",
         FREQUENCY == "Q") %>%
  quarter_to_date() %>%
  filter(date >= as.Date("2021-01-01")) %>%
  group_by(vintage) %>%
  mutate(obsValue = 100*obsValue/obsValue[date == as.Date("2021-01-01")]) %>%
  ggplot + geom_line(aes(x = date, y = obsValue, color = vintage)) +
  xlab("") + ylab("Consumption in Volume, Germany") + theme_minimal() +
  scale_x_date(breaks = seq(1920, 2100, 1) %>% paste0("-01-01") %>% as.Date,
               labels = date_format("%Y")) +
  theme(legend.position = c(0.7, 0.2),
        legend.title = element_blank()) +
  scale_y_log10(breaks = seq(20, 200, 1))

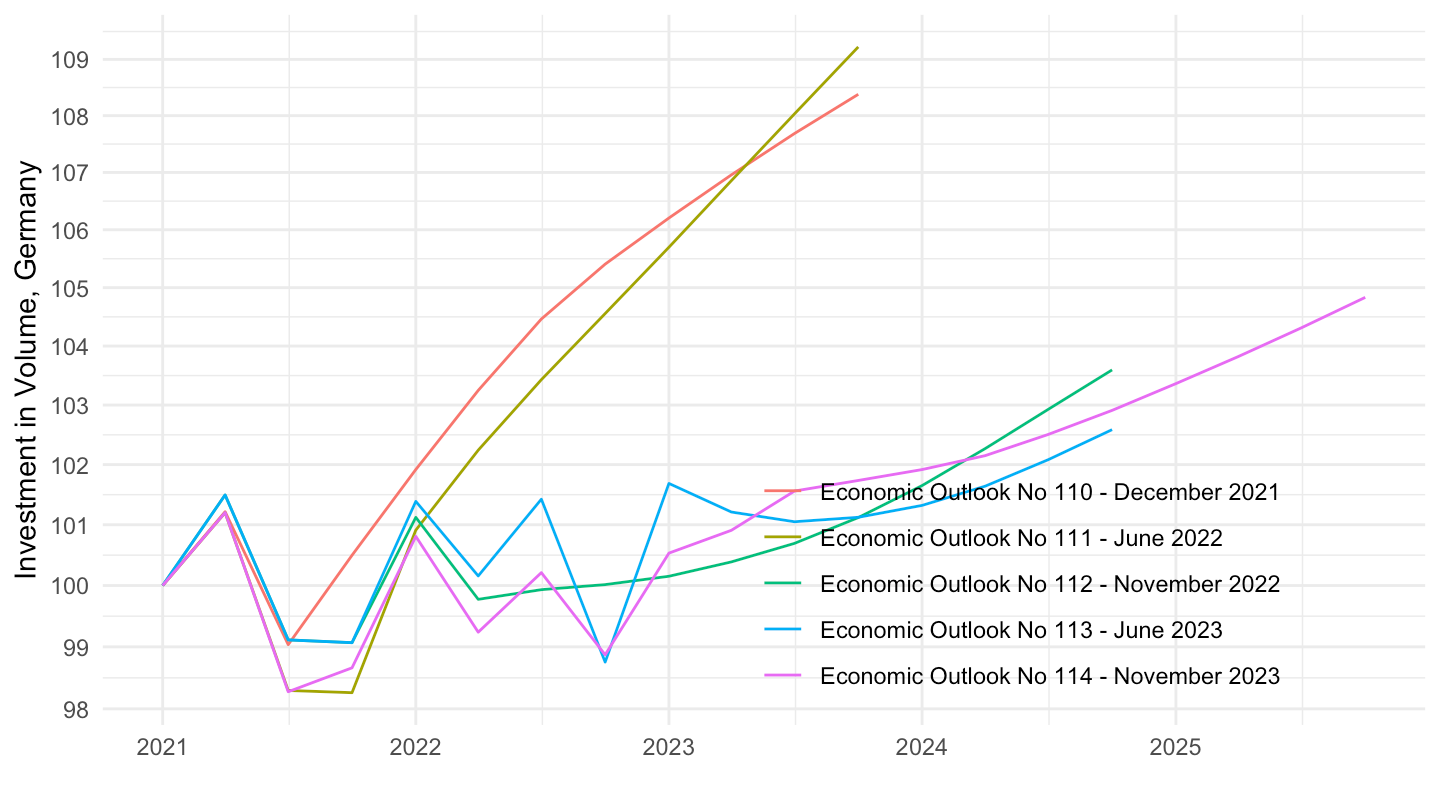
Investment in Volume

Code
EO110_INTERNET %>%
  mutate(vintage = "Economic Outlook No 110 - December 2021") %>%
  bind_rows(EO111_INTERNET %>%
              mutate(vintage = "Economic Outlook No 111 - June 2022")) %>%
  bind_rows(EO112_INTERNET %>%
              mutate(vintage = "Economic Outlook No 112 - November 2022")) %>%
  bind_rows(EO113_INTERNET %>%
              mutate(vintage = "Economic Outlook No 113 - June 2023")) %>%
  bind_rows(EO114_INTERNET %>%
              mutate(vintage = "Economic Outlook No 114 - November 2023")) %>%
  filter(VARIABLE == "ITV", 
         LOCATION == "DEU",
         FREQUENCY == "Q") %>%
  quarter_to_date() %>%
  filter(date >= as.Date("2021-01-01")) %>%
  group_by(vintage) %>%
  mutate(obsValue = 100*obsValue/obsValue[date == as.Date("2021-01-01")]) %>%
  ggplot + geom_line(aes(x = date, y = obsValue, color = vintage)) +
  xlab("") + ylab("Investment in Volume, Germany") + theme_minimal() +
  scale_x_date(breaks = seq(1920, 2100, 1) %>% paste0("-01-01") %>% as.Date,
               labels = date_format("%Y")) +
  theme(legend.position = c(0.7, 0.2),
        legend.title = element_blank()) +
  scale_y_log10(breaks = seq(20, 200, 1))