
Last data update: 02 août 2026, 11:04
Last compile: 16 oct. 2026, 01:44
ip1288 |>
  ggplot() + geom_line(aes(x = centile, y = salaire), color = rgb(0.2, 0.4, 0.65), linewidth = 1) +
  theme_minimal() + xlab("Centile") + ylab("Salaire annuel brut (€)") +
  scale_y_continuous(labels = scales::label_number(big.mark = " "))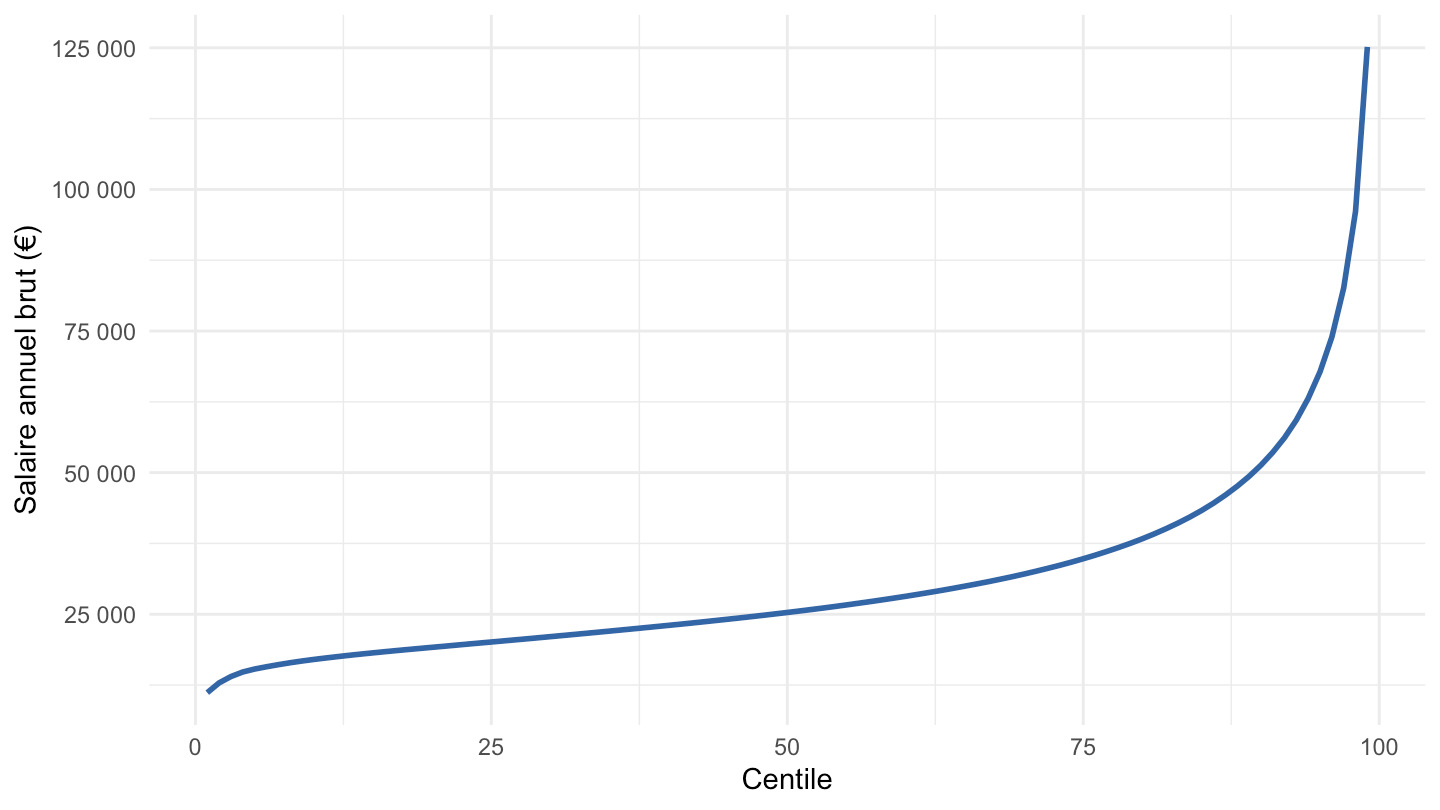
ip1288 |>
  ggplot() + geom_line(aes(x = salaire, y = countercumulative), color = rgb(0.6, 0.2, 0.35), linewidth = 1) +
  theme_minimal() + xlab("Salaire annuel brut (€)") + ylab("Part des salariés gagnant plus") +
  scale_x_continuous(labels = scales::label_number(big.mark = " ")) +
  scale_y_continuous(labels = scales::percent_format())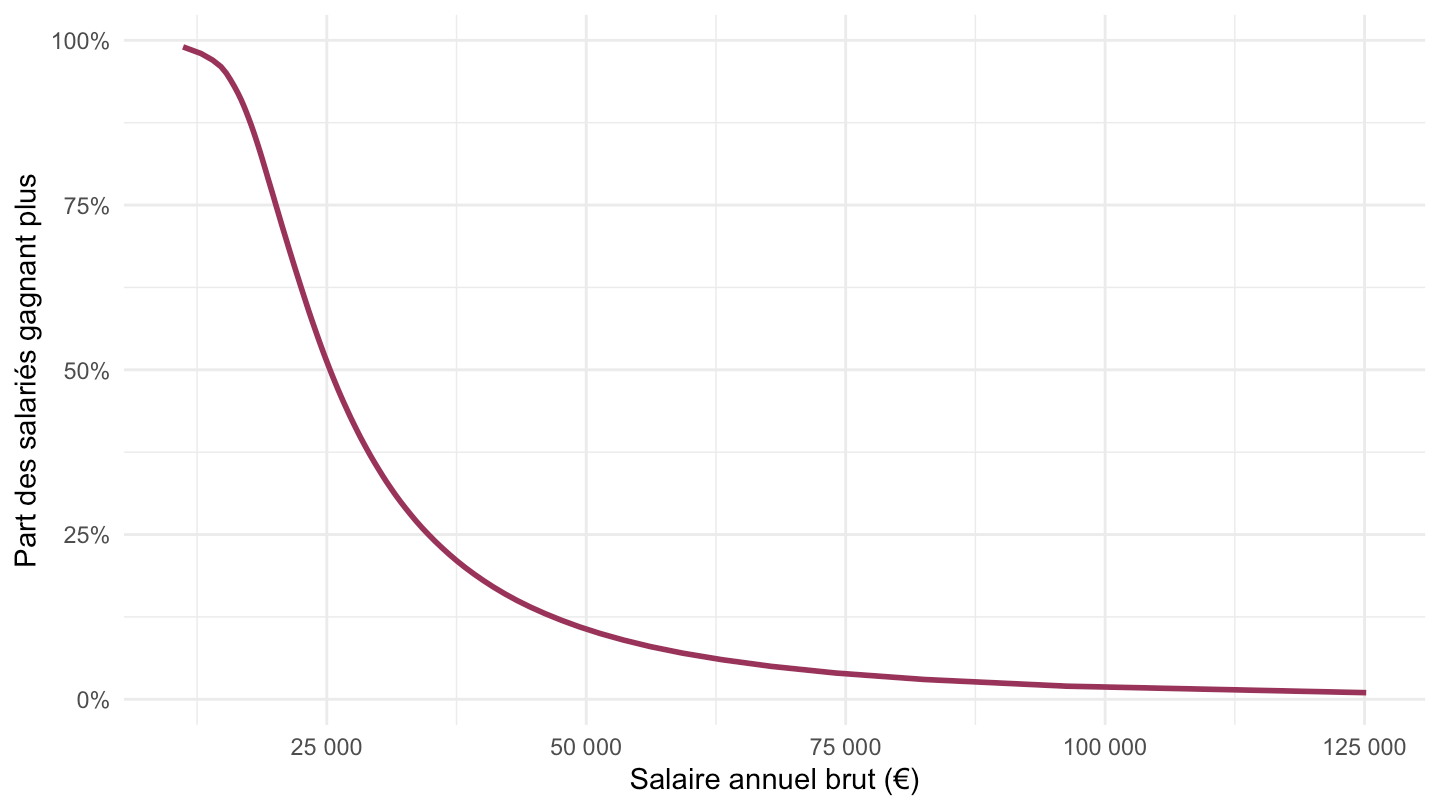
Si la queue suit une loi de Pareto, \(P(W > w) = (w_m / w)^{\alpha}\), donc \(\log P(W>w)\) est linéaire en \(\log w\), de pente \(-\alpha\). On ajuste la droite sur le haut de la distribution (à partir du percentile choisi ci-dessous ; les données s’arrêtent au 99e centile).
seuil <- 90   # percentile à partir duquel on ajuste la loi de Pareto

queue <- ip1288 |> filter(centile >= seuil)
fit <- lm(log(countercumulative) ~ log(salaire), data = queue)
alpha <- -coef(fit)[["log(salaire)"]]

ip1288 |>
  mutate(queue = centile >= seuil) |>
  ggplot(aes(x = salaire, y = countercumulative)) +
  geom_point(aes(color = queue), size = 1.8) +
  geom_smooth(data = queue, method = "lm", se = FALSE, color = "black",
              linewidth = 0.6, linetype = "dashed") +
  scale_color_manual(values = c(`FALSE` = "grey60", `TRUE` = rgb(0.6, 0.2, 0.35)),
                     labels = c("Corps de la distribution", paste0("Queue (≥ P", seuil, ")")),
                     name = NULL) +
  scale_x_log10(breaks = c(1e4, 2e4, 3e4, 5e4, 1e5, 2e5),
                labels = scales::label_number(big.mark = " ")) +
  scale_y_log10(breaks = c(.01, .02, .05, .1, .2, .5, 1),
                labels = scales::label_percent(accuracy = 1)) +
  annotation_logticks(sides = "bl") +
  theme_minimal() + theme(legend.position = "bottom") +
  labs(x = "Salaire annuel brut (€, échelle log)",
       y = "Part des salariés gagnant plus (échelle log)",
       title = sprintf("Exposant de Pareto estimé sur la queue : α ≈ %.2f", alpha))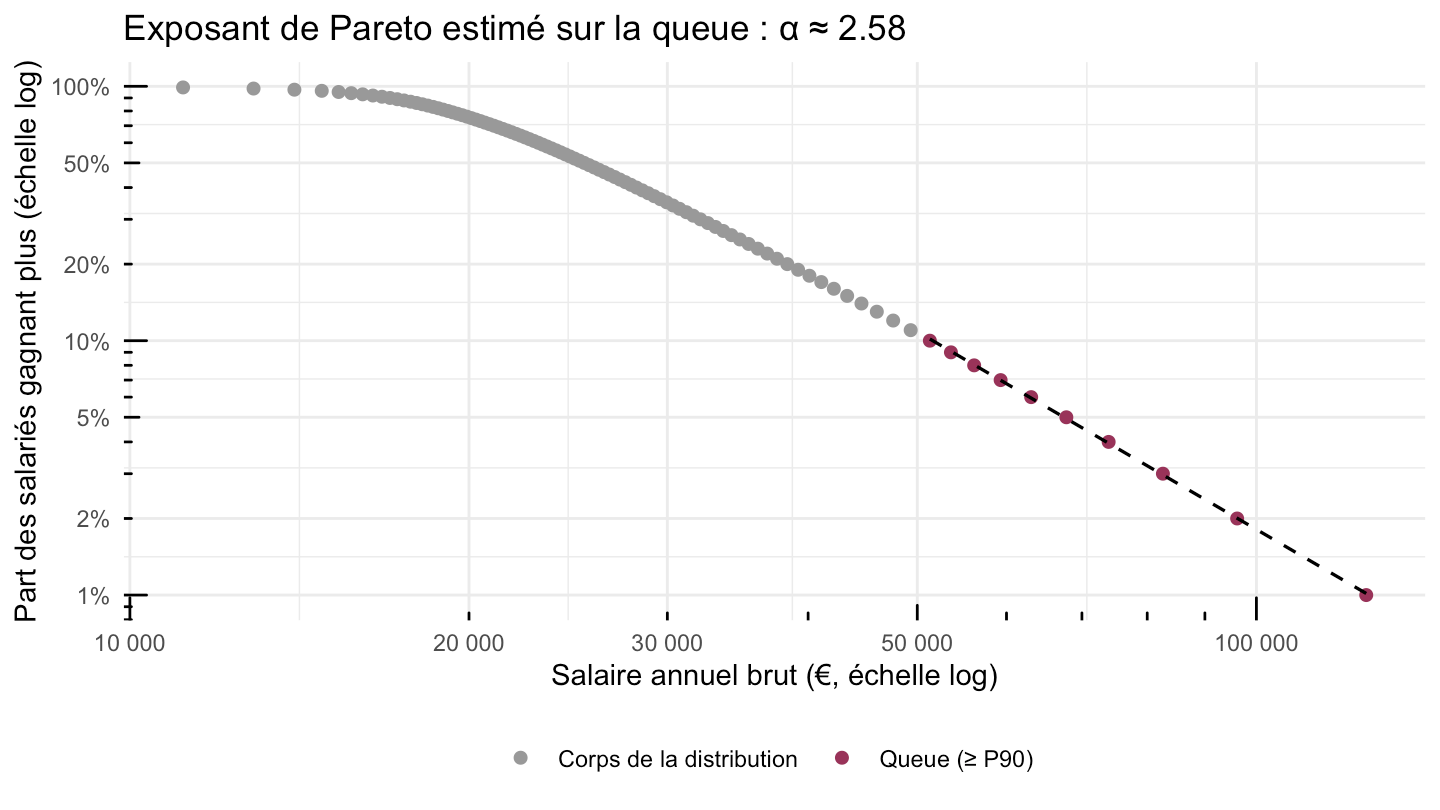
# Robustesse : α selon le percentile de départ de l'ajustement
purrr::map_dfr(c(50, 70, 80, 90, 95), \(s) {
  f <- lm(log(countercumulative) ~ log(salaire), data = filter(ip1288, centile >= s))
  tibble(`À partir du centile` = s, `α` = round(-coef(f)[[2]], 2),
         `R²` = round(summary(f)$r.squared, 3))
}) |>
knitr::kable()| À partir du centile | α | R² |
|---|---|---|
| 50 | 2.40 | 0.999 |
| 70 | 2.47 | 0.999 |
| 80 | 2.52 | 0.999 |
| 90 | 2.58 | 1.000 |
| 95 | 2.63 | 1.000 |
| source | dataset | Title | Updated |
|---|---|---|---|