| source | dataset | Title | .html | .rData |
|---|---|---|---|---|
| insee | SMIC-COTISATIONS | Taux de cotisations et salaires minima garantis - SMIC-COTISATIONS | 2026-02-16 | 2026-02-16 |
Taux de cotisations et salaires minima garantis - SMIC-COTISATIONS
Data - INSEE
Info
TITLE_FR
Code
`SMIC-COTISATIONS` %>%
  group_by(IDBANK, TITLE_FR) %>%
  summarise(Nobs = n(),
            date1 = first(TIME_PERIOD),
            date2 = last(TIME_PERIOD)) %>%
  arrange(-Nobs) %>%
  print_table_conditional
INDICATEURS_SMIC_COTISATIONS
Code
`SMIC-COTISATIONS` %>%
  left_join(INDICATEURS_SMIC_COTISATIONS, by = "INDICATEURS_SMIC_COTISATIONS") %>%
  group_by(INDICATEURS_SMIC_COTISATIONS, Indicateurs_smic_cotisations) %>%
  summarise(Nobs = n()) %>%
  arrange(-Nobs) %>%
  print_table_conditional
INDICATEUR
Code
`SMIC-COTISATIONS` %>%
  left_join(INDICATEUR, by = "INDICATEUR") %>%
  group_by(INDICATEUR, Indicateur) %>%
  summarise(Nobs = n()) %>%
  arrange(-Nobs) %>%
print_table_conditional| INDICATEUR | Indicateur | Nobs |
|---|---|---|
| CHGP | Cotisations sociales patronales | 8000 |
| CHGS | Cotisations sociales salariales | 5913 |
| SMG | Salaires minima garantis | 3004 |
| RET_COMP | Retraites complémentaires | 1364 |
NATURE
Code
`SMIC-COTISATIONS` %>%
  left_join(NATURE, by = "NATURE") %>%
  group_by(NATURE, Nature) %>%
  summarise(Nobs = n()) %>%
  arrange(-Nobs) %>%
print_table_conditional| NATURE | Nature | Nobs |
|---|---|---|
| PROPORTION_POURCENTAGE | Proportion en % | 15158 |
| VALEUR_ABSOLUE | Valeur absolue | 3123 |
Series in 1980
Code
`SMIC-COTISATIONS` %>%
  filter(TIME_PERIOD == "1980-01") %>%
  select(INDICATEUR, IDBANK, TITLE_FR) %>%
print_table_conditional()| INDICATEUR | IDBANK | TITLE_FR |
|---|---|---|
| SMG | 000077502 | Salaire minimum brut interprofessionnel de croissance (Smic) : augmentation en % |
| CHGS | 000077576 | Taux de cotisations sociales (part salariale) des non-cadres, hors contribution sociale généralisée (CSG) et contribution au remboursement de la dette sociale (CRDS) : pour les salaires inférieurs à 1 plafond de la sécurité sociale |
| SMG | 000822484 | Montant du Smic (Salaire minimum interprofessionnel de croissance) brut horaire |
SMIC Horaire
Graph - Linear
Code
`SMIC-COTISATIONS` %>%
  filter(IDBANK == "000822484") %>%
  month_to_date %>%
  select(date, OBS_VALUE) %>%
  ggplot + geom_line(aes(x = date, y = OBS_VALUE)) +
  theme_minimal() + xlab("") + ylab("") +
  scale_x_date(breaks = seq(1940, 2022, 5) %>% paste0("-01-01") %>% as.Date,
               labels = date_format("%Y")) +
  scale_y_continuous(breaks = seq(0, 2000, 1),
                     labels = dollar_format(accuracy = 1, prefix = "", suffix = "€"))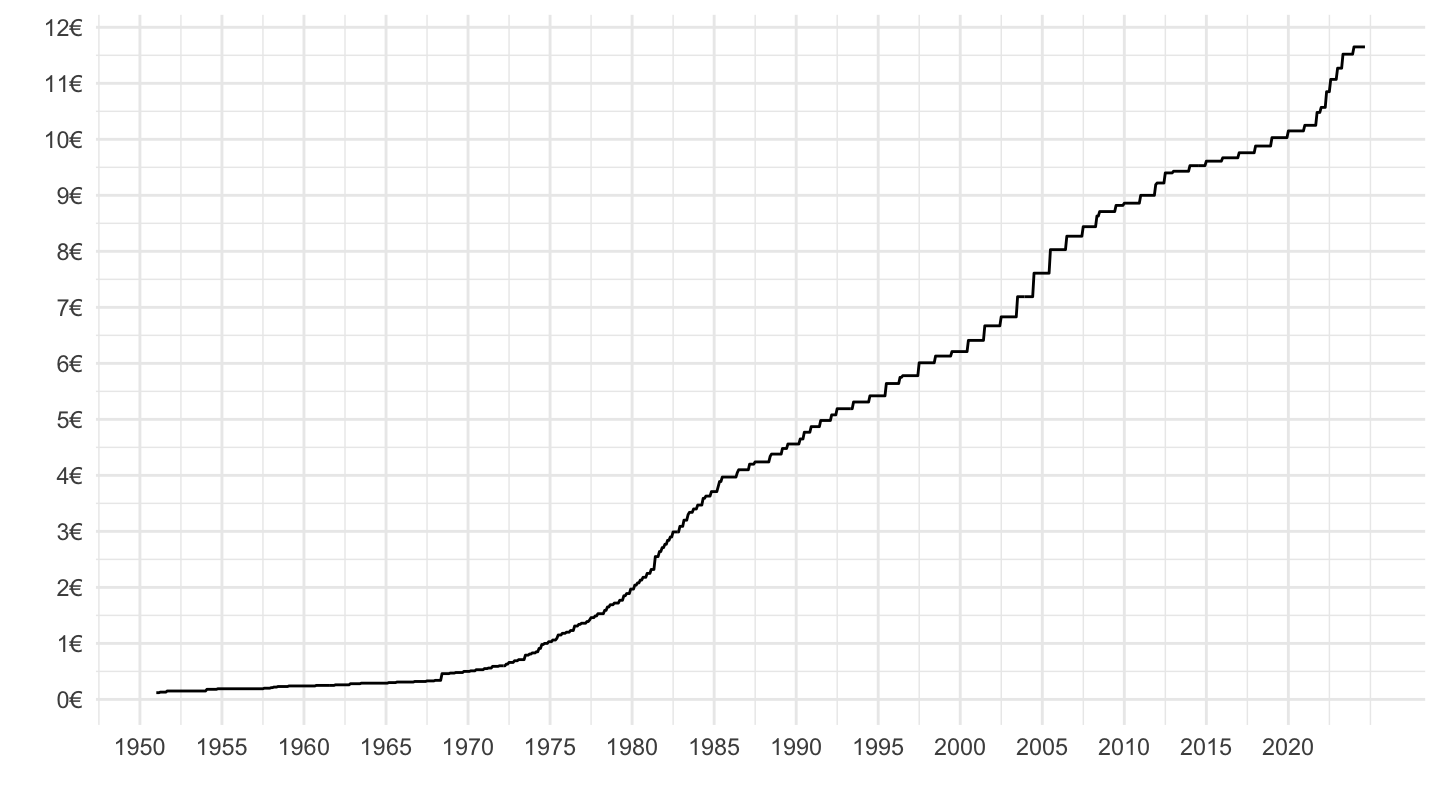
Graph - Log
Code
`SMIC-COTISATIONS` %>%
  filter(IDBANK == "000822484") %>%
  month_to_date %>%
  select(date, OBS_VALUE) %>%
  ggplot + geom_line(aes(x = date, y = OBS_VALUE)) +
  theme_minimal() + xlab("") + ylab("") +
  scale_x_date(breaks = seq(1940, 2022, 5) %>% paste0("-01-01") %>% as.Date,
               labels = date_format("%Y")) +
  scale_y_log10(breaks = c(0.1, 0.2, 0.5, 1, 2, 5, 10),
                     labels = dollar_format(accuracy = .1, prefix = "", suffix = "€"))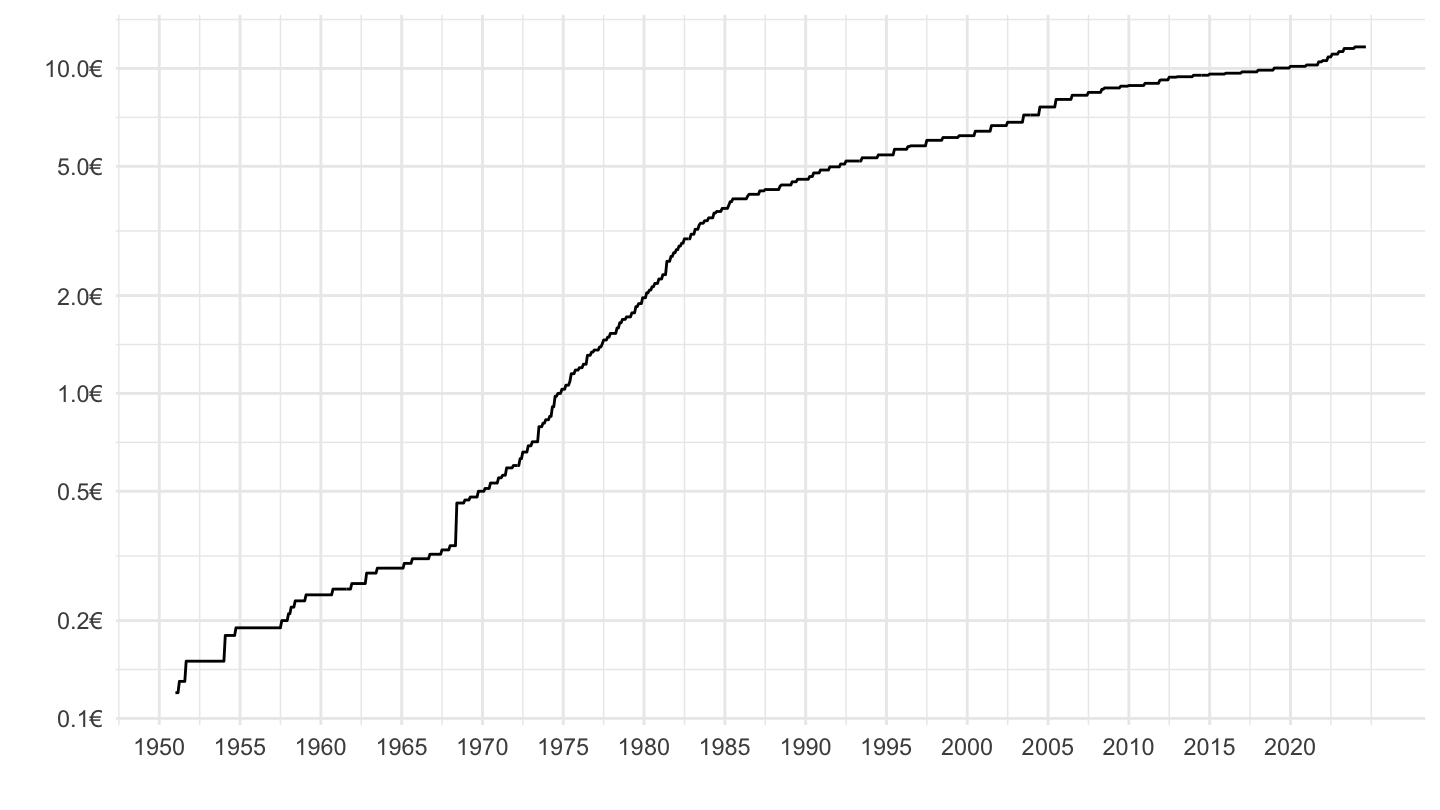
Taux bruts
Taux horaire du SMIC brut, dernier: 12.02€/h.
12.02€/h x 151,666h/mois = 1823.02532€
12.02€/h x 35h/semaine x 52 = 2.18764^{4}€
1 année = 35h/semaine x 52 = 1820 h / an.
4.333333 semaines par mois. (52 semaines sur 12 semaines)
151,666 = 35*52/12= 151.6666667
Taux nets
Taux horaire du SMIC net, dernier: 9.52€/h.
9.52€/h x 151,666h/mois = 1443.86032€
9.52€/h x 35h/semaine x 52 = 1.73264^{4}€
1 année = 35h/semaine x 52 = 1820 h / an.
4.333333 semaines par mois. (52 semaines sur 12 semaines)
151,666 = 35h/semaine x 52 / 12 = 151.6666667
Montant mensuel
2005-
Code
`SMIC-COTISATIONS` %>%
  filter(INDICATEURS_SMIC_COTISATIONS %in% c("SMICMB-35H", "SMICMNN-35H")) %>%
  left_join(INDICATEURS_SMIC_COTISATIONS, by = "INDICATEURS_SMIC_COTISATIONS") %>%
  month_to_date() %>%
  select(Indicateurs_smic_cotisations, date, OBS_VALUE) %>%
  ggplot(aes(x = date, y = OBS_VALUE, color = Indicateurs_smic_cotisations)) +
  geom_line() +
  geom_label(
    data = . %>% filter(date == max(date)),
    aes(label = paste0(format(OBS_VALUE, big.mark = " ", decimal.mark = ",", digits = 6), " €")),
    show.legend = FALSE
  ) +
  scale_x_date(
    breaks = seq(as.Date("1960-01-01"), as.Date("2100-01-01"), by = "2 years"),
    labels = date_format("%Y")
  ) +
  scale_y_log10(
    breaks = seq(100, 2000, 100),
    labels = label_number(accuracy = 1, suffix = " €", big.mark = " ")
  ) +
  theme_minimal() +
  theme(
    legend.position = c(0.2, 0.9),
    legend.title = element_blank()
  ) +
  xlab("") + ylab("")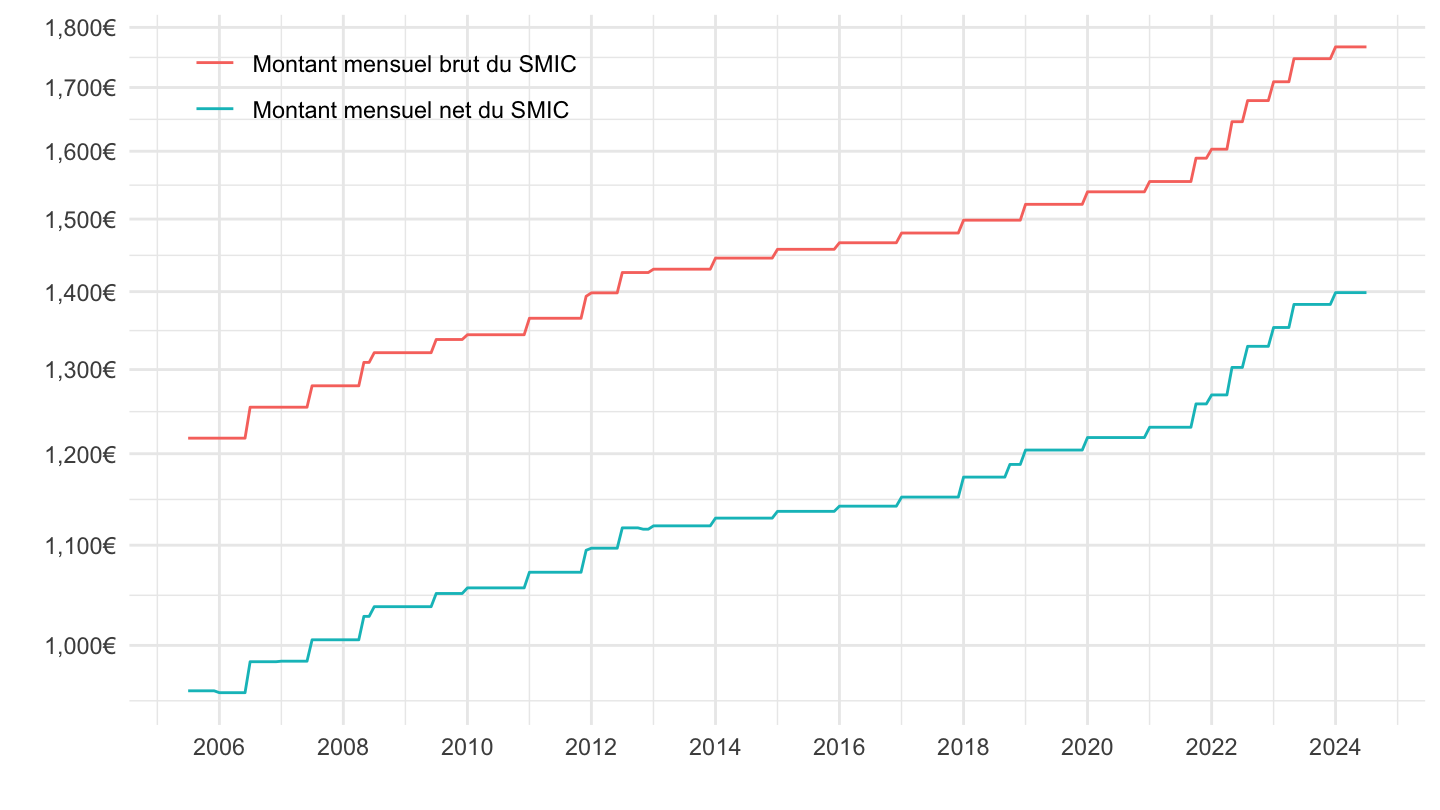
2012-
Code
`SMIC-COTISATIONS` %>%
  filter(INDICATEURS_SMIC_COTISATIONS %in% c("SMICMB-35H", "SMICMNN-35H")) %>%
  left_join(INDICATEURS_SMIC_COTISATIONS, by = "INDICATEURS_SMIC_COTISATIONS") %>%
  month_to_date %>%
  filter(date >= as.Date("2012-01-01")) %>%
  select(Indicateurs_smic_cotisations, date, OBS_VALUE) %>%
  ggplot(aes(x = date, y = OBS_VALUE, color = Indicateurs_smic_cotisations)) +
  geom_line() +
  geom_label(
    data = . %>% filter(date == max(date)),
    aes(label = paste0(format(OBS_VALUE, big.mark = " ", decimal.mark = ",", digits = 6), " €")),
    show.legend = FALSE
  ) +
  scale_x_date(
    breaks = seq(as.Date("1960-01-01"), as.Date("2100-01-01"), by = "2 years"),
    labels = date_format("%Y")
  ) +
  scale_y_log10(
    breaks = seq(100, 2000, 100),
    labels = label_number(accuracy = 1, suffix = " €", big.mark = " ")
  ) +
  theme_minimal() +
  theme(
    legend.position = c(0.2, 0.9),
    legend.title = element_blank()
  ) +
  xlab("") + ylab("")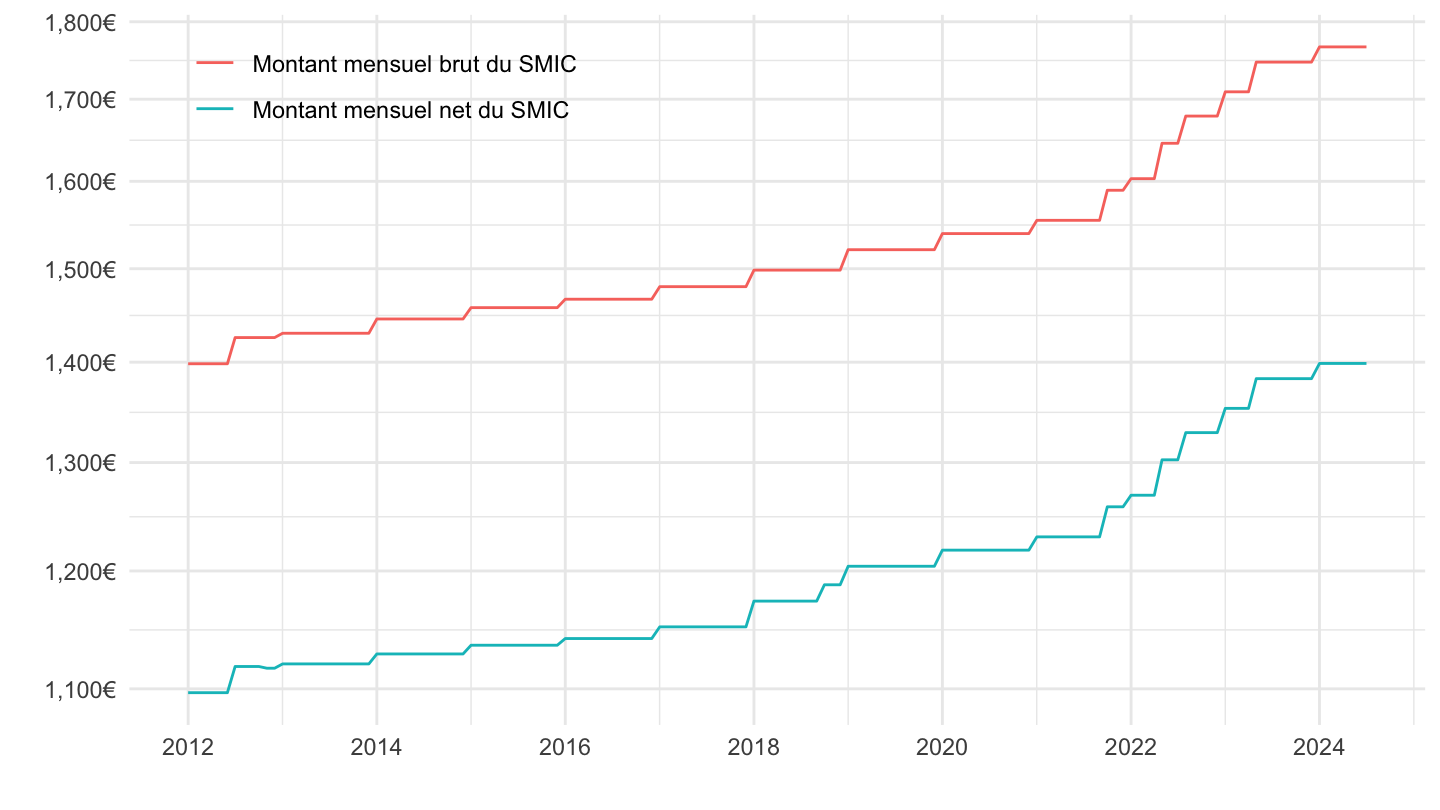
2017-
Euros
Code
`SMIC-COTISATIONS` %>%
  filter(INDICATEURS_SMIC_COTISATIONS %in% c("SMICMB-35H", "SMICMNN-35H")) %>%
  left_join(INDICATEURS_SMIC_COTISATIONS, by = "INDICATEURS_SMIC_COTISATIONS") %>%
  month_to_date %>%
  filter(date >= as.Date("2017-01-01")) %>%
  select(Indicateurs_smic_cotisations, date, OBS_VALUE) %>%
  ggplot + geom_line(aes(x = date, y = OBS_VALUE, color = Indicateurs_smic_cotisations)) +
  theme_minimal() + xlab("") + ylab("") +
  scale_x_date(breaks = "6 months",
               labels = date_format("%b %Y")) +
  scale_y_log10(breaks = seq(0, 2000, 100),
                     labels = dollar_format(accuracy = 1, prefix = "", suffix = "€")) +

  theme(legend.position = c(0.2, 0.9),
        legend.title = element_blank(),
        axis.text.x = element_text(angle = 45, vjust = 1, hjust = 1)) +
  geom_label(data = . %>% filter(date %in% c(max(date), min(date))),
             aes(x = date, y = OBS_VALUE, label = formatC(OBS_VALUE, big.mark = " "), color = Indicateurs_smic_cotisations))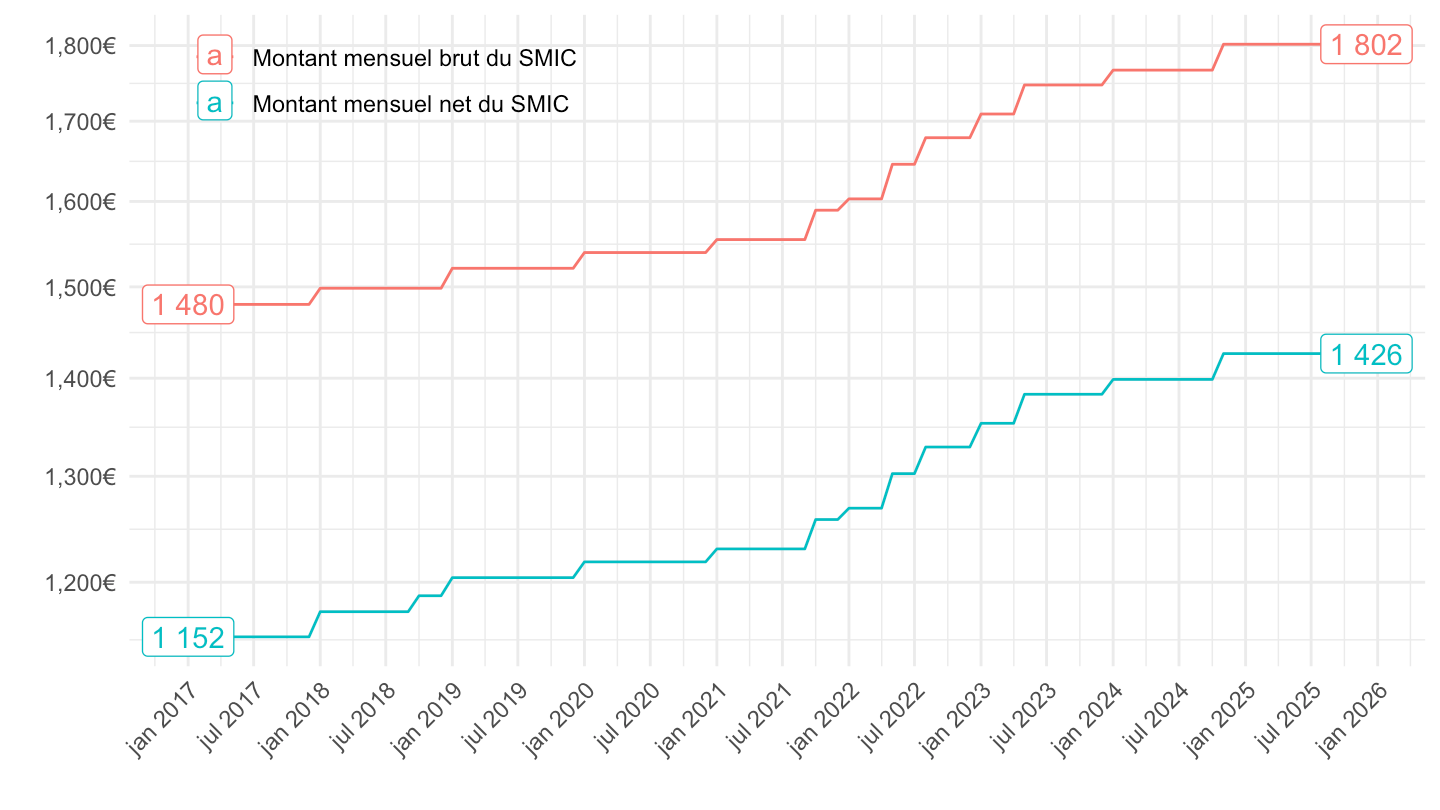
Indice
Code
`SMIC-COTISATIONS` %>%
  filter(INDICATEURS_SMIC_COTISATIONS %in% c("SMICMB-35H", "SMICMNN-35H")) %>%
  left_join(INDICATEURS_SMIC_COTISATIONS, by = "INDICATEURS_SMIC_COTISATIONS") %>%
  month_to_date %>%
  filter(date >= as.Date("2017-01-01")) %>%
  select(Indicateurs_smic_cotisations, date, OBS_VALUE) %>%
  group_by(Indicateurs_smic_cotisations) %>%
  arrange(date) %>%
  mutate(indice = 100*OBS_VALUE/OBS_VALUE[1]) %>%
  ggplot + geom_line(aes(x = date, y = indice, color = Indicateurs_smic_cotisations)) +
  theme_minimal() + xlab("") + ylab("") +
  scale_x_date(breaks = "6 months",
               labels = date_format("%b %Y")) +
  scale_y_log10(breaks = seq(0, 2000, 2)) +
  theme(legend.position = c(0.2, 0.9),
        legend.title = element_blank(),
        axis.text.x = element_text(angle = 45, vjust = 1, hjust = 1)) +
  geom_label_repel(data = . %>% filter(date == max(date)),
             aes(x = date, y = indice, label = round(indice, 1), color = Indicateurs_smic_cotisations), show.legend = F)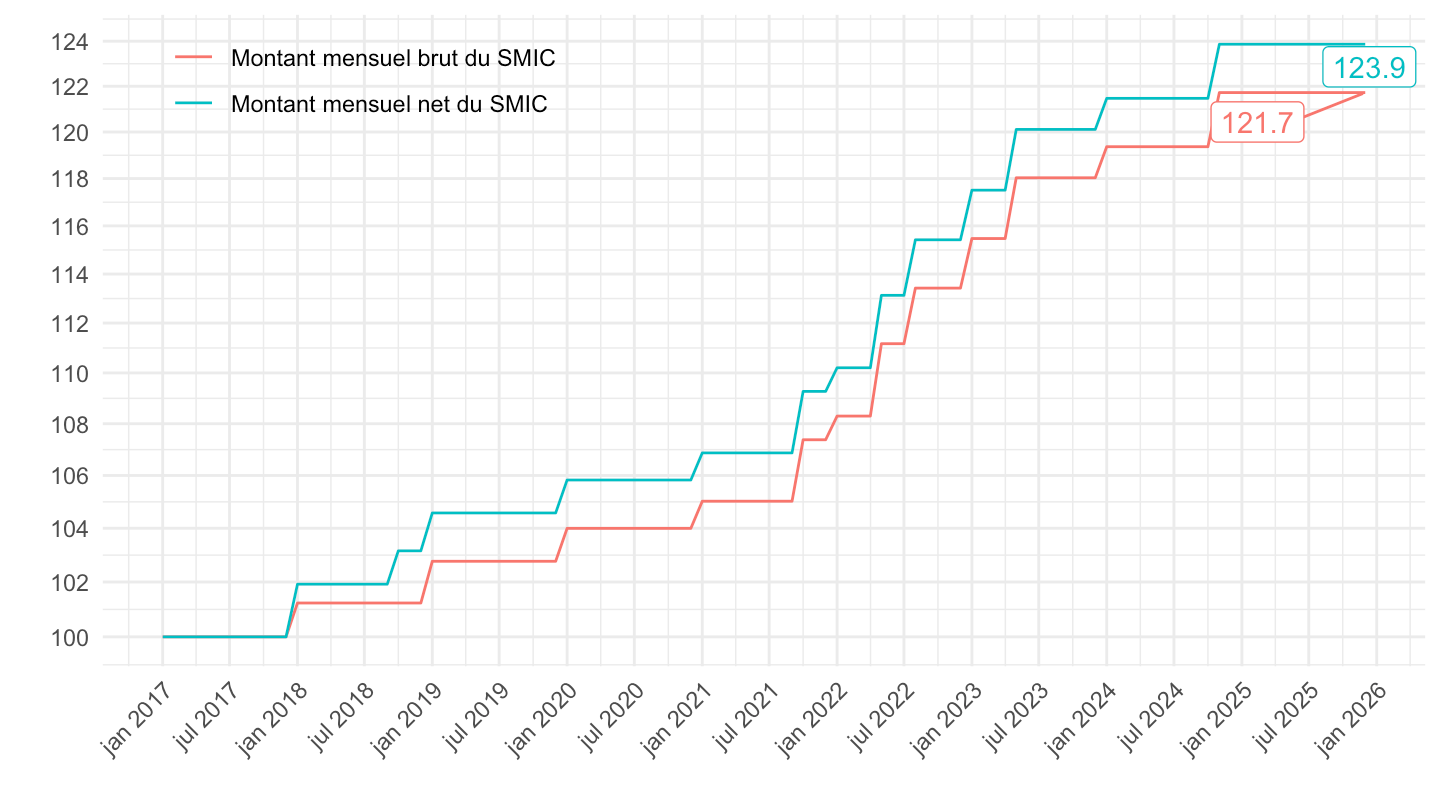
2020-
Euros
Code
`SMIC-COTISATIONS` %>%
  filter(INDICATEURS_SMIC_COTISATIONS %in% c("SMICMB-35H", "SMICMNN-35H")) %>%
  left_join(INDICATEURS_SMIC_COTISATIONS, by = "INDICATEURS_SMIC_COTISATIONS") %>%
  month_to_date %>%
  filter(date >= as.Date("2020-01-01")) %>%
  select(Indicateurs_smic_cotisations, date, OBS_VALUE) %>%
  ggplot + geom_line(aes(x = date, y = OBS_VALUE, color = Indicateurs_smic_cotisations)) +
  theme_minimal() + xlab("") + ylab("") +
  scale_x_date(breaks = "3 months",
               labels = date_format("%b %Y")) +
  scale_y_log10(breaks = seq(0, 2000, 100),
                     labels = dollar_format(accuracy = 1, prefix = "", suffix = "€")) +

  theme(legend.position = c(0.2, 0.9),
        legend.title = element_blank(),
        axis.text.x = element_text(angle = 45, vjust = 1, hjust = 1))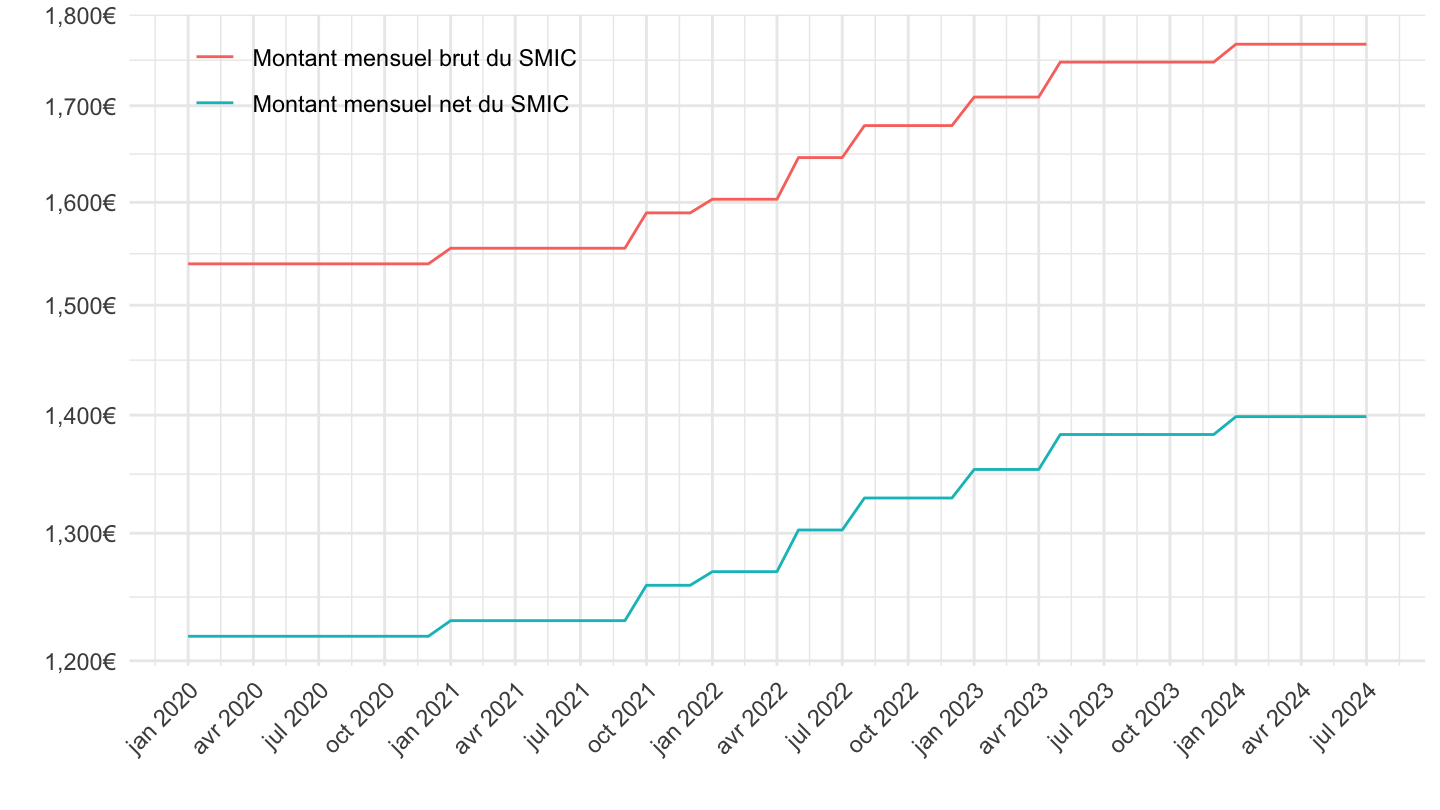
Indice
Code
`SMIC-COTISATIONS` %>%
  filter(INDICATEURS_SMIC_COTISATIONS %in% c("SMICMB-35H", "SMICMNN-35H")) %>%
  left_join(INDICATEURS_SMIC_COTISATIONS, by = "INDICATEURS_SMIC_COTISATIONS") %>%
  month_to_date %>%
  filter(date >= as.Date("2020-01-01")) %>%
  select(Indicateurs_smic_cotisations, date, OBS_VALUE) %>%
  group_by(Indicateurs_smic_cotisations) %>%
  arrange(date) %>%
  mutate(indice = 100*OBS_VALUE/OBS_VALUE[1]) %>%
  ggplot + geom_line(aes(x = date, y = indice, color = Indicateurs_smic_cotisations)) +
  theme_minimal() + xlab("") + ylab("") +
  scale_x_date(breaks = "2 months",
               labels = date_format("%b %Y")) +
  scale_y_log10(breaks = seq(0, 2000, 2)) +
  theme(legend.position = c(0.2, 0.9),
        legend.title = element_blank(),
        axis.text.x = element_text(angle = 45, vjust = 1, hjust = 1))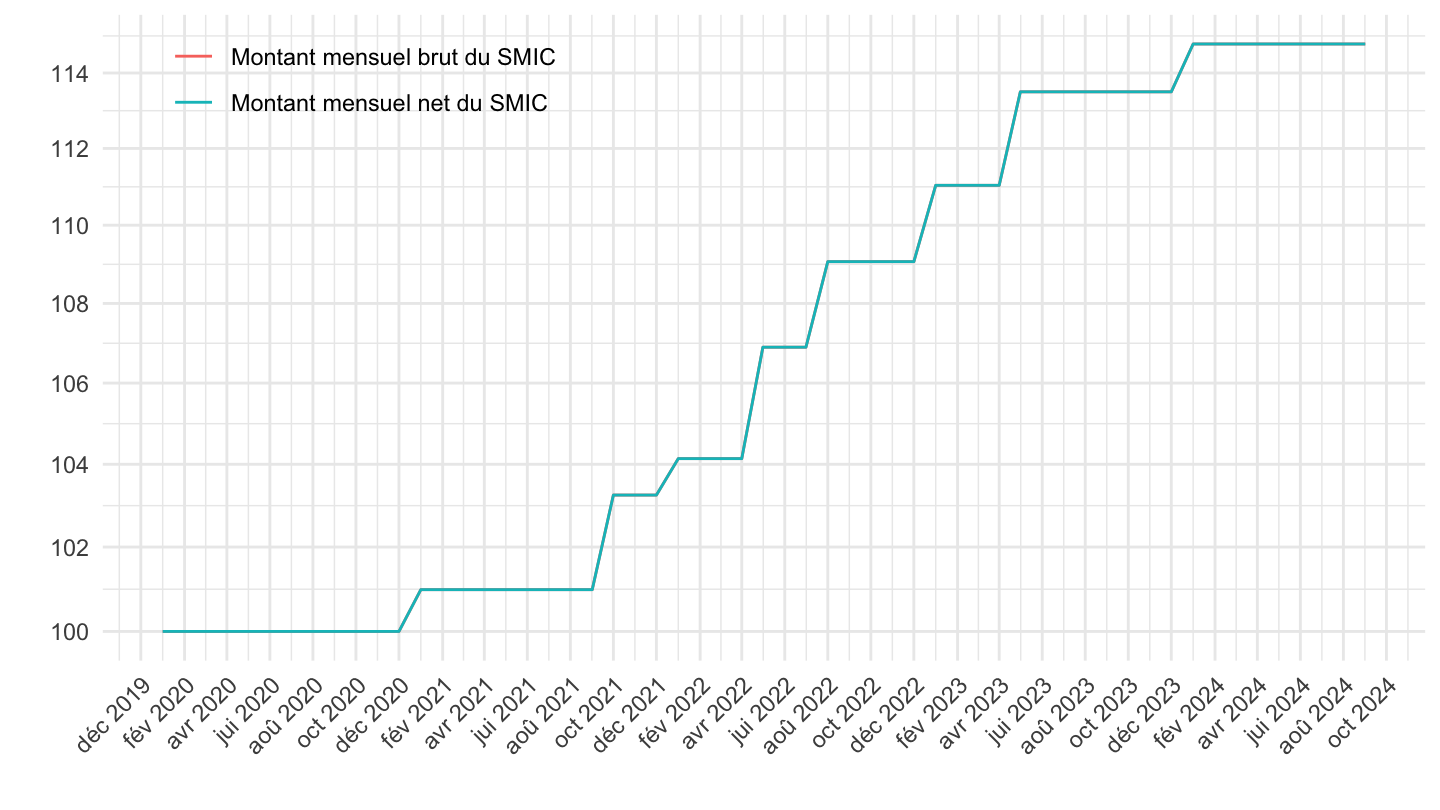
2021-
Euros
Code
`SMIC-COTISATIONS` %>%
  filter(INDICATEURS_SMIC_COTISATIONS %in% c("SMICMB-35H", "SMICMNN-35H")) %>%
  left_join(INDICATEURS_SMIC_COTISATIONS, by = "INDICATEURS_SMIC_COTISATIONS") %>%
  month_to_date %>%
  filter(date >= as.Date("2021-01-01")) %>%
  select(Indicateurs_smic_cotisations, date, OBS_VALUE) %>%
  ggplot + geom_line(aes(x = date, y = OBS_VALUE, color = Indicateurs_smic_cotisations)) +
  theme_minimal() + xlab("") + ylab("") +
  scale_x_date(breaks = "2 months",
               labels = date_format("%b %Y")) +
  scale_y_log10(breaks = seq(0, 2000, 100),
                     labels = dollar_format(accuracy = 1, prefix = "", suffix = "€")) +

  theme(legend.position = c(0.2, 0.9),
        legend.title = element_blank(),
        axis.text.x = element_text(angle = 45, vjust = 1, hjust = 1))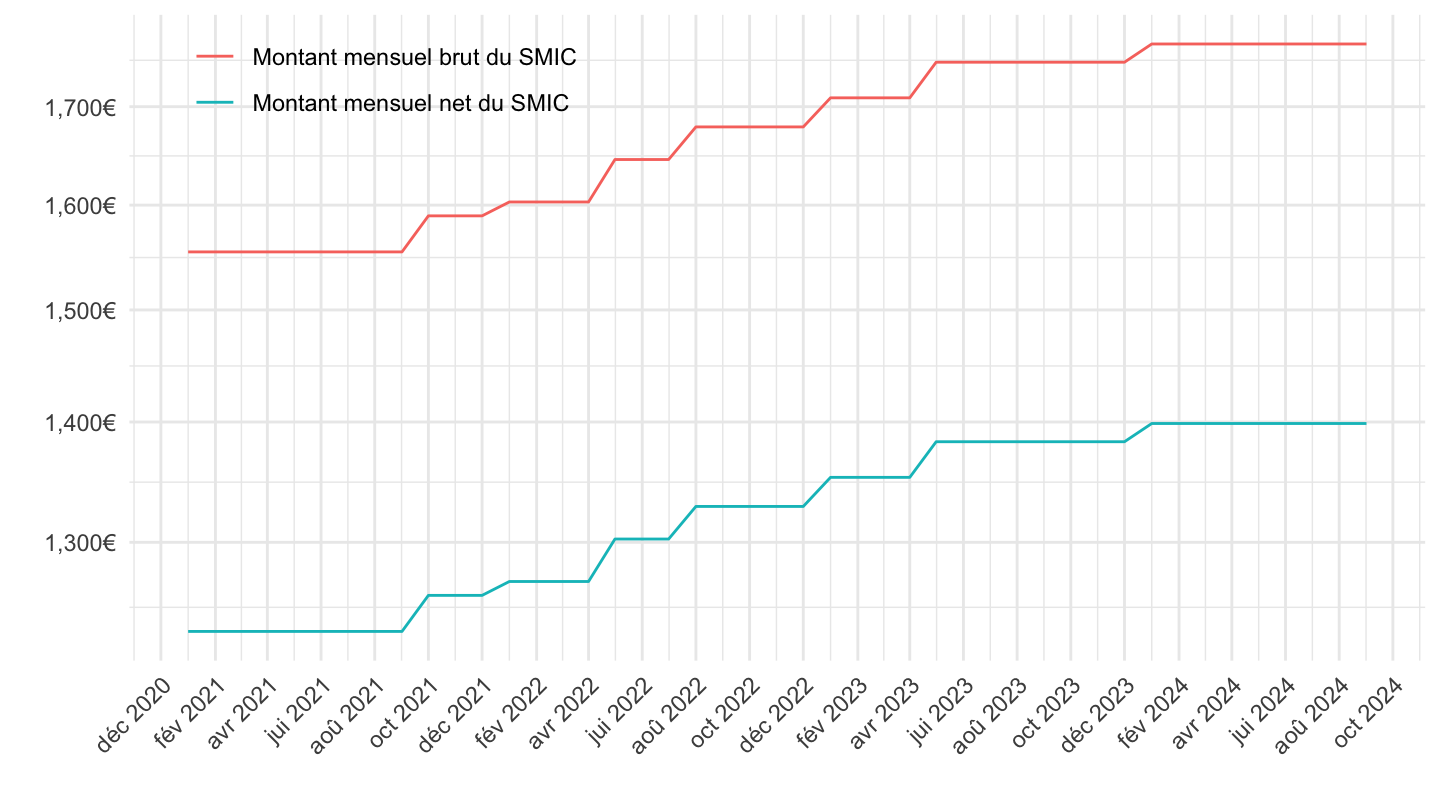
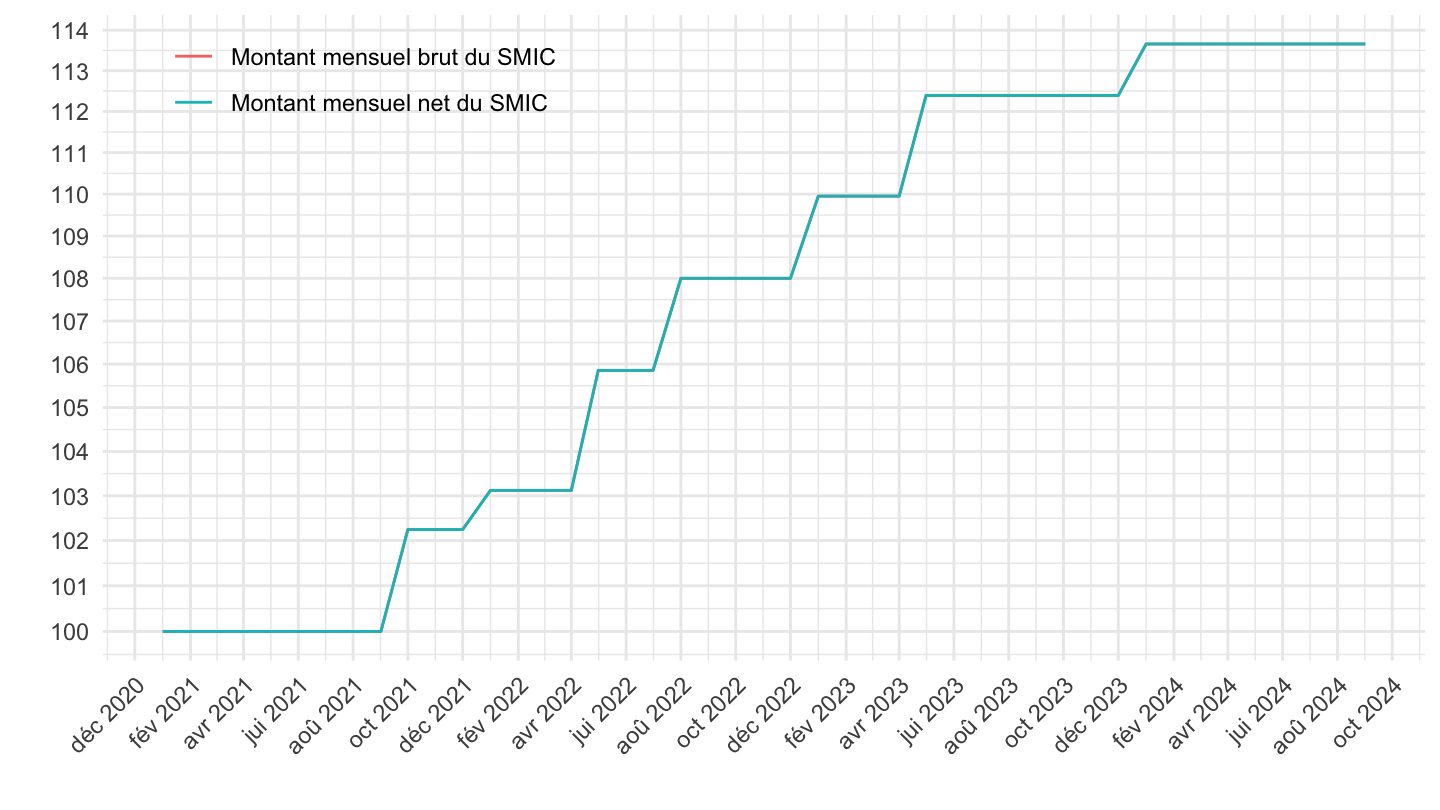
Indice
Code
`SMIC-COTISATIONS` %>%
  filter(INDICATEURS_SMIC_COTISATIONS %in% c("SMICMB-35H", "SMICMNN-35H")) %>%
  left_join(INDICATEURS_SMIC_COTISATIONS, by = "INDICATEURS_SMIC_COTISATIONS") %>%
  month_to_date %>%
  filter(date >= as.Date("2021-01-01")) %>%
  select(Indicateurs_smic_cotisations, date, OBS_VALUE) %>%
  group_by(Indicateurs_smic_cotisations) %>%
  arrange(date) %>%
  mutate(indice = 100*OBS_VALUE/OBS_VALUE[1]) %>%
  ggplot + geom_line(aes(x = date, y = indice, color = Indicateurs_smic_cotisations)) +
  theme_minimal() + xlab("") + ylab("") +
  scale_x_date(breaks = "2 months",
               labels = date_format("%b %Y")) +
  scale_y_log10(breaks = seq(0, 2000, 1)) +
  theme(legend.position = c(0.2, 0.9),
        legend.title = element_blank(),
        axis.text.x = element_text(angle = 45, vjust = 1, hjust = 1))