| source | dataset | Title | .html | .rData |
|---|---|---|---|---|
| insee | REVALORISATION-PENSIONS | IPC utilisés par la calculette de revalorisation des pensions alimentaires | 2026-07-23 | 2026-07-23 |
IPC utilisés par la calculette de revalorisation des pensions alimentaires
Données - INSEE
Info
LAST_UPDATE
Code
`REVALORISATION-PENSIONS` %>%
  group_by(LAST_UPDATE) %>%
  summarise(Nobs = n()) %>%
print_table_conditional()| LAST_UPDATE | Nobs |
|---|---|
| 1999-01-30 | 1020 |
TITLE_FR
Code
`REVALORISATION-PENSIONS` %>%
  group_by(IDBANK, TITLE_FR) %>%
  summarise(Nobs = n(),
            date1 = first(TIME_PERIOD),
            date2 = last(TIME_PERIOD)) %>%
  arrange(-Nobs) %>%
  {if (is_html_output()) datatable(., filter = 'top', rownames = F) else .}
IPC_REVALORISATION
Code
`REVALORISATION-PENSIONS` %>%
  left_join(IPC_REVALORISATION, by = "IPC_REVALORISATION") %>%
  group_by(IPC_REVALORISATION, Ipc_revalorisation) %>%
  summarise(Nobs = n()) %>%
print_table_conditional()| IPC_REVALORISATION | Ipc_revalorisation | Nobs |
|---|---|---|
| S1 | S1 | 336 |
| S2 | S2 | 336 |
| S3B | S3B | 132 |
| S4 | S4 | 216 |
TIME_PERIOD
Code
`REVALORISATION-PENSIONS` %>%
  group_by(TIME_PERIOD) %>%
  summarise(Nobs = n()) %>%
  arrange(desc(TIME_PERIOD)) %>%
  print_table_conditional()
Séries
All
Code
`REVALORISATION-PENSIONS` %>%
month_to_date %>%
left_join(IPC_REVALORISATION, by = "IPC_REVALORISATION") %>%
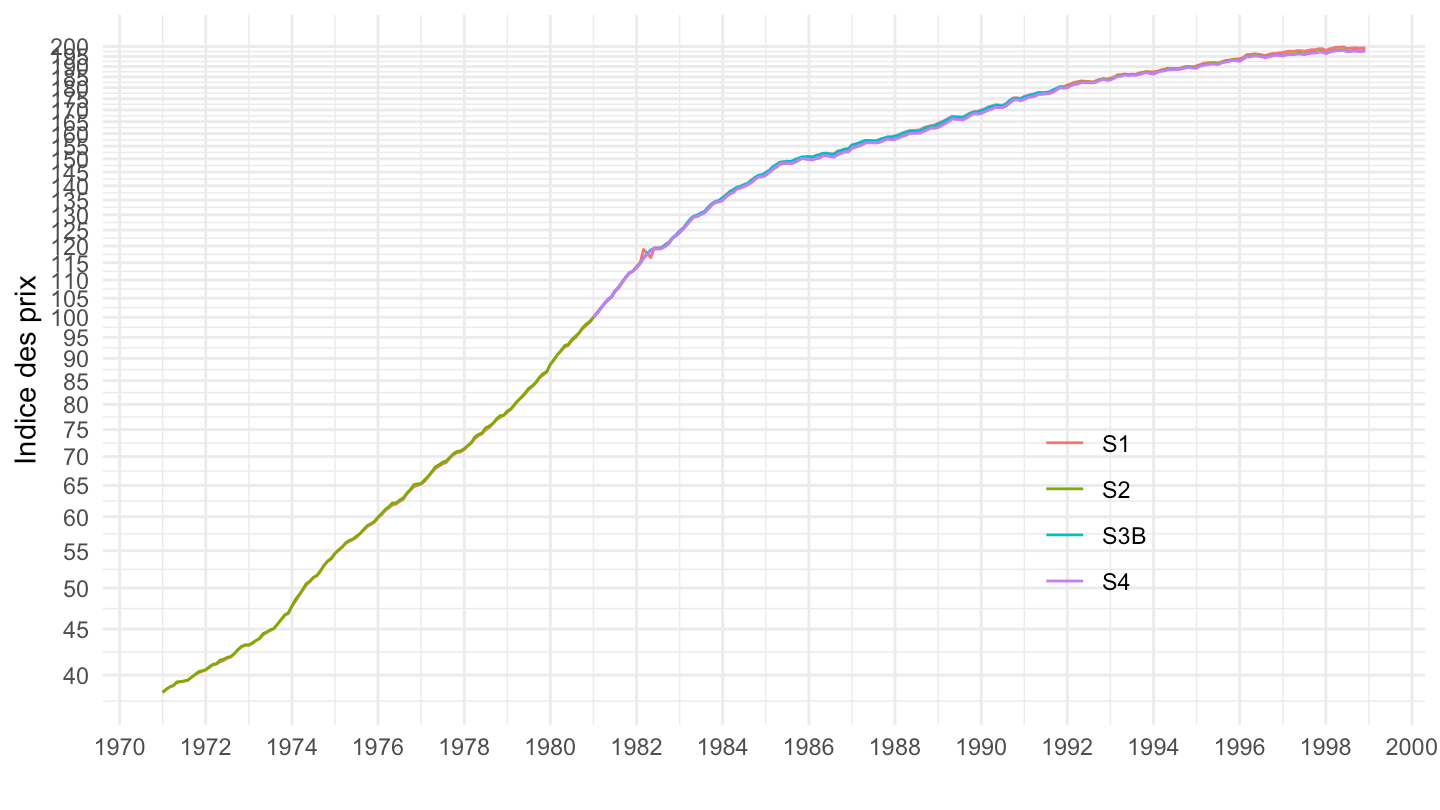
ggplot() + ylab("Indice des prix") + xlab("") + theme_minimal() +
geom_line(aes(x = date, y = OBS_VALUE, color = Ipc_revalorisation)) +
scale_x_date(breaks = seq(1920, 2100, 2) %>% paste0("-01-01") %>% as.Date,
labels = date_format("%Y")) +
theme(legend.position = c(0.75, 0.3),
legend.title = element_blank()) +
scale_y_log10(breaks = seq(0, 200, 5),
labels = dollar_format(accuracy = 1, prefix = ""))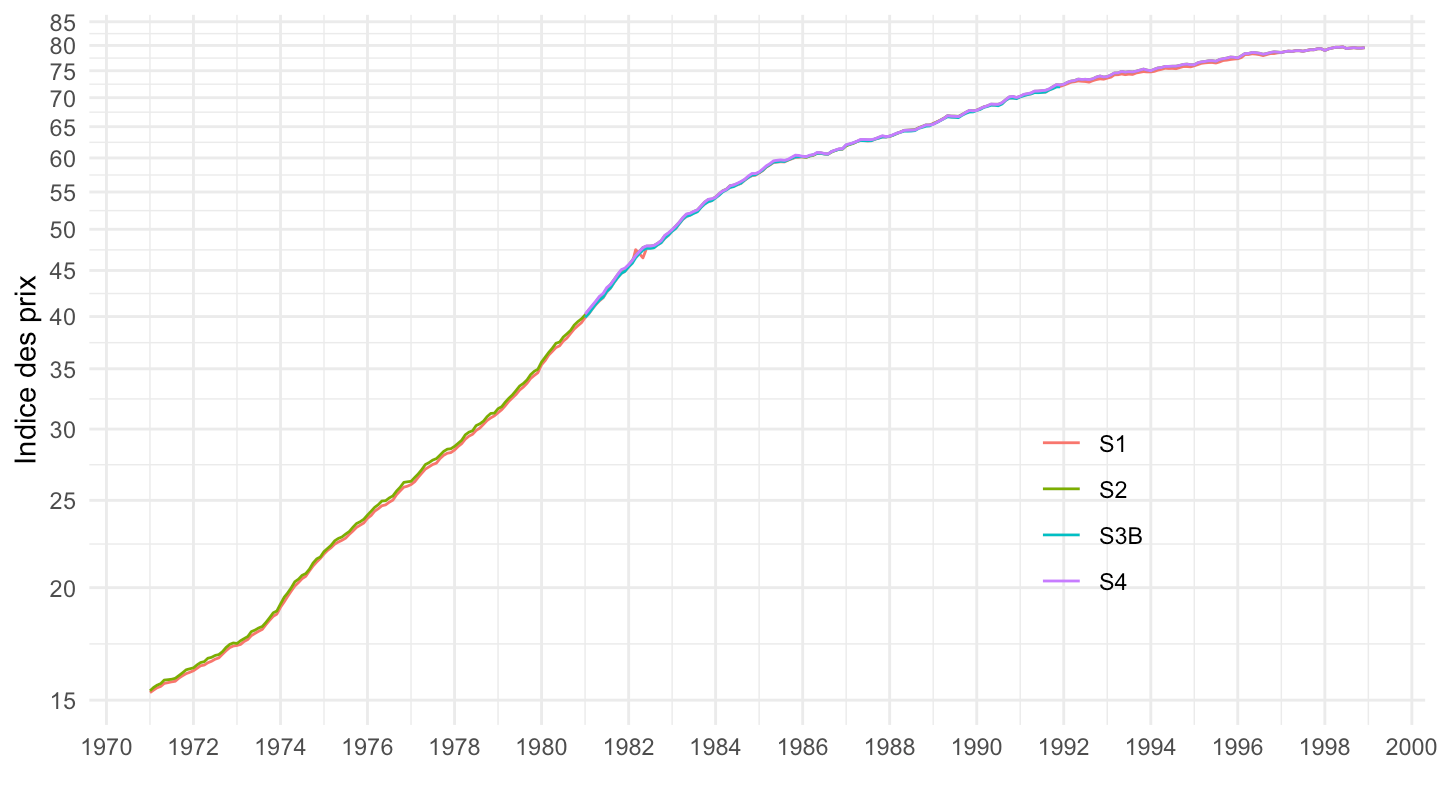
1971-
Code
`REVALORISATION-PENSIONS` %>%
  month_to_date %>%
  left_join(IPC_REVALORISATION, by = "IPC_REVALORISATION") %>%
  group_by(IPC_REVALORISATION) %>%
  arrange(date) %>%
  mutate(OBS_VALUE = 100*OBS_VALUE/OBS_VALUE[date == as.Date("1981-01-01")]) %>%
  ggplot() + ylab("Indice des prix") + xlab("") + theme_minimal() +
  geom_line(aes(x = date, y = OBS_VALUE, color = Ipc_revalorisation)) +
  scale_x_date(breaks = seq(1920, 2100, 2) %>% paste0("-01-01") %>% as.Date,
               labels = date_format("%Y")) +
  theme(legend.position = c(0.75, 0.3),
        legend.title = element_blank()) +
  scale_y_log10(breaks = seq(0, 200, 5),
                     labels = dollar_format(accuracy = 1, prefix = ""))