Main GDP aggregates per capita - nama_10_pc
Data - Eurostat
Info
Last observation: Annual: 2025 (N = 4,105)
First observation: Annual: 1975 (N = 162)
Last data update: 23 jul 2026, 22:40. Last compile: 24 jul 2026, 02:50
Structure
GDP per capita: France vs EU27
All
Code
load(here::here("data", "eurostat", "geo_fr.RData"))
nama_10_pc %>%
  filter(unit %in% c("CP_PPS_EU27_2020_HAB"),
         na_item == "B1GQ",
         geo %in% c("FR", "EU27_2020", "EA20")) %>%
  select_if(~ n_distinct(.) > 1) %>%
  group_by(time) %>%
  year_to_date() %>%

  filter(date >= as.Date("1995-01-01")) %>%
  mutate(Geo2 = ifelse(geo == "EA20", "Zone Euro à 20", Geo)) %>%
  mutate(Geo2 = ifelse(geo == "EU27_2020", "UE à 27", Geo2)) %>%
  mutate(Geo = ifelse(geo == "EA20", "Europe", Geo)) %>%
  mutate(Geo = ifelse(geo == "EU27_2020", "Europe", Geo)) %>%
  ggplot + geom_line(aes(x = date, y = values, color = Geo2, linetype = Geo2)) +
  scale_color_manual(values = c("#ED2939", "#003399", "#003399")) +
  scale_linetype_manual(values = c("solid", "solid", "dashed")) +
  geom_text_repel(data = . %>% group_by(geo) %>% filter(date == max(date)),
                  aes(x = date, y = values, color = Geo2, label = values), show.legend = F) +
  theme_minimal() + xlab("") + ylab("Current prices, purchasing power standard\n (PPS, EU27 from 2020) per capita") +
  add_3flags +
  scale_x_date(breaks = seq(1995, 2100, 5) %>% paste0("-01-01") %>% as.Date,
               labels = date_format("%Y")) +
  scale_y_log10(labels = dollar_format(pre = "", su = "€", acc = 1),
                breaks = seq(5000, 100000, 5000)) +
  theme(legend.position = c(0.3, 0.8),
        legend.title = element_blank())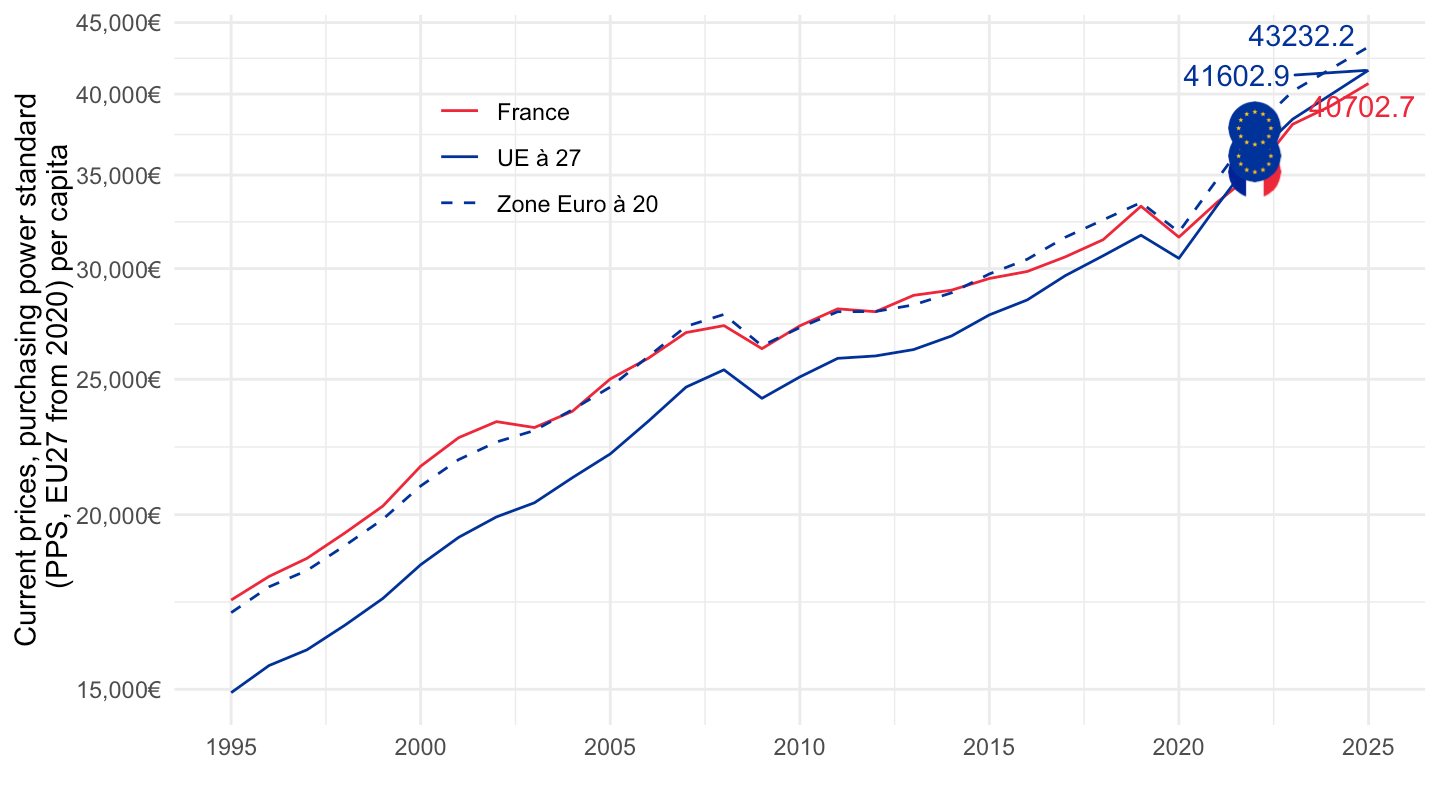
1996-
Code
load(here::here("data", "eurostat", "geo_fr.RData"))
nama_10_pc %>%
  filter(unit %in% c("CP_PPS_EU27_2020_HAB"),
         na_item == "B1GQ",
         geo %in% c("FR", "EU27_2020", "EA20")) %>%
  select_if(~ n_distinct(.) > 1) %>%
  group_by(time) %>%
  year_to_date() %>%

  filter(date >= as.Date("1996-01-01")) %>%
  mutate(Geo2 = ifelse(geo == "EA20", "Zone Euro (20 pays)", Geo)) %>%
  mutate(Geo2 = ifelse(geo == "EU27_2020", "Union Européenne (27 pays)", Geo2)) %>%
  mutate(Geo = ifelse(geo == "EA20", "Europe", Geo)) %>%
  mutate(Geo = ifelse(geo == "EU27_2020", "Europe", Geo)) %>%
  ggplot + geom_line(aes(x = date, y = values, color = Geo2, linetype = Geo2)) +
  scale_color_manual(values = c("#ED2939", "#003399", "#FFCC00")) +
  scale_linetype_manual(values = c("solid", "solid", "solid")) +
  geom_text_repel(data = . %>% group_by(geo) %>% filter(date %in% c(max(date), min(date))),
                  aes(x = date, y = values, color = Geo2, label = label_number(big.mark = " ", suffix = " €")(values)), show.legend = F) +
  theme_minimal() + xlab("") + ylab("Current prices, purchasing power standard\n (PPS, EU27 from 2020) per capita") +
  add_3flags +
  scale_x_date(breaks = seq(1996, 2100, 2) %>% paste0("-01-01") %>% as.Date,
               labels = date_format("%Y")) +
  scale_y_log10(labels = dollar_format(pre = "", su = "€", acc = 1, big.mark = " "),
                breaks = seq(10000, 100000, 2000)) +
  theme(legend.position = c(0.3, 0.8),
        legend.title = element_blank())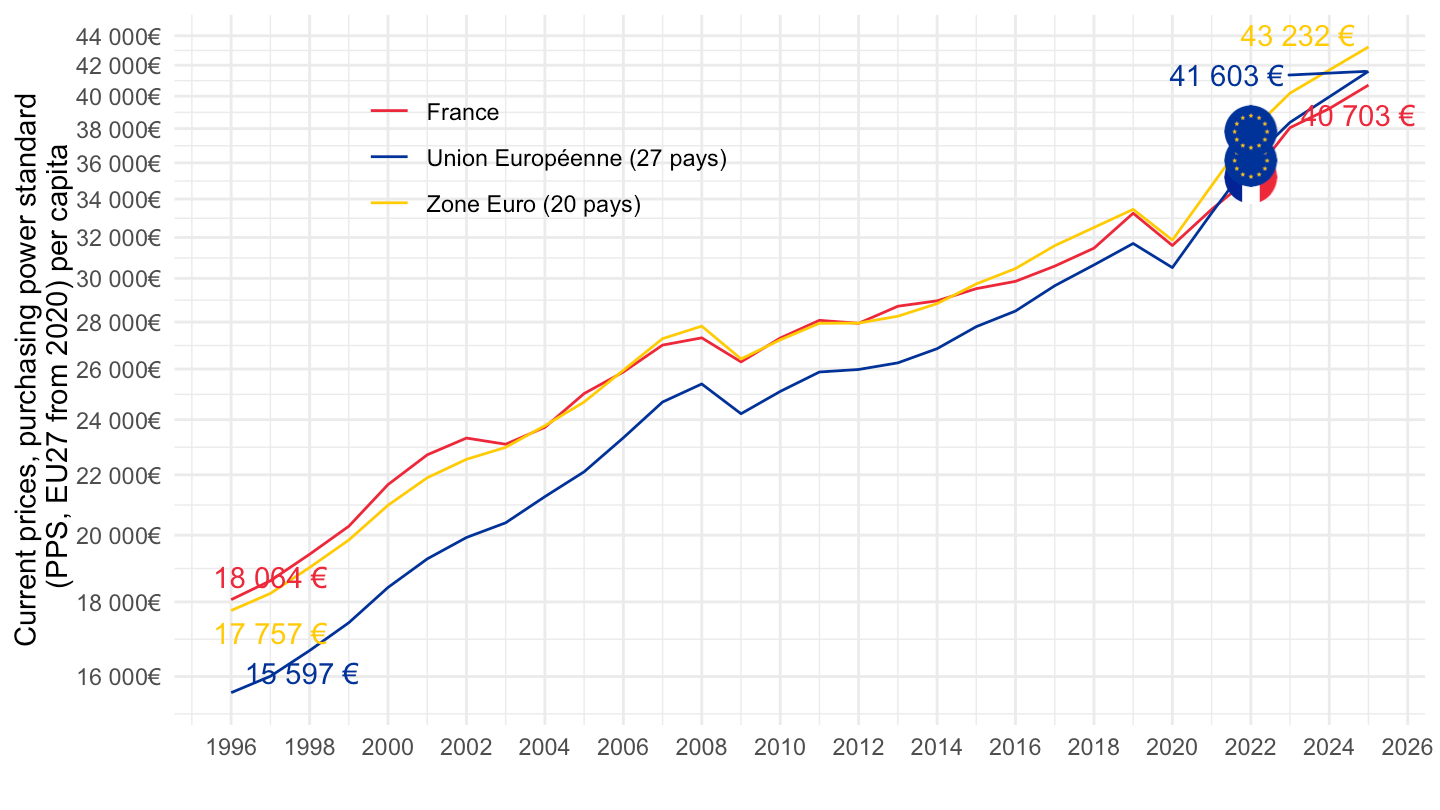
2002-
Code
load(here::here("data", "eurostat", "geo_fr.RData"))
nama_10_pc %>%
  filter(unit %in% c("CP_PPS_EU27_2020_HAB"),
         na_item == "B1GQ",
         geo %in% c("FR", "EU27_2020", "EA20")) %>%
  select_if(~ n_distinct(.) > 1) %>%
  group_by(time) %>%
  year_to_date() %>%

  filter(date >= as.Date("2002-01-01")) %>%
  mutate(Geo2 = ifelse(geo == "EA20", "Zone Euro (20 pays)", Geo)) %>%
  mutate(Geo2 = ifelse(geo == "EU27_2020", "Union Européenne (27 pays)", Geo2)) %>%
  mutate(Geo = ifelse(geo == "EA20", "Europe", Geo)) %>%
  mutate(Geo = ifelse(geo == "EU27_2020", "Europe", Geo)) %>%
  ggplot + geom_line(aes(x = date, y = values, color = Geo2, linetype = Geo2)) +
  scale_color_manual(values = c("#ED2939", "#003399", "#FFCC00")) +
  scale_linetype_manual(values = c("solid", "solid", "solid")) +
  geom_text_repel(data = . %>% group_by(geo) %>% filter(date %in% c(max(date), min(date))),
                  aes(x = date, y = values, color = Geo2, label = label_number(big.mark = " ", suffix = " €")(values)), show.legend = F) +
  theme_minimal() + xlab("") + ylab("Current prices, purchasing power standard\n (PPS, EU27 from 2020) per capita") +
  add_3flags +
  scale_x_date(breaks = seq(2002, 2100, 2) %>% paste0("-01-01") %>% as.Date,
               labels = date_format("%Y")) +
  scale_y_log10(labels = dollar_format(pre = "", su = "€", acc = 1, big.mark = " "),
                breaks = seq(10000, 100000, 2000)) +
  theme(legend.position = c(0.3, 0.8),
        legend.title = element_blank())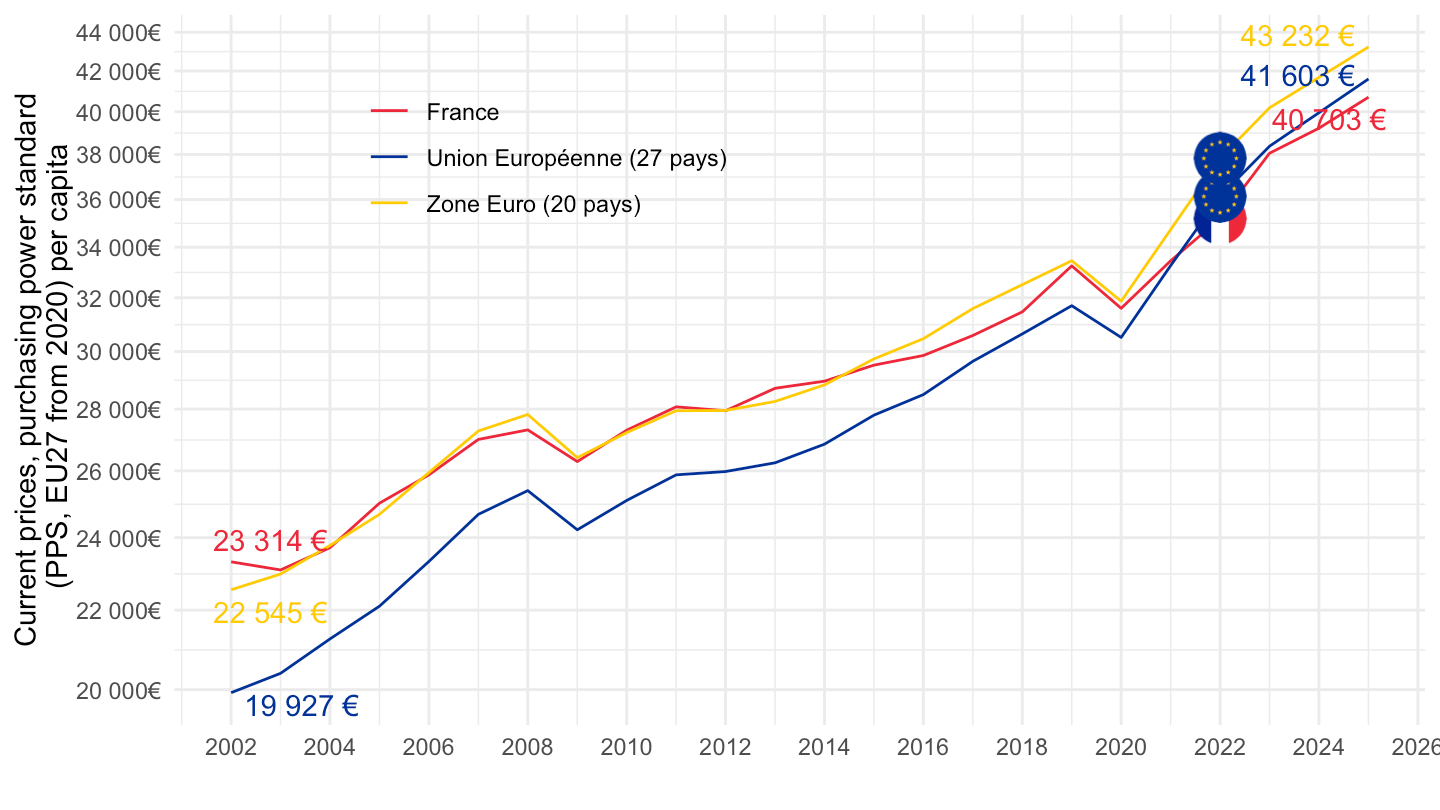
2008-
Code
load(here::here("data", "eurostat", "geo_fr.RData"))
nama_10_pc %>%
  filter(unit %in% c("CP_PPS_EU27_2020_HAB"),
         na_item == "B1GQ",
         geo %in% c("FR", "EU27_2020", "EA20")) %>%
  select_if(~ n_distinct(.) > 1) %>%
  group_by(time) %>%
  year_to_date() %>%

  filter(date >= as.Date("2008-01-01")) %>%
  mutate(Geo2 = ifelse(geo == "EA20", "Zone Euro à 20", Geo)) %>%
  mutate(Geo2 = ifelse(geo == "EU27_2020", "Union Européenne à 27", Geo2)) %>%
  mutate(Geo = ifelse(geo == "EA20", "Europe", Geo)) %>%
  mutate(Geo = ifelse(geo == "EU27_2020", "Europe", Geo)) %>%
  ggplot + geom_line(aes(x = date, y = values, color = Geo2, linetype = Geo2)) +
  scale_color_manual(values = c("#ED2939", "#003399", "#FFCC00")) +
  scale_linetype_manual(values = c("solid", "solid", "solid")) +
  geom_text_repel(data = . %>% group_by(geo) %>% filter(date %in% c(max(date), min(date))),
                  aes(x = date, y = values, color = Geo2, label = label_number(big.mark = " ", suffix = " €")(values)), show.legend = F) +
  theme_minimal() + xlab("") + ylab("Current prices, purchasing power standard\n (PPS, EU27 from 2020) per capita") +
  add_3flags +
  scale_x_date(breaks = seq(1995, 2100, 1) %>% paste0("-01-01") %>% as.Date,
               labels = date_format("%Y")) +
  scale_y_log10(labels = dollar_format(pre = "", su = "€", acc = 1, big.mark = " "),
                breaks = seq(10000, 100000, 2000)) +
  theme(legend.position = c(0.3, 0.8),
        legend.title = element_blank())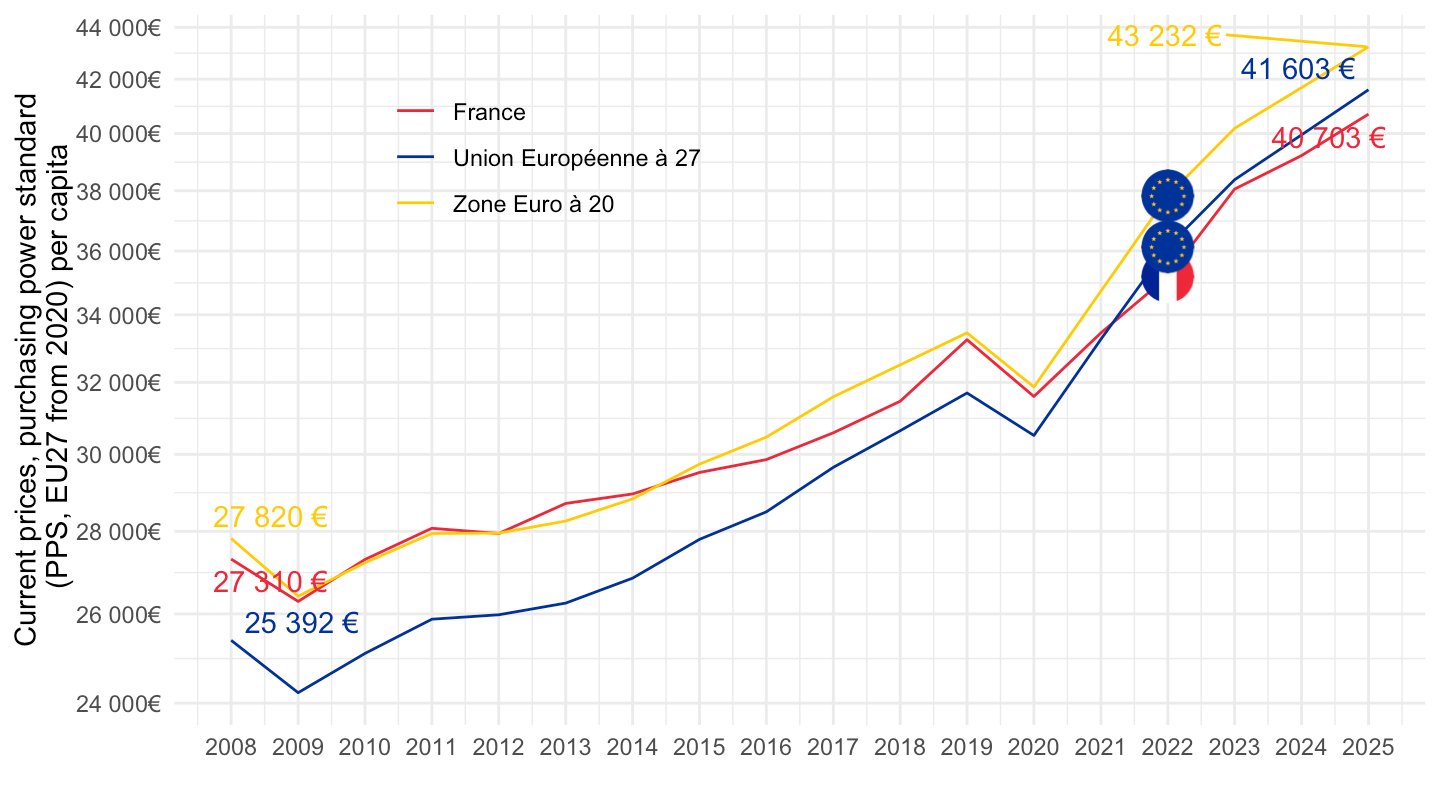
2008-
Code
load(here::here("data", "eurostat", "geo_fr.RData"))
nama_10_pc %>%
  filter(unit %in% c("CP_PPS_EU27_2020_HAB"),
         na_item == "B1GQ",
         geo %in% c("FR", "EU27_2020", "EA20")) %>%
  select_if(~ n_distinct(.) > 1) %>%
  group_by(time) %>%
  year_to_date() %>%

  filter(date >= as.Date("2017-01-01")) %>%
  mutate(Geo2 = ifelse(geo == "EA20", "Zone Euro à 20", Geo)) %>%
  mutate(Geo2 = ifelse(geo == "EU27_2020", "Union Européenne à 27", Geo2)) %>%
  mutate(Geo = ifelse(geo == "EA20", "Europe", Geo)) %>%
  mutate(Geo = ifelse(geo == "EU27_2020", "Europe", Geo)) %>%
  ggplot + geom_line(aes(x = date, y = values, color = Geo2, linetype = Geo2)) +
  scale_color_manual(values = c("#ED2939", "#003399", "#FFCC00")) +
  scale_linetype_manual(values = c("solid", "solid", "solid")) +
  geom_text_repel(data = . %>% group_by(geo) %>% filter(date %in% c(max(date), min(date))),
                  aes(x = date, y = values, color = Geo2, label = label_number(big.mark = " ", suffix = " €")(values)), show.legend = F) +
  theme_minimal() + xlab("") + ylab("Current prices, purchasing power standard\n (PPS, EU27 from 2020) per capita") +
  add_3flags +
  scale_x_date(breaks = seq(1995, 2100, 1) %>% paste0("-01-01") %>% as.Date,
               labels = date_format("%Y")) +
  scale_y_log10(labels = dollar_format(pre = "", su = "€", acc = 1, big.mark = " "),
                breaks = seq(10000, 100000, 2000)) +
  theme(legend.position = c(0.3, 0.8),
        legend.title = element_blank())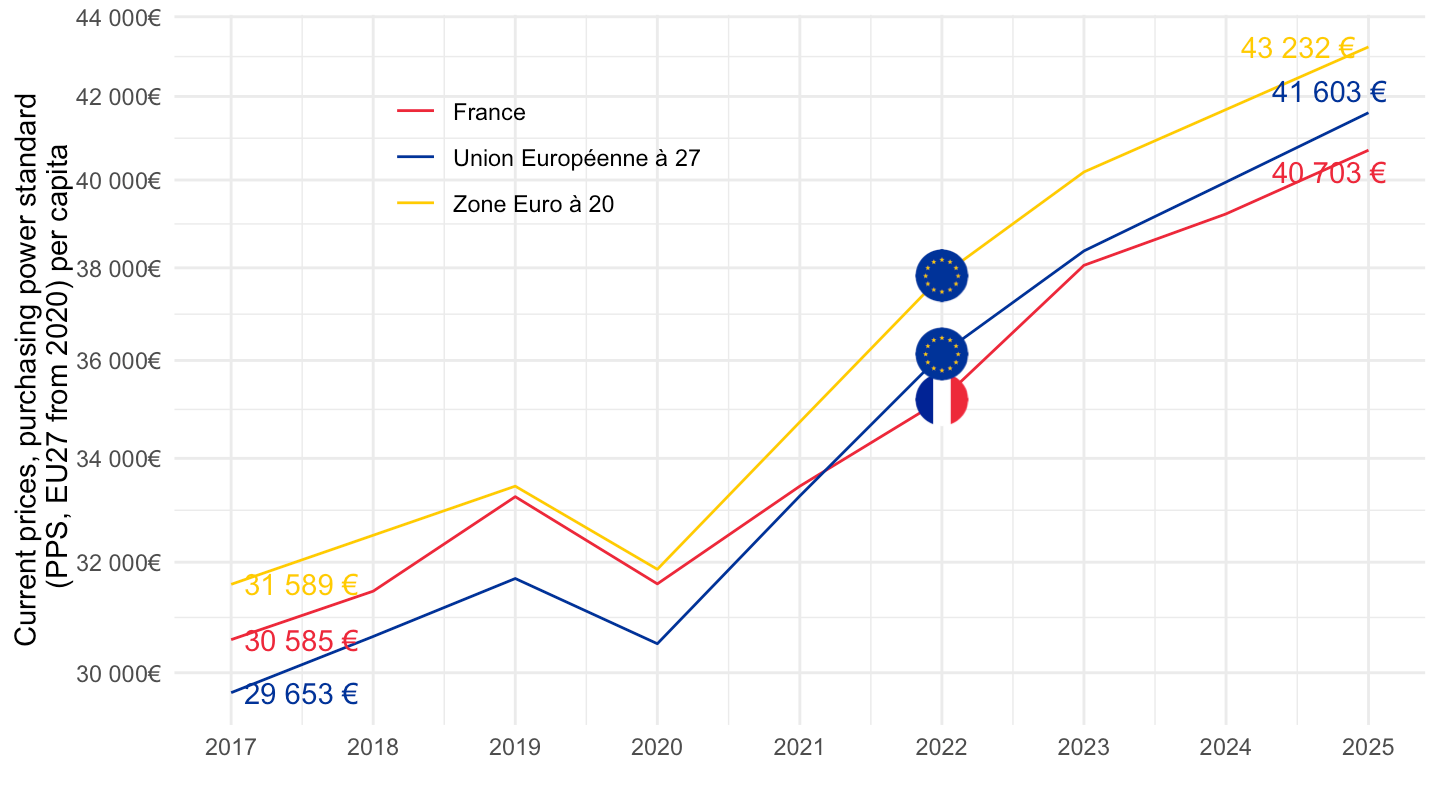
GDP Per capita: Italy vs. France
In Euros
Code
load(here::here("data", "eurostat", "geo.RData"))
nama_10_pc %>%
  filter(unit == "CP_EUR_HAB",
         na_item == "B1GQ",
         geo %in% c("FR", "IT", "DE")) %>%
  select_if(~ n_distinct(.) > 1) %>%
  group_by(time) %>%
  year_to_date() %>%
  filter(date >= as.Date("1995-01-01")) %>%
  ggplot + geom_line(aes(x = date, y = values, color = geo)) +
  geom_text_repel(data = . %>% group_by(geo) %>% filter(date == max(date)),
                  aes(x = date, y = values, color = geo, label = geo)) +
  theme_minimal() + xlab("") + ylab("") +
  scale_x_date(breaks = seq(1995, 2100, 5) %>% paste0("-01-01") %>% as.Date,
               labels = date_format("%Y")) +
  scale_y_log10()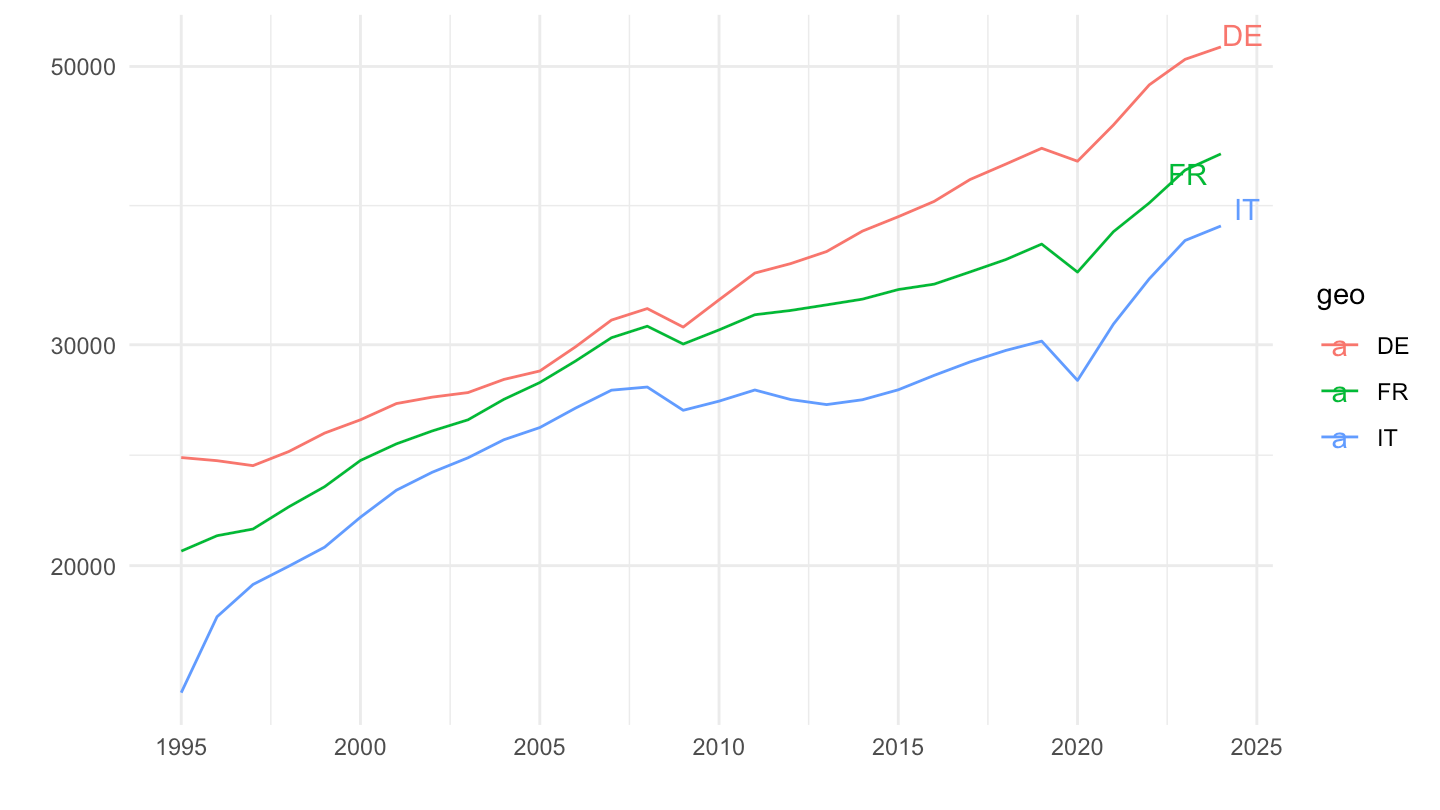
In Euros and Volume 10
Code
nama_10_pc %>%
  filter(unit %in% c("CLV10_EUR_HAB", "CP_EUR_HAB"),
         na_item == "B1GQ",
         geo %in% c("FR", "IT", "DE")) %>%
  select_if(~ n_distinct(.) > 1) %>%
  group_by(time) %>%
  year_to_date() %>%
  filter(date >= as.Date("1995-01-01")) %>%
  ggplot + geom_line(aes(x = date, y = values, color = geo, linetype = unit)) +
  geom_text_repel(data = . %>% group_by(geo) %>% filter(date == max(date)),
                  aes(x = date, y = values, color = geo, label = geo)) +
  theme_minimal() + xlab("") + ylab("") +
  scale_x_date(breaks = seq(1995, 2100, 5) %>% paste0("-01-01") %>% as.Date,
               labels = date_format("%Y")) +
  scale_y_log10()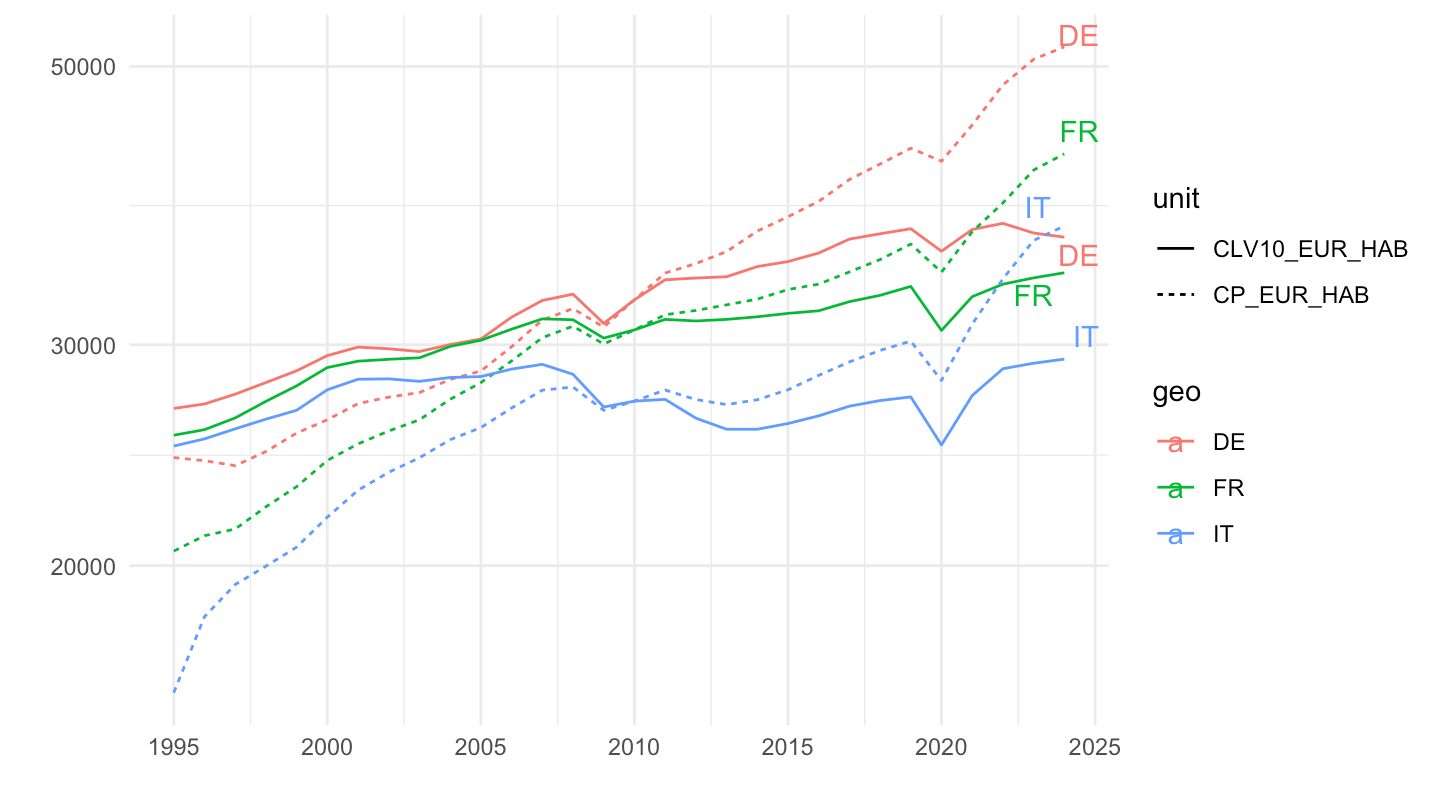
In Euros and Volume 20
Code
nama_10_pc %>%
  filter(unit %in% c("CLV20_EUR_HAB", "CP_EUR_HAB"),
         na_item == "B1GQ",
         geo %in% c("FR", "IT", "DE")) %>%
  select_if(~ n_distinct(.) > 1) %>%
  group_by(time) %>%
  year_to_date() %>%
  filter(date >= as.Date("1995-01-01")) %>%
  ggplot + geom_line(aes(x = date, y = values, color = geo, linetype = unit)) +
  geom_text_repel(data = . %>% group_by(geo) %>% filter(date == max(date)),
                  aes(x = date, y = values, color = geo, label = geo)) +
  theme_minimal() + xlab("") + ylab("") +
  scale_x_date(breaks = seq(1995, 2100, 5) %>% paste0("-01-01") %>% as.Date,
               labels = date_format("%Y")) +
  scale_y_log10()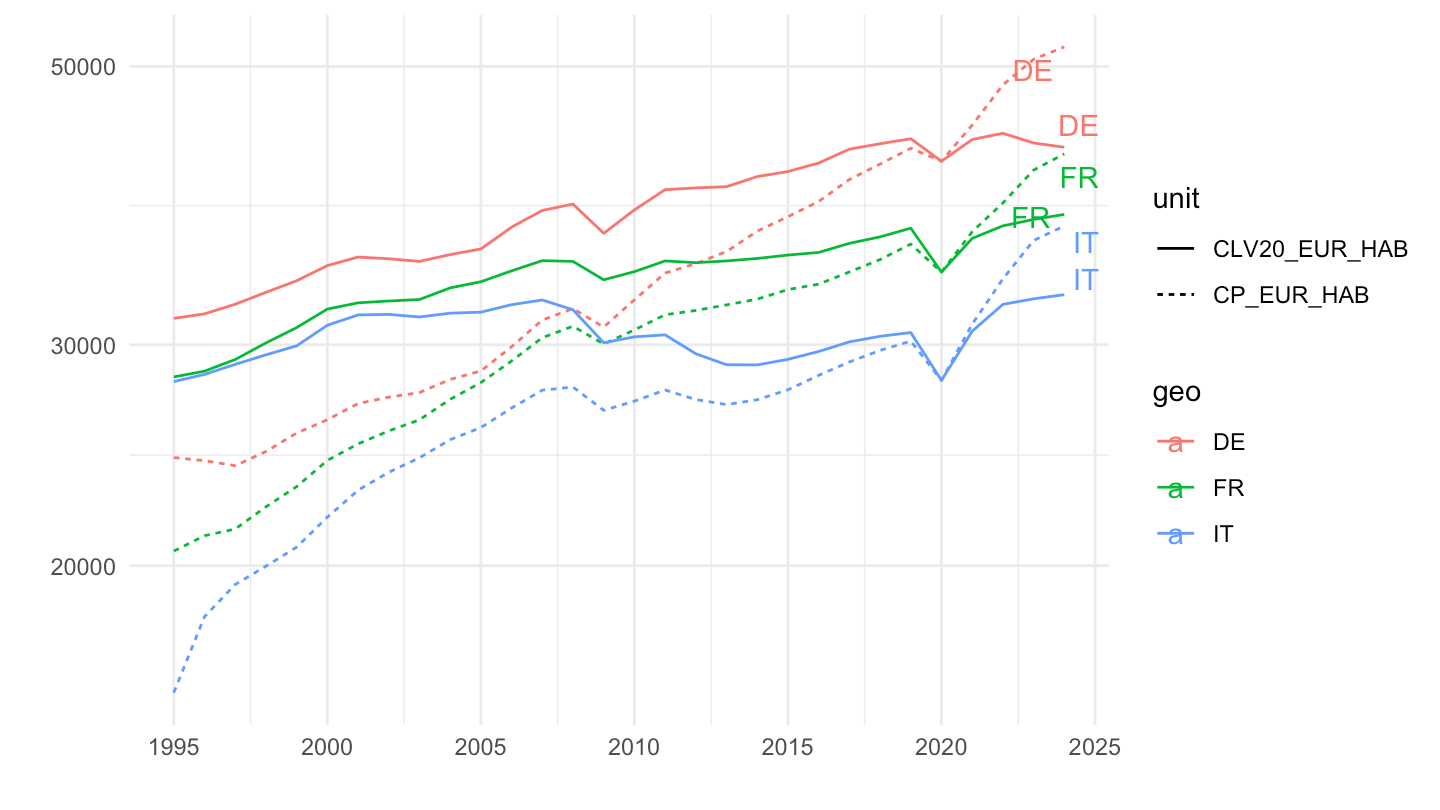
In Euros and PPS
All
Code
nama_10_pc %>%
  filter(unit %in% c("CP_PPS_EU27_2020_HAB", "CP_EUR_HAB"),
         na_item == "B1GQ",
         geo %in% c("FR", "IT", "DE")) %>%
  select_if(~ n_distinct(.) > 1) %>%
  group_by(time) %>%
  year_to_date() %>%
  filter(date >= as.Date("1995-01-01")) %>%
  ggplot + geom_line(aes(x = date, y = values, color = geo, linetype = unit)) +
  geom_text_repel(data = . %>% group_by(geo) %>% filter(date == max(date)),
                  aes(x = date, y = values, color = geo, label = geo)) +
  theme_minimal() + xlab("") + ylab("") +
  scale_x_date(breaks = seq(1995, 2100, 5) %>% paste0("-01-01") %>% as.Date,
               labels = date_format("%Y")) +
  scale_y_log10()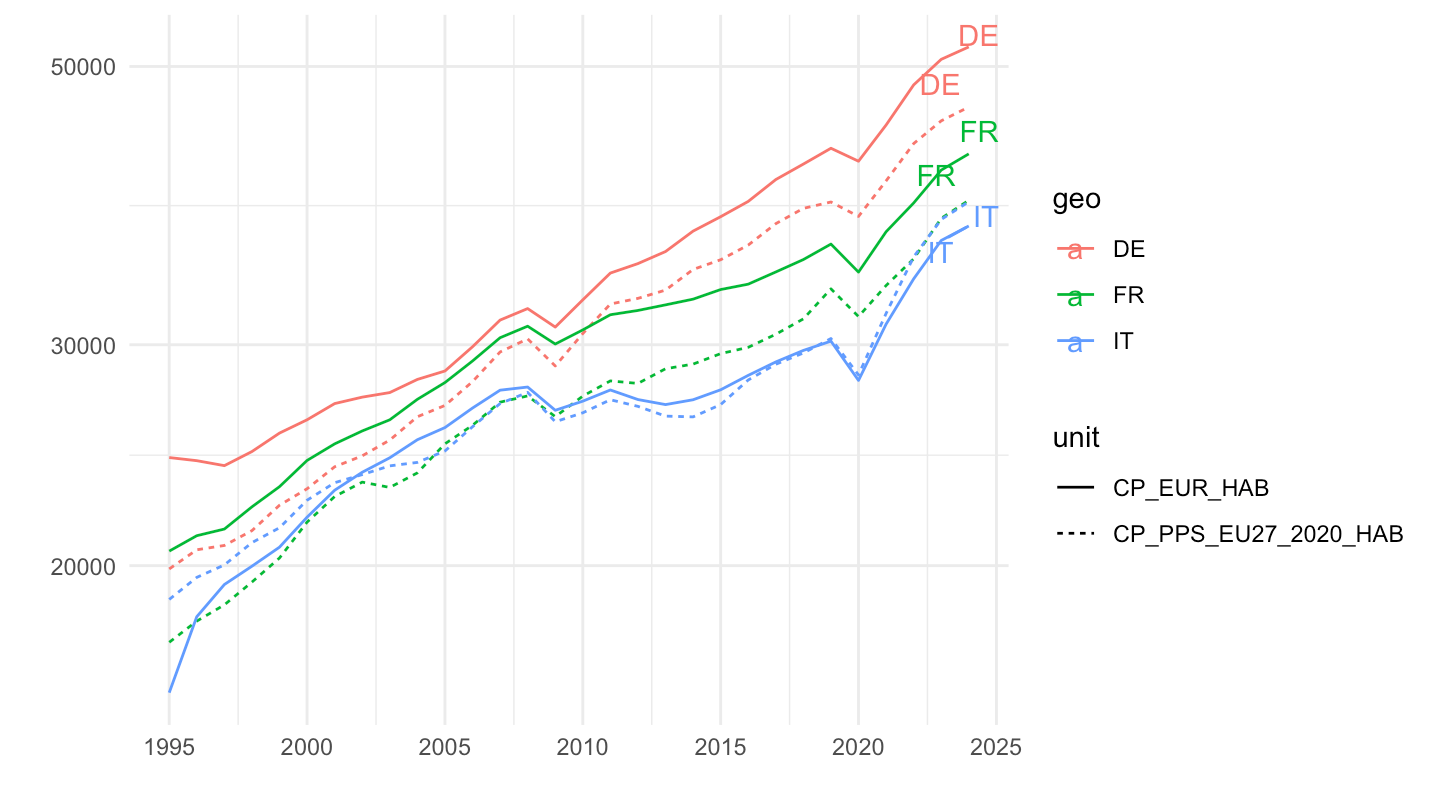
2017-
Code
nama_10_pc %>%
  filter(unit %in% c("CP_PPS_EU27_2020_HAB", "CP_EUR_HAB"),
         na_item == "B1GQ",
         geo %in% c("FR", "IT", "DE")) %>%
  select_if(~ n_distinct(.) > 1) %>%
  group_by(time) %>%
  year_to_date() %>%
  filter(date >= as.Date("2017-01-01")) %>%
  ggplot + geom_line(aes(x = date, y = values, color = geo, linetype = unit)) +
  geom_text_repel(data = . %>% group_by(geo) %>% filter(date == max(date)),
                  aes(x = date, y = values, color = geo, label = geo)) +
  theme_minimal() + xlab("") + ylab("") +
  scale_x_date(breaks = seq(1995, 2100, 1) %>% paste0("-01-01") %>% as.Date,
               labels = date_format("%Y")) +
  scale_y_log10()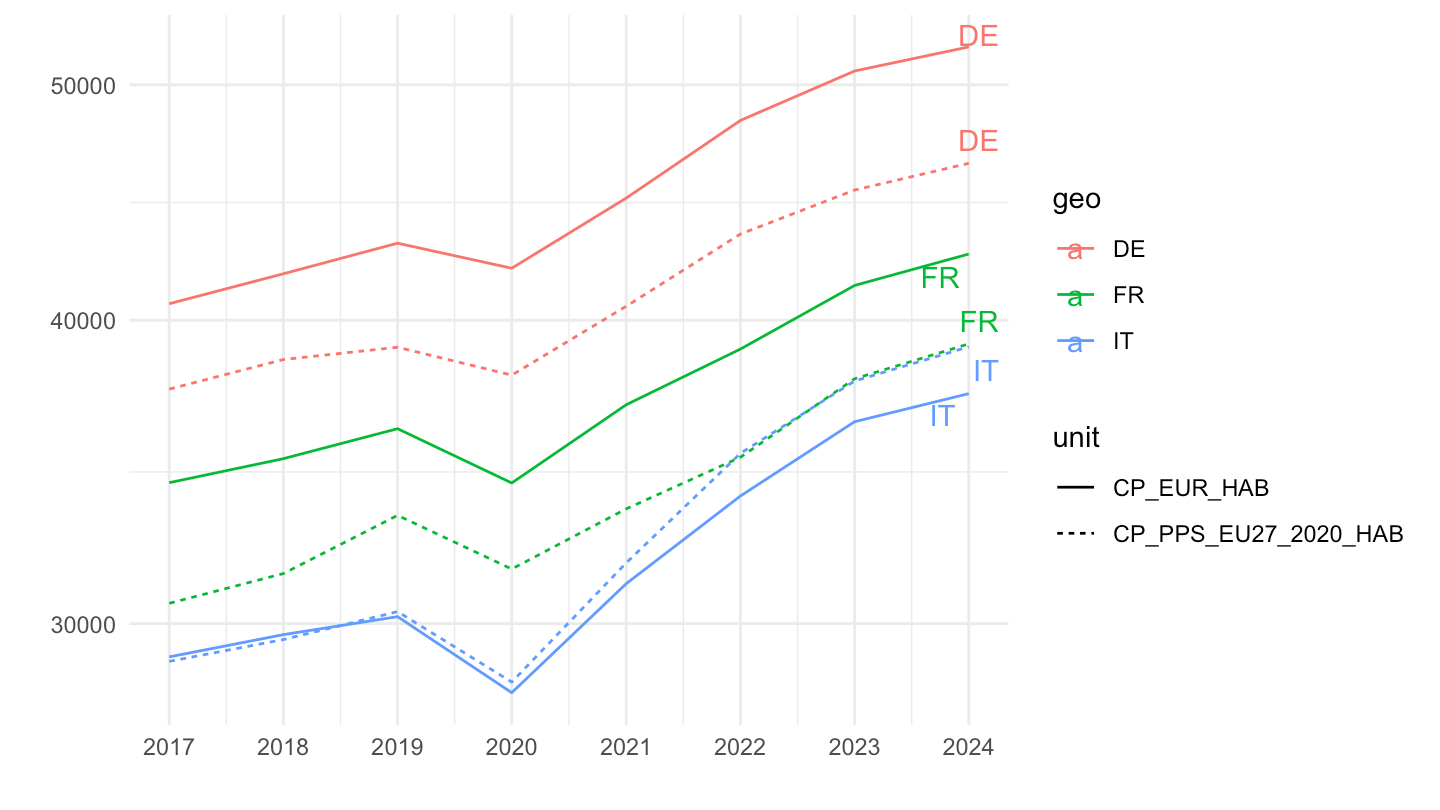
In Base 2010
Code
nama_10_pc %>%
  filter(unit == "CLV10_EUR_HAB",
         na_item == "B1GQ",
         geo %in% c("FR", "IT", "DE")) %>%
  select_if(~ n_distinct(.) > 1) %>%
  group_by(time) %>%
  year_to_date() %>%
  filter(date >= as.Date("1995-01-01")) %>%
  ggplot + geom_line(aes(x = date, y = values, color = geo)) +
  geom_text_repel(data = . %>% group_by(geo) %>% filter(date == max(date)),
                  aes(x = date, y = values, color = geo, label = geo)) +
  theme_minimal() + xlab("") + ylab("") +
  scale_x_date(breaks = seq(1995, 2100, 5) %>% paste0("-01-01") %>% as.Date,
               labels = date_format("%Y")) +
  scale_y_log10()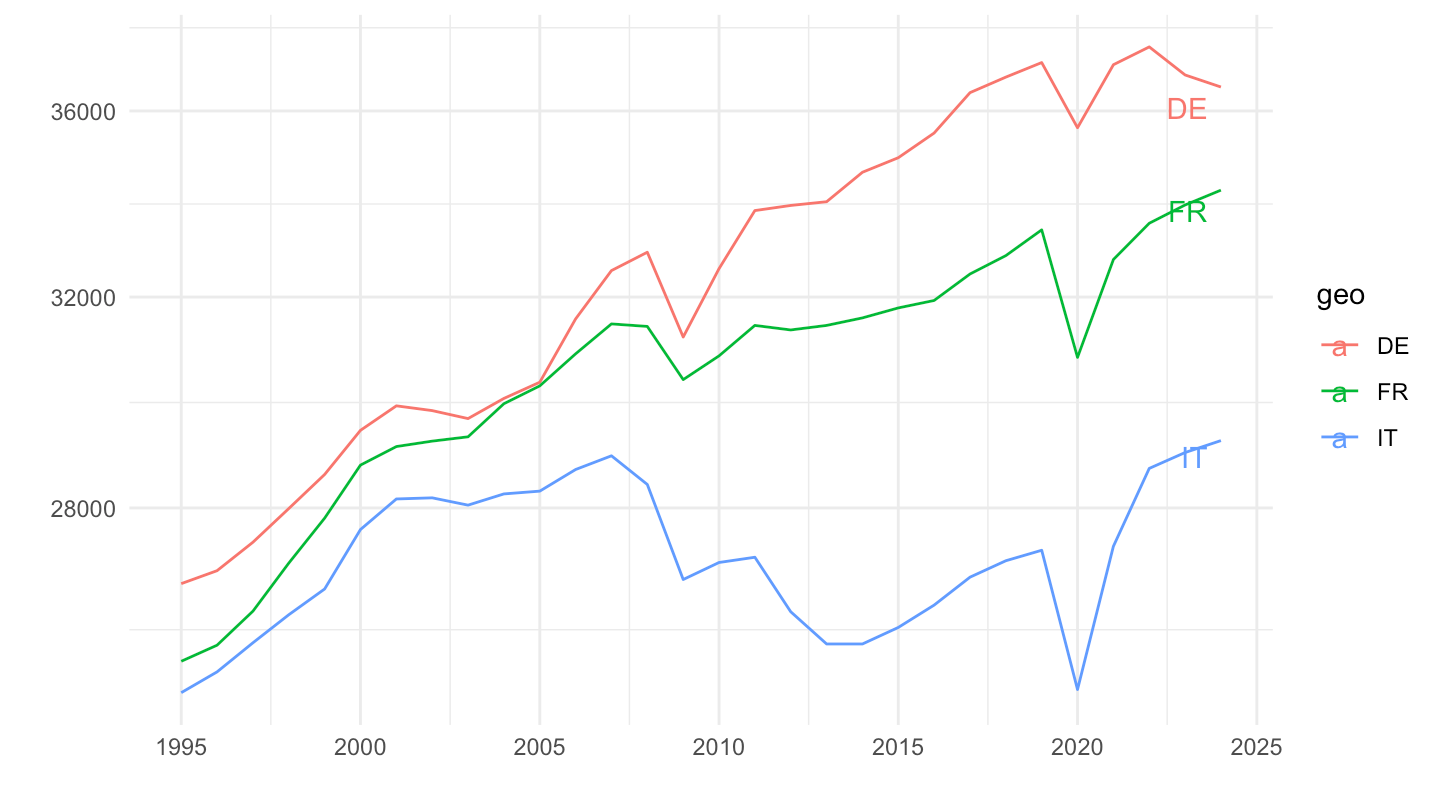
In Base 2015
Code
nama_10_pc %>%
  filter(unit == "CLV15_EUR_HAB",
         na_item == "B1GQ",
         geo %in% c("FR", "IT", "DE")) %>%
  select_if(~ n_distinct(.) > 1) %>%
  group_by(time) %>%
  year_to_date() %>%
  filter(date >= as.Date("1995-01-01")) %>%
  ggplot + geom_line(aes(x = date, y = values, color = geo)) +
  geom_text_repel(data = . %>% group_by(geo) %>% filter(date == max(date)),
                  aes(x = date, y = values, color = geo, label = geo)) +
  theme_minimal() + xlab("") + ylab("") +
  scale_x_date(breaks = seq(1995, 2100, 5) %>% paste0("-01-01") %>% as.Date,
               labels = date_format("%Y")) +
  scale_y_log10()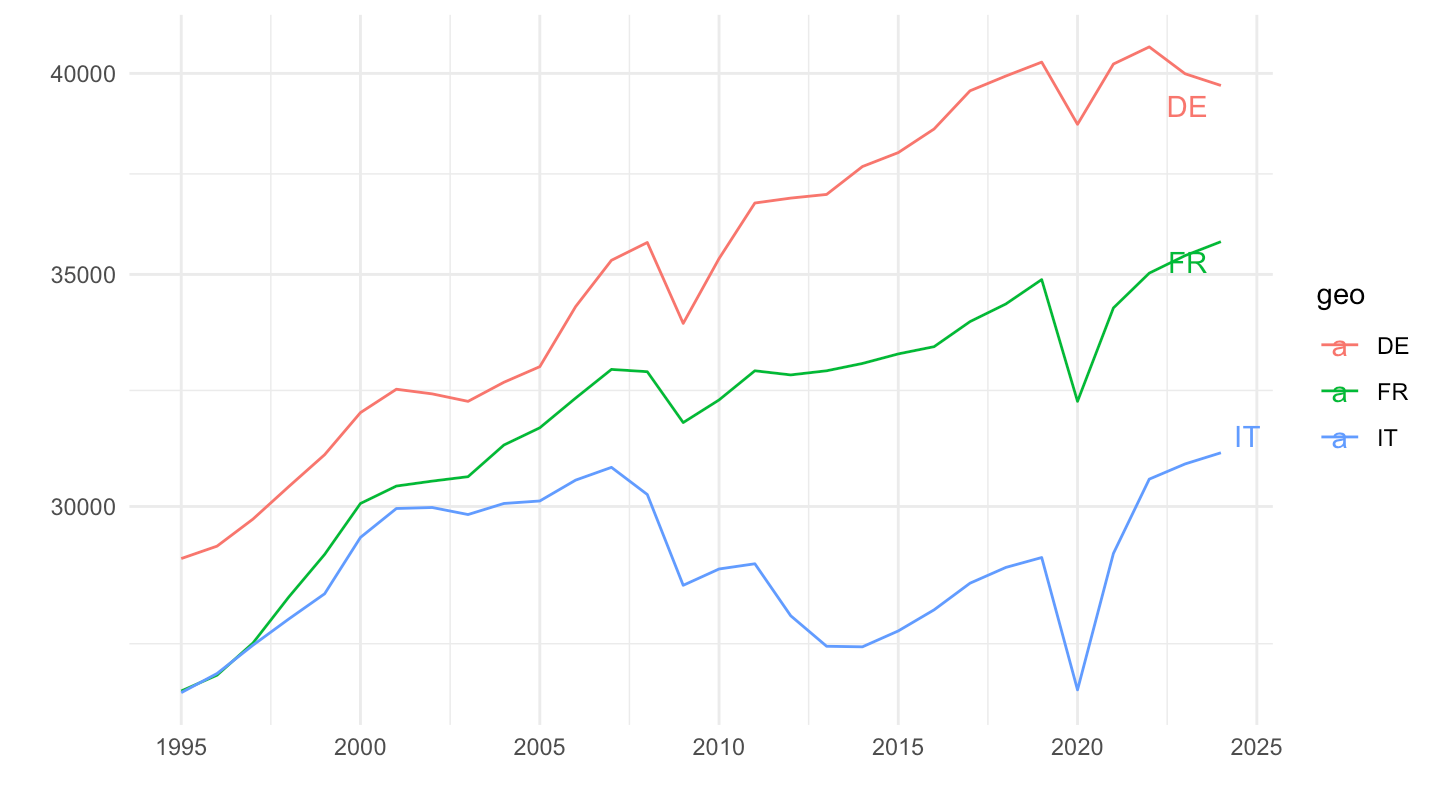
In Base 2020
Code
nama_10_pc %>%
  filter(unit == "CLV20_EUR_HAB",
         na_item == "B1GQ",
         geo %in% c("FR", "IT", "DE")) %>%
  select_if(~ n_distinct(.) > 1) %>%
  group_by(time) %>%
  year_to_date() %>%
  filter(date >= as.Date("1995-01-01")) %>%
  ggplot + geom_line(aes(x = date, y = values, color = geo)) +
  geom_text_repel(data = . %>% group_by(geo) %>% filter(date == max(date)),
                  aes(x = date, y = values, color = geo, label = geo)) +
  theme_minimal() + xlab("") + ylab("") +
  scale_x_date(breaks = seq(1995, 2100, 5) %>% paste0("-01-01") %>% as.Date,
               labels = date_format("%Y")) +
  scale_y_log10()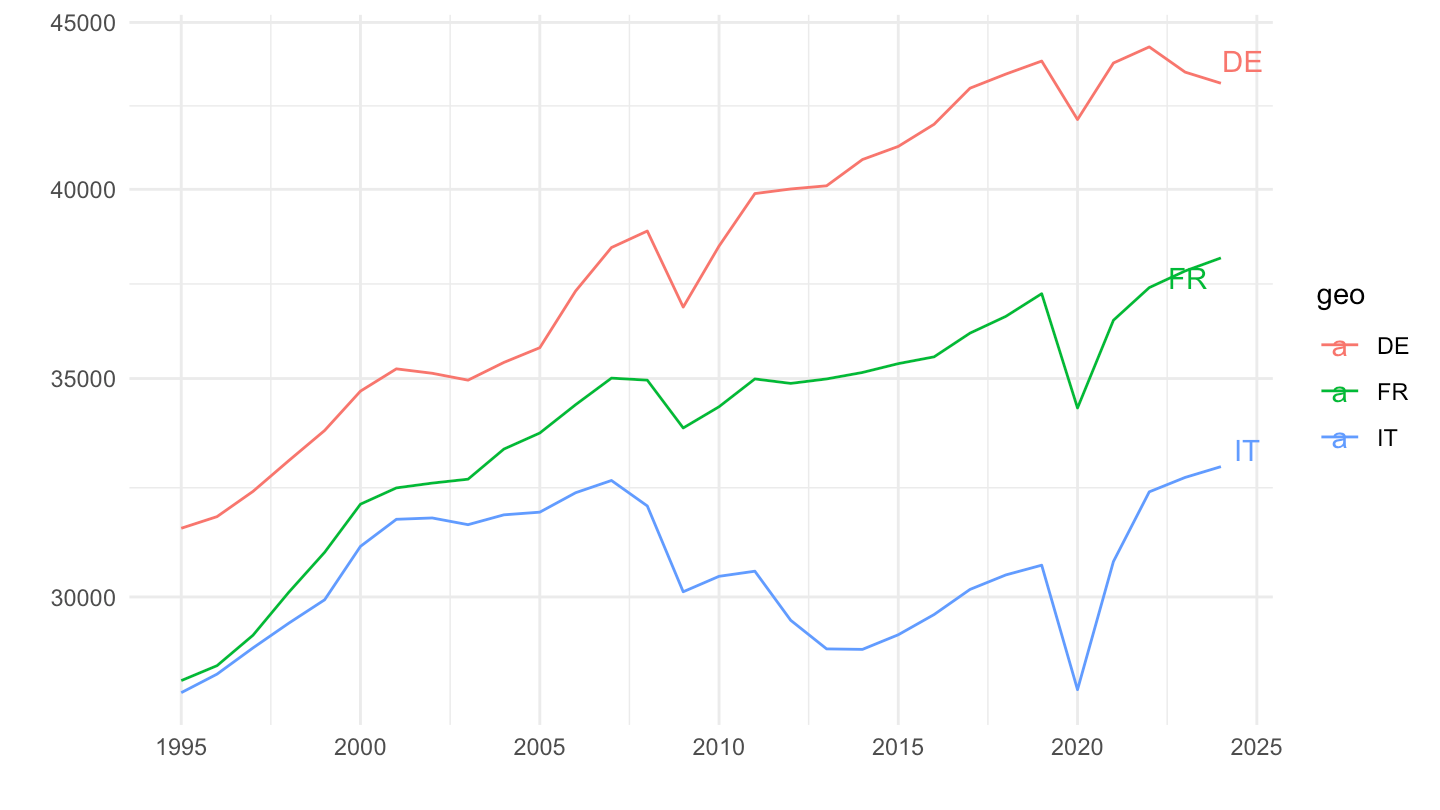
Range
Not Luxembourg
Code
nama_10_pc %>%
  filter(unit == "CP_PPS_EU27_2020_HAB",
         na_item == "B1GQ") %>%
  select_if(~ n_distinct(.) > 1) %>%
  group_by(time) %>%
  mutate(values = 100*values/values[geo == "EU27_2020"]) %>%
  year_to_date() %>%
  ggplot + geom_line(aes(x = date, y = values, color = geo)) +
  geom_text_repel(data = . %>% group_by(geo) %>% filter(date == max(date)),
                  aes(x = date, y = values, color = geo, label = geo))
Not Luxembourg
Code
nama_10_pc %>%
  filter(unit == "CP_PPS_EU27_2020_HAB",
         na_item == "B1GQ",
         !(geo %in% c("LU", "EA19"))) %>%
  select_if(~ n_distinct(.) > 1) %>%
  group_by(time) %>%
  mutate(values = 100*values/values[geo == "EU27_2020"]) %>%
  year_to_date() %>%
  ggplot + geom_line(aes(x = date, y = values, color = geo)) +
  geom_text_repel(data = . %>% group_by(geo) %>% filter(date == max(date)),
                  aes(x = date, y = values, color = geo, label = geo))
Main EU
Code
nama_10_pc %>%
  filter(unit == "CP_PPS_EU27_2020_HAB",
         na_item == "B1GQ",
         (geo %in% c("PL", "EU27_2020", "FR", "HU", "DE", "EL", "IT"))) %>%
  select_if(~ n_distinct(.) > 1) %>%
  group_by(time) %>%
  mutate(values = 100*values/values[geo == "EU27_2020"]) %>%
  year_to_date() %>%

  mutate(Geo = ifelse(geo == "EU27_2020", "Europe", Geo)) %>%
  left_join(colors, by = c("Geo" = "country")) %>%
  ggplot(.) + theme_minimal() + scale_color_identity() +
  geom_line(aes(x = date, y = values, color = color)) +
  xlab("") + ylab("") + add_7flags +
  scale_x_date(breaks = seq(1940, 2100, 2) %>% paste0("-01-01") %>% as.Date,
               labels = date_format("%Y")) +
  scale_y_log10(breaks = seq(10, 200, 10)) +
  geom_text_repel(data = . %>% group_by(geo) %>% filter(date == max(date)),
                  aes(x = date, y = values, color = color, label = Geo)) +
  theme_minimal()
Greece
Code
list_geos_EL <- nama_10_pc %>%
  filter(unit == "CP_PPS_EU27_2020_HAB",
         na_item == "B1GQ",
         time == 1995) %>%
  filter(values < values[geo == "EL"]) %>%
  pull(geo)
nama_10_pc %>%
  filter(unit == "CP_PPS_EU27_2020_HAB",
         na_item == "B1GQ",
         (geo %in% c("EL", "EU27_2020", list_geos_EL))) %>%
  select_if(~ n_distinct(.) > 1) %>%
  group_by(time) %>%
  mutate(values = 100*values/values[geo == "EU27_2020"]) %>%
  year_to_date() %>%

  mutate(Geo = ifelse(geo == "EU27_2020", "Europe", Geo)) %>%
  left_join(colors, by = c("Geo" = "country")) %>%
  filter(geo != "EU27_2020") %>%
  ggplot(.) + theme_minimal() + scale_color_identity() +
  geom_line(aes(x = date, y = values, color = color)) +
  geom_line(data = . %>% filter(geo == "EL"), aes(x = date, y = values, color = color), size = 1.5) +
  xlab("") + ylab("PPP GDP per capita vs. EU27_2020") + add_8flags +
  scale_x_date(breaks = seq(1995, 2100, 2) %>% paste0("-01-01") %>% as.Date,
               labels = date_format("%Y")) +
  scale_y_log10(breaks = seq(10, 200, 10)) +
  geom_text_repel(data = . %>% group_by(geo) %>% filter(date %in% c(max(date), min(date))),
                  aes(x = date, y = values, color = color, label = Geo)) +
  theme_minimal()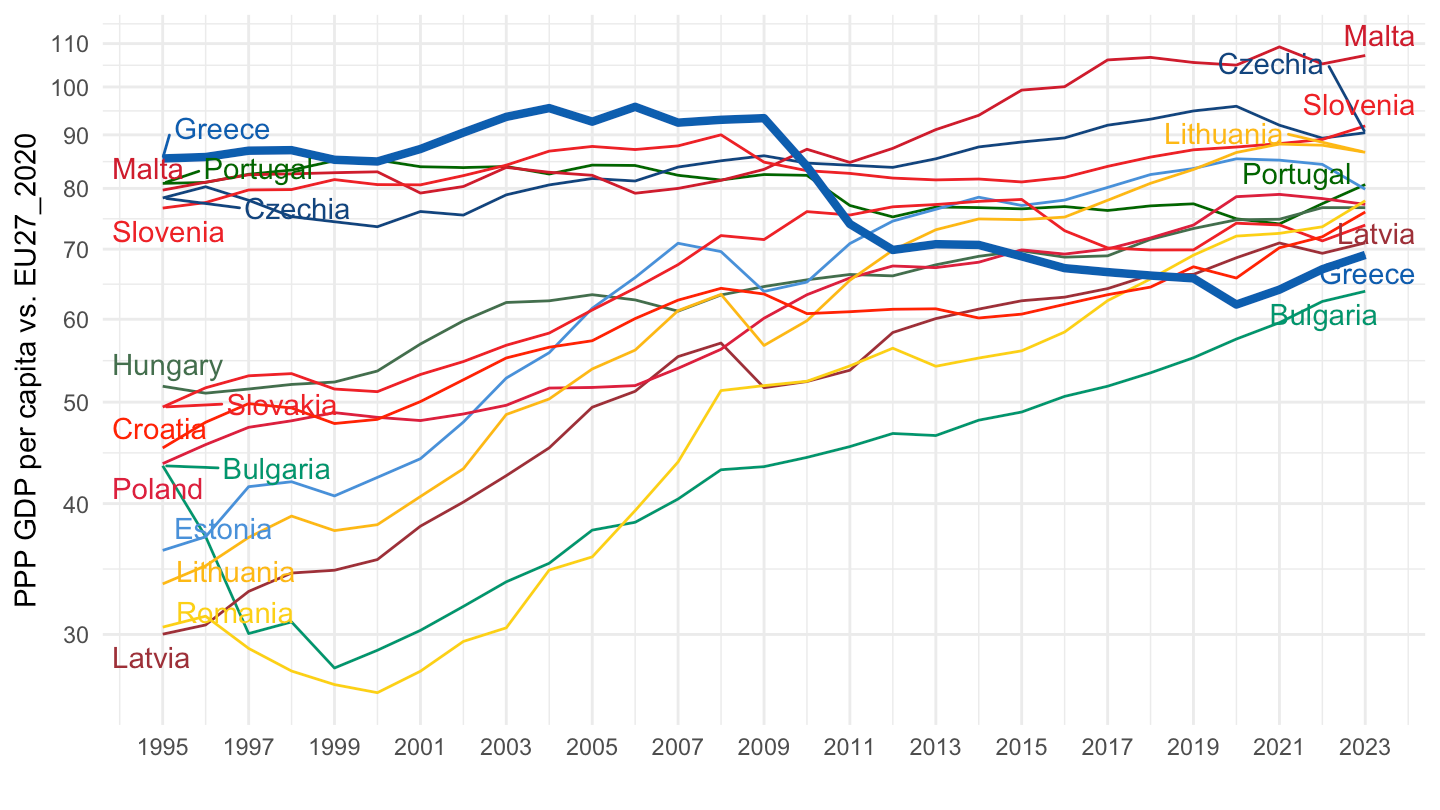
Greece, Poland, Hungary
Current prices, purchasing power standard (PPS, EU27 from 2020) per capita
Code
nama_10_pc %>%
  filter(unit == "CP_PPS_EU27_2020_HAB",
         na_item == "B1GQ",
         !(geo %in% c("EA12", "EA19", "EA20","EA", "LU", "NO", "CH", "IE"))) %>%
  select_if(~ n_distinct(.) > 1) %>%
  group_by(time) %>%
  mutate(values = 100*values/values[geo == "EU27_2020"]) %>%
  year_to_date() %>%

  mutate(Geo = ifelse(geo == "EU27_2020", "Europe", Geo)) %>%
  left_join(colors, by = c("Geo" = "country")) %>%
  filter(geo != "EU27_2020") %>%
  mutate(color = ifelse(!(geo %in% c("EL", "HU", "PL")), "gray", color)) %>%
  ggplot(.) + theme_minimal() + scale_color_identity() +
  geom_line(aes(x = date, y = values, color = color, group = geo)) +
  geom_line(data = . %>% filter(geo == "EL"), aes(x = date, y = values, color = color), size = 1.5) +
  geom_line(data = . %>% filter(geo == "HU"), aes(x = date, y = values, color = color), size = 1.5) +
  geom_line(data = . %>% filter(geo == "PL"), aes(x = date, y = values, color = color), size = 1.5) +
  xlab("") + ylab("Current prices, purchasing power standard\n (PPS, EU27 from 2020) per capita") + add_8flags +
  scale_x_date(breaks = seq(1995, 2100, 2) %>% paste0("-01-01") %>% as.Date,
               labels = date_format("%Y")) +
  scale_y_continuous(breaks = seq(10, 400, 10)) +
  geom_text_repel(data = . %>% group_by(geo) %>% filter(date %in% c(max(date), min(date))),
                  aes(x = date, y = values, color = color, label = Geo)) +
  theme_minimal()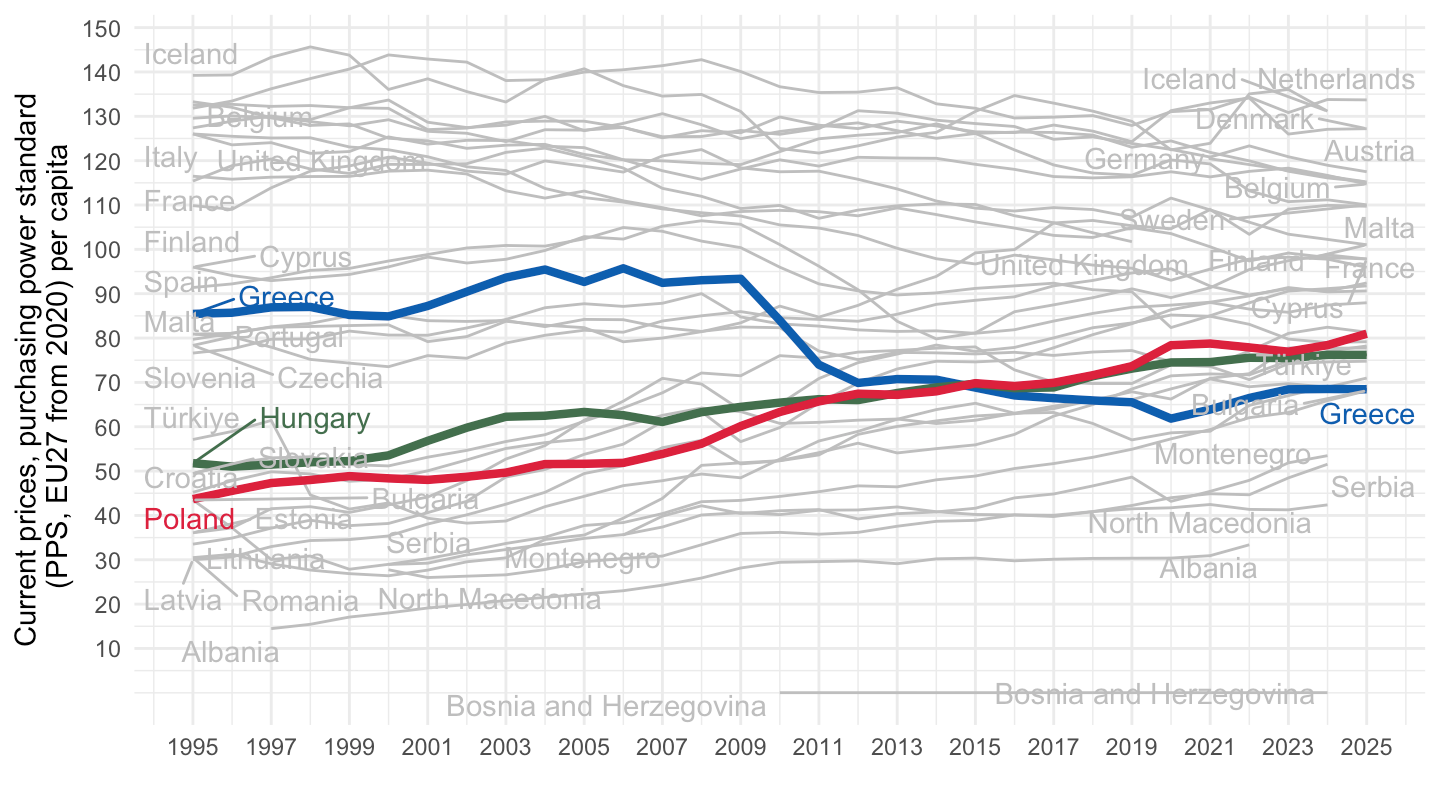
Greece
Linear
Current prices, purchasing power standard (PPS, EU27 from 2020) per capita
Code
nama_10_pc %>%
  filter(unit == "CP_PPS_EU27_2020_HAB",
         na_item == "B1GQ",
         !(geo %in% c("EA12", "EA19", "EA20","EA", "LU", "NO", "CH", "IE"))) %>%
  select_if(~ n_distinct(.) > 1) %>%
  group_by(time) %>%
  mutate(values = 100*values/values[geo == "EU27_2020"]) %>%
  year_to_date() %>%

  mutate(Geo = ifelse(geo == "EU27_2020", "Europe", Geo)) %>%
  left_join(colors, by = c("Geo" = "country")) %>%
  mutate(color = ifelse(geo == "FR", color2, color)) %>%
  filter(geo != "EU27_2020") %>%
  mutate(color = ifelse(!(geo %in% c("FR", "MT", "IT")), "gray", color)) %>%
  ggplot(.) + theme_minimal() + scale_color_identity() +
  geom_line(aes(x = date, y = values, color = color, group = geo)) +
  #geom_line(data = . %>% filter(geo == "BE"), aes(x = date, y = values, color = color), size = 1.5) +
  geom_line(data = . %>% filter(geo == "FR"), aes(x = date, y = values, color = color), size = 1.5) +
  geom_line(data = . %>% filter(geo == "IT"), aes(x = date, y = values, color = color), size = 1.5) +
  geom_line(data = . %>% filter(geo == "MT"), aes(x = date, y = values, color = color), size = 1.5) +
  xlab("") + ylab("Current prices, purchasing power standard\n (PPS, EU27 from 2020) per capita") + add_8flags +
  scale_x_date(breaks = seq(1995, 2100, 2) %>% paste0("-01-01") %>% as.Date,
               labels = date_format("%Y")) +
  scale_y_continuous(breaks = seq(10, 400, 10)) +
  geom_text_repel(data = . %>% group_by(geo) %>% filter(date %in% c(max(date), min(date))),
                  aes(x = date, y = values, color = color, label = Geo)) +
  theme_minimal()
Current (MEUR)
Code
nama_10_pc %>%
  filter(unit == "PC_EU27_2020_HAB_MEUR_CP",
         na_item == "B1GQ",
         !(geo %in% c("EA12", "EA19", "EA20","EA", "LU", "LI", "NO", "CH", "IE"))) %>%
  select_if(~ n_distinct(.) > 1) %>%
  group_by(time) %>%
  year_to_date() %>%

  mutate(Geo = ifelse(geo == "EU27_2020", "Europe", Geo)) %>%
  left_join(colors, by = c("Geo" = "country")) %>%
  filter(geo != "EU27_2020") %>%
  mutate(color = ifelse(!(geo %in% c("EL", "FR", "IT", "PL")), "gray", color)) %>%
  ggplot(.) + theme_minimal() + scale_color_identity() +
  geom_line(aes(x = date, y = values, color = color, group = geo)) +
  geom_line(data = . %>% filter(geo == "EL"), aes(x = date, y = values, color = color), size = 1.5) +
  geom_line(data = . %>% filter(geo == "FR"), aes(x = date, y = values, color = color), size = 1.5) +
  geom_line(data = . %>% filter(geo == "IT"), aes(x = date, y = values, color = color), size = 1.5) +
  geom_line(data = . %>% filter(geo == "PL"), aes(x = date, y = values, color = color), size = 1.5) +
  xlab("") + ylab("MEUR") + add_8flags +
  scale_x_date(breaks = seq(1995, 2100, 2) %>% paste0("-01-01") %>% as.Date,
               labels = date_format("%Y")) +
  scale_y_continuous(breaks = seq(10, 400, 10)) +
  geom_text_repel(data = . %>% group_by(geo) %>% filter(date %in% c(max(date), min(date))),
                  aes(x = date, y = values, color = color, label = Geo)) +
  theme_minimal()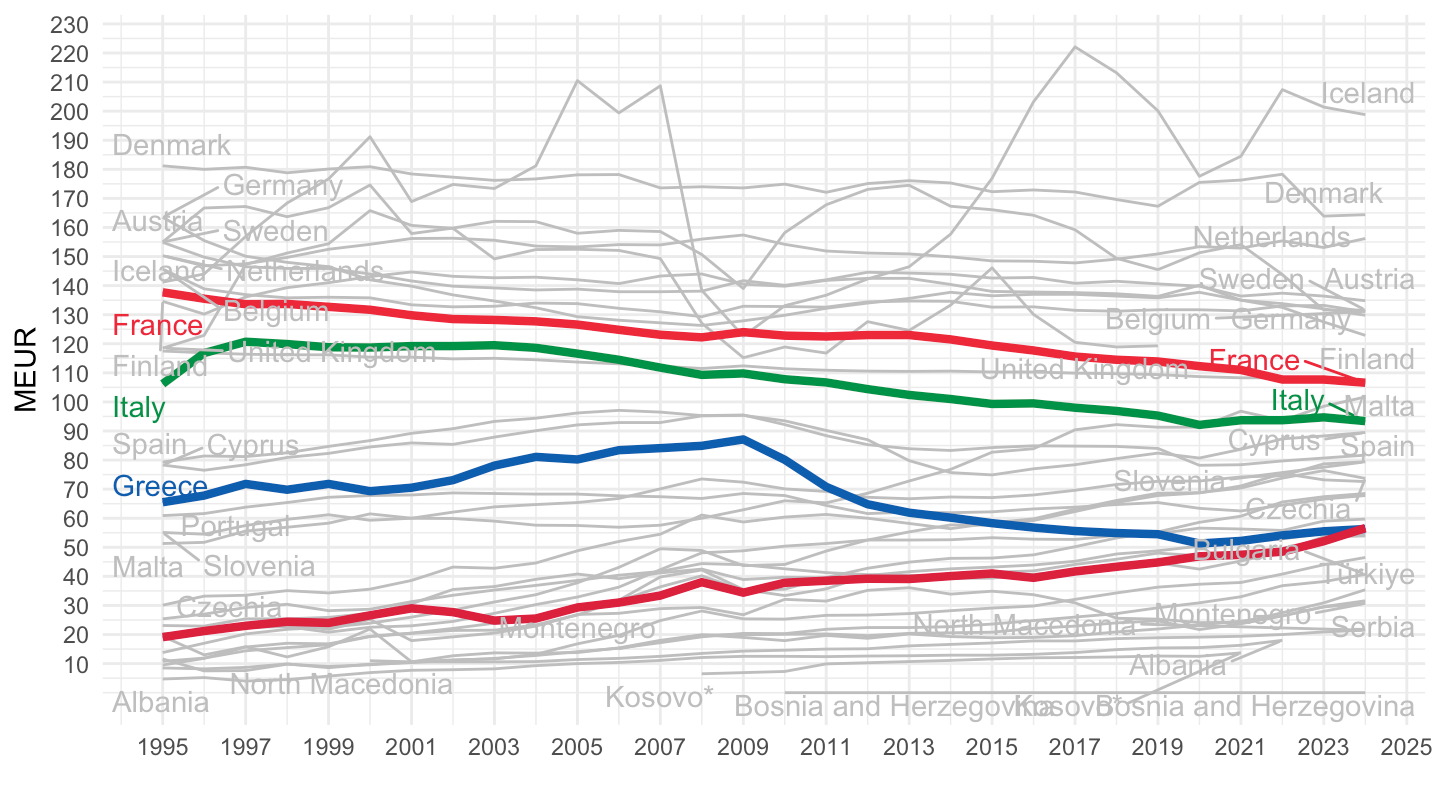
Table
Code
nama_10_pc %>%
  filter(unit == "PC_EU27_2020_HAB_MEUR_CP",
         na_item == "B1GQ",
         !(geo %in% c("EA12", "EA19", "EA20","EA", "LU", "LI", "NO", "CH", "IE")),
         time == "2024") %>%
  select_if(~ n_distinct(.) > 1) %>%

  arrange(-values) %>%
  mutate(Geo = ifelse(geo == "DE", "Germany", Geo)) %>%
  mutate(Geo = ifelse(geo == "EA21", "Europe", Geo)) %>%
  mutate(Flag = gsub(" ", "-", str_to_lower(Geo)),
         Flag = paste0('<img src="../../icon/flag/vsmall/', Flag, '.png" alt="Flag">')) %>%
  select(Flag, everything()) %>%
  {if (is_html_output()) datatable(., filter = 'top', rownames = F, escape = F) else .}
MPPS
Code
nama_10_pc %>%
  filter(unit == "PC_EU27_2020_HAB_MPPS_CP",
         na_item == "B1GQ",
         !(geo %in% c("EA12", "EA19", "EA20","EA", "LU", "LI", "NO", "CH", "IE")),) %>%
  select_if(~ n_distinct(.) > 1) %>%
  group_by(time) %>%
  year_to_date() %>%

  mutate(Geo = ifelse(geo == "EU27_2020", "Europe", Geo)) %>%
  left_join(colors, by = c("Geo" = "country")) %>%
  filter(geo != "EU27_2020") %>%
  mutate(color = ifelse(!(geo %in% c("EL", "FR", "IT", "PL")), "gray", color)) %>%
  ggplot(.) + theme_minimal() + scale_color_identity() +
  geom_line(aes(x = date, y = values, color = color, group = geo)) +
  geom_line(data = . %>% filter(geo == "EL"), aes(x = date, y = values, color = color), size = 1.5) +
  geom_line(data = . %>% filter(geo == "FR"), aes(x = date, y = values, color = color), size = 1.5) +
  geom_line(data = . %>% filter(geo == "IT"), aes(x = date, y = values, color = color), size = 1.5) +
  geom_line(data = . %>% filter(geo == "PL"), aes(x = date, y = values, color = color), size = 1.5) +
  xlab("") + ylab("PPS") + add_8flags +
  scale_x_date(breaks = seq(1995, 2100, 2) %>% paste0("-01-01") %>% as.Date,
               labels = date_format("%Y")) +
  scale_y_continuous(breaks = seq(10, 400, 10)) +
  geom_text_repel(data = . %>% group_by(geo) %>% filter(date %in% c(max(date), min(date))),
                  aes(x = date, y = values, color = color, label = Geo)) +
  theme_minimal()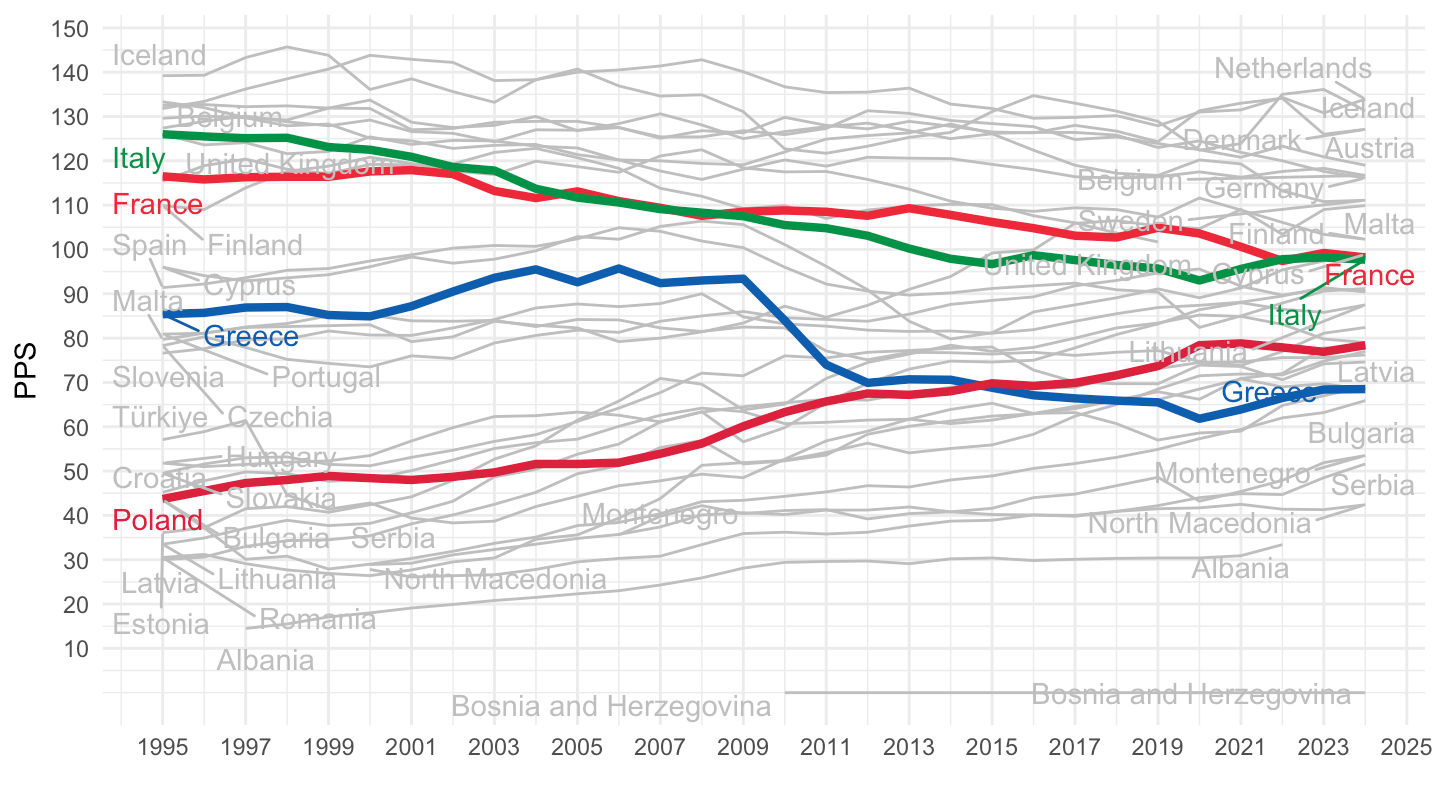
Log
Code
list_geos_EL <- nama_10_pc %>%
  filter(unit == "CP_PPS_EU27_2020_HAB",
         na_item == "B1GQ",
         time == 1995) %>%
  filter(values < values[geo == "EL"]) %>%
  pull(geo)

list_geos_EL <- c(list_geos_EL, "FR", "DE")

nama_10_pc %>%
  filter(unit == "CP_PPS_EU27_2020_HAB",
         na_item == "B1GQ",
         !(geo %in% c("EA12", "EA19", "EA20","EA"))) %>%
  select_if(~ n_distinct(.) > 1) %>%
  group_by(time) %>%
  mutate(values = 100*values/values[geo == "EU27_2020"]) %>%
  year_to_date() %>%

  mutate(Geo = ifelse(geo == "EU27_2020", "Europe", Geo)) %>%
  left_join(colors, by = c("Geo" = "country")) %>%
  filter(geo != "EU27_2020") %>%
  mutate(color = ifelse(geo != "EL", "gray", color)) %>%
  ggplot(.) + theme_minimal() + scale_color_identity() +
  geom_line(aes(x = date, y = values, color = color, group = geo)) +
  geom_line(data = . %>% filter(geo == "EL"), aes(x = date, y = values, color = color), size = 1.5) +
  xlab("") + ylab("PPP GDP per capita vs. EU27_2020") + add_8flags +
  scale_x_date(breaks = seq(1995, 2100, 2) %>% paste0("-01-01") %>% as.Date,
               labels = date_format("%Y")) +
  scale_y_log10(breaks = seq(10, 400, 10)) +
  geom_text_repel(data = . %>% group_by(geo) %>% filter(date %in% c(max(date), min(date))),
                  aes(x = date, y = values, color = color, label = Geo)) +
  theme_minimal()
With Spain
Code
nama_10_pc %>%
  filter(unit == "CP_PPS_EU27_2020_HAB",
         na_item == "B1GQ",
         (geo %in% c("PL", "EU27_2020", "FR", "HU", "DE", "EL", "IT", "ES", "NL"))) %>%
  select_if(~ n_distinct(.) > 1) %>%
  group_by(time) %>%
  mutate(values = 100*values/values[geo == "EU27_2020"]) %>%
  year_to_date() %>%

  mutate(Geo = ifelse(geo == "EU27_2020", "Europe", Geo)) %>%
  left_join(colors, by = c("Geo" = "country")) %>%
  ggplot(.) + theme_minimal() + scale_color_identity() +
  geom_line(aes(x = date, y = values, color = color)) +
  xlab("") + ylab("") + add_7flags +
  scale_x_date(breaks = seq(1940, 2100, 2) %>% paste0("-01-01") %>% as.Date,
               labels = date_format("%Y")) +
  scale_y_log10(breaks = seq(10, 200, 10)) +
  geom_text_repel(data = . %>% group_by(geo) %>% filter(date == max(date)),
                  aes(x = date, y = values, color = color, label = Geo)) +
  theme_minimal()
France
Linear
Code
nama_10_pc %>%
  filter(unit == "CP_PPS_EU27_2020_HAB",
         na_item == "B1GQ",
         !(geo %in% c("EA12", "EA19", "EA20","EA", "LU", "NO", "CH", "IE"))) %>%
  select_if(~ n_distinct(.) > 1) %>%
  group_by(time) %>%
  mutate(values = 100*values/values[geo == "EU27_2020"]) %>%
  year_to_date() %>%

  mutate(Geo = ifelse(geo == "EU27_2020", "Europe", Geo)) %>%
  left_join(colors, by = c("Geo" = "country")) %>%
  mutate(color = ifelse(geo == "FR", color2, color)) %>%
  filter(geo != "EU27_2020") %>%
  mutate(color = ifelse(!(geo %in% c("DE", "FR", "IT", "PL")), "gray", color)) %>%
  ggplot(.) + theme_minimal() + scale_color_identity() +
  geom_line(aes(x = date, y = values, color = color, group = geo)) +
  geom_line(data = . %>% filter(geo == "DE"), aes(x = date, y = values, color = color), size = 1.5) +
  geom_line(data = . %>% filter(geo == "FR"), aes(x = date, y = values, color = color), size = 1.5) +
  geom_line(data = . %>% filter(geo == "IT"), aes(x = date, y = values, color = color), size = 1.5) +
  geom_line(data = . %>% filter(geo == "PL"), aes(x = date, y = values, color = color), size = 1.5) +
  xlab("") + ylab("PPP GDP per capita vs. EU27_2020") + add_8flags +
  scale_x_date(breaks = seq(1995, 2100, 2) %>% paste0("-01-01") %>% as.Date,
               labels = date_format("%Y")) +
  scale_y_continuous(breaks = seq(10, 400, 10)) +
  geom_text_repel(data = . %>% group_by(geo) %>% filter(date %in% c(max(date), min(date))),
                  aes(x = date, y = values, color = color, label = Geo)) +
  theme_minimal()
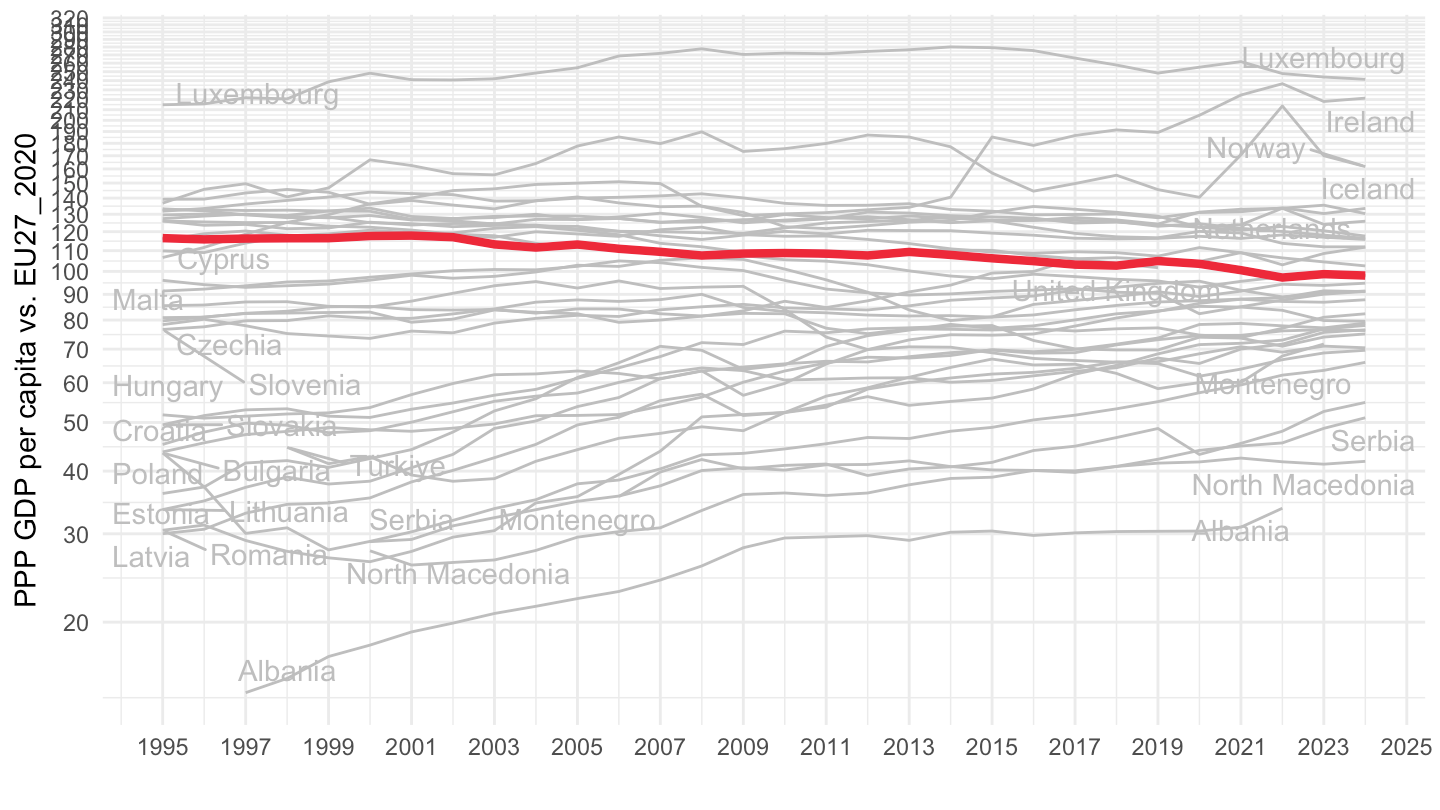
Log
Code
nama_10_pc %>%
  filter(unit == "CP_PPS_EU27_2020_HAB",
         na_item == "B1GQ",
         !(geo %in% c("EA12", "EA19", "EA20","EA"))) %>%
  select_if(~ n_distinct(.) > 1) %>%
  group_by(time) %>%
  mutate(values = 100*values/values[geo == "EU27_2020"]) %>%
  year_to_date() %>%

  mutate(Geo = ifelse(geo == "EU27_2020", "Europe", Geo)) %>%
  left_join(colors, by = c("Geo" = "country")) %>%
  filter(geo != "EU27_2020") %>%
  mutate(color = ifelse(geo != "FR", "gray", color)) %>%
  ggplot(.) + theme_minimal() + scale_color_identity() +
  geom_line(aes(x = date, y = values, color = color, group = geo)) +
  geom_line(data = . %>% filter(geo == "FR"), aes(x = date, y = values, color = color), size = 1.5) +
  xlab("") + ylab("PPP GDP per capita vs. EU27_2020") + add_8flags +
  scale_x_date(breaks = seq(1995, 2100, 2) %>% paste0("-01-01") %>% as.Date,
               labels = date_format("%Y")) +
  scale_y_log10(breaks = seq(10, 400, 10)) +
  geom_text_repel(data = . %>% group_by(geo) %>% filter(date %in% c(max(date), min(date))),
                  aes(x = date, y = values, color = color, label = Geo)) +
  theme_minimal()