Population structure indicators at national level
Data - Eurostat
Info
Last observation: Annual: 2025 (N = 2,475)
First observation: Annual: 1960 (N = 1,193)
Last data update: 23 jul 2026, 22:08. Last compile: 24 jul 2026, 01:04
Structure
Median Age of Population
France, Germany, Italy, Spain, Greece
Code
demo_pjanind %>%
  filter(geo %in% c("FR", "DE", "IT", "ES", "EL"),
         indic_de == "MEDAGEPOP") %>%
  year_to_date %>%
  left_join(colors, by = c("Geo" = "country")) %>%
  ggplot + geom_line(aes(x = date, y = values, color = color)) +
  theme_minimal() + scale_color_identity() + add_5flags +
  scale_x_date(breaks = as.Date(paste0(seq(1960, 2100, 5), "-01-01")),
               labels = date_format("%Y")) +
  xlab("") + ylab("Median age of population (years)")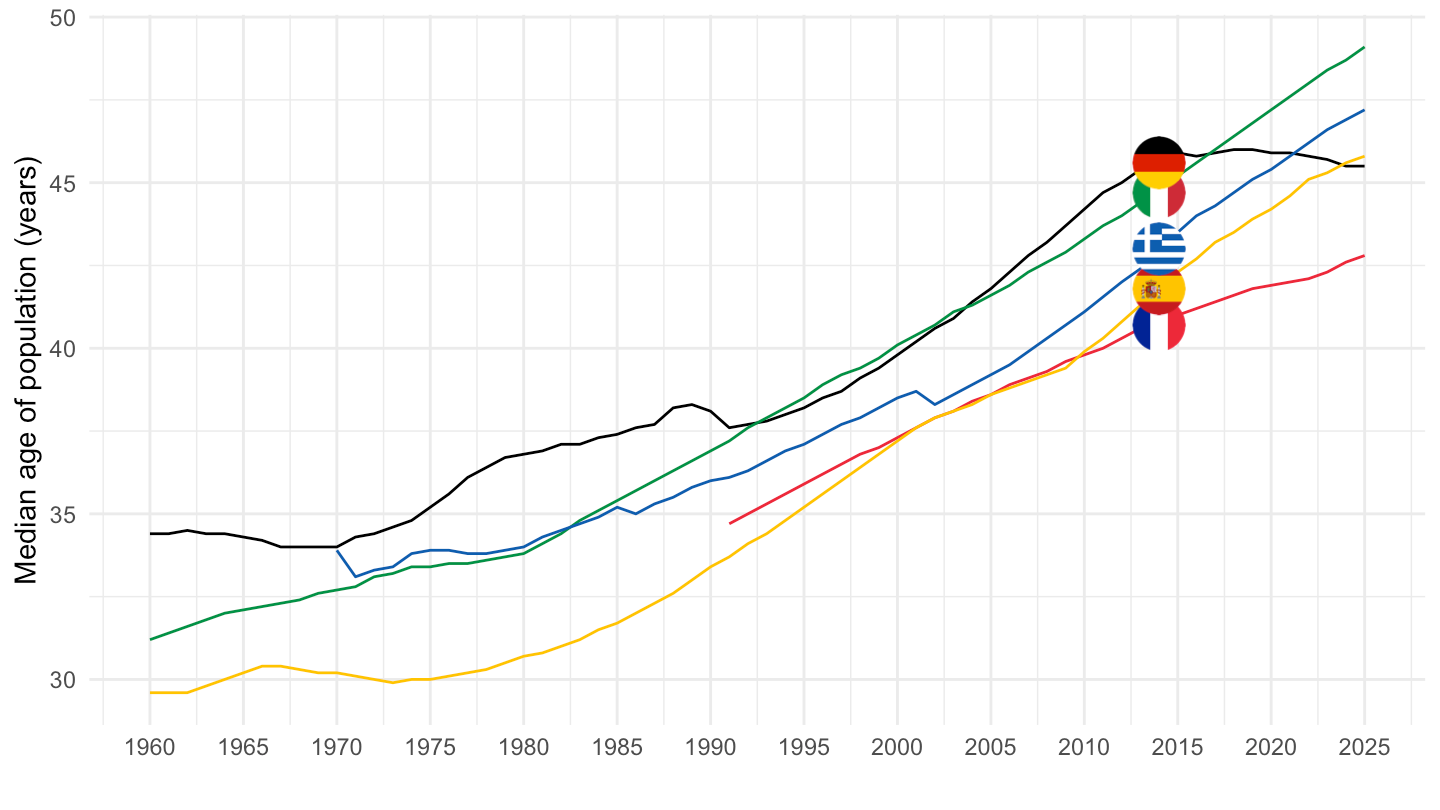
Old-Age Dependency Ratio
France, Germany, Italy, Spain, Greece
Code
demo_pjanind %>%
  filter(geo %in% c("FR", "DE", "IT", "ES", "EL"),
         indic_de == "OLDDEP1") %>%
  year_to_date %>%
  left_join(colors, by = c("Geo" = "country")) %>%
  mutate(values = values/100) %>%
  ggplot + geom_line(aes(x = date, y = values, color = color)) +
  theme_minimal() + scale_color_identity() + add_5flags +
  scale_x_date(breaks = as.Date(paste0(seq(1960, 2100, 5), "-01-01")),
               labels = date_format("%Y")) +
  xlab("") + ylab("Old-age dependency ratio (65+ / 15-64)") +
  scale_y_continuous(labels = scales::percent_format(accuracy = 1))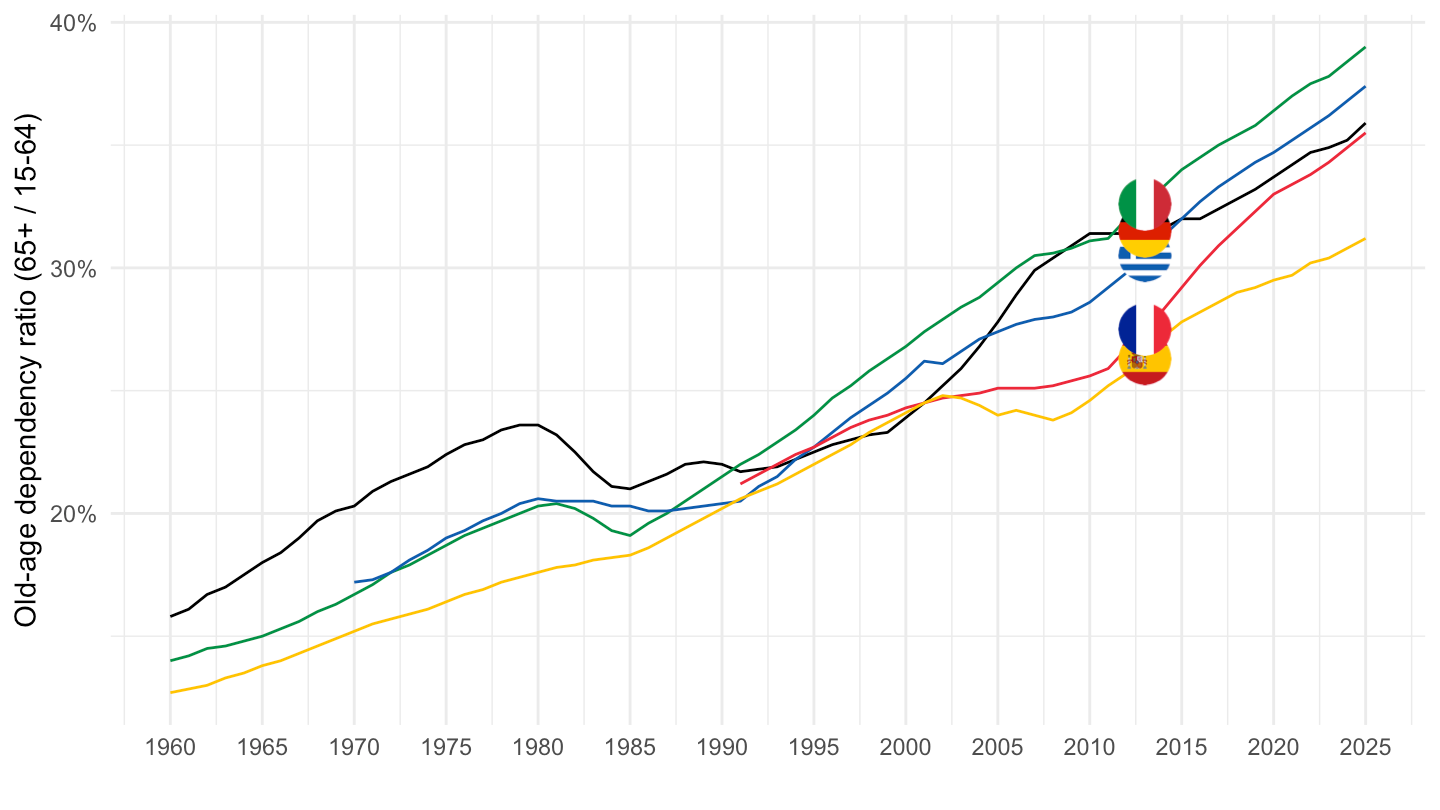
Table 2023
Code
demo_pjanind %>%
  filter(time == "2023",
         indic_de %in% c("YOUNGDEP1", "OLDDEP1", "DEPRATIO1")) %>%
  spread(indic_de, values) %>%

  arrange(-DEPRATIO1) %>%
  select_if(~ n_distinct(.) > 1) %>%
  select(geo, Geo, everything()) %>%
  print_table_conditional