| source | dataset | Title | .html | .rData |
|---|---|---|---|---|
| eurostat | demo_fmonth | Live births (total) by month | 2026-06-04 | 2026-04-26 |
Live births (total) by month
Data - Eurostat
Info
geo
Code
demo_fmonth %>%
  left_join(geo, by = "geo") %>%
  group_by(geo, Geo) %>%
  summarise(Nobs = n()) %>%
  arrange(-Nobs) %>%
  {if (is_html_output()) datatable(., filter = 'top', rownames = F) else .}
month
Code
demo_fmonth %>%
  left_join(month, by = "month") %>%
  group_by(month, Month) %>%
  summarise(Nobs = n()) %>%
  {if (is_html_output()) datatable(., filter = 'top', rownames = F) else .}
time
Code
demo_fmonth %>%
  mutate(time2 = paste0(time, month)) %>%
  group_by(time2) %>%
  summarise(Nobs = n()) %>%
  {if (is_html_output()) datatable(., filter = 'top', rownames = F) else .}
Europe, Greece, Germany
1980-
Code
demo_fmonth %>%
  mutate(time = paste0(time, month)) %>%
  month_to_date %>%
  filter(date >= as.Date("1980-01-01"),
         geo %in% c("EA19", "EL", "FR")) %>%
  left_join(geo, by = "geo") %>%
  mutate(Geo = ifelse(geo == "EA19", "Europe", Geo)) %>%
  left_join(colors, by = c("Geo" = "country")) %>%
  ggplot + geom_line(aes(x = date, y = values, color = color)) +
  scale_color_identity() + add_3flags +
  theme_minimal() + xlab("") + ylab("") +
  scale_x_date(breaks = seq(1910, 2100, 5) %>% paste0("-01-01") %>% as.Date,
               labels = date_format("%Y")) +
  scale_y_continuous() +
  theme(legend.position = c(0.2, 0.2),
        legend.title = element_blank())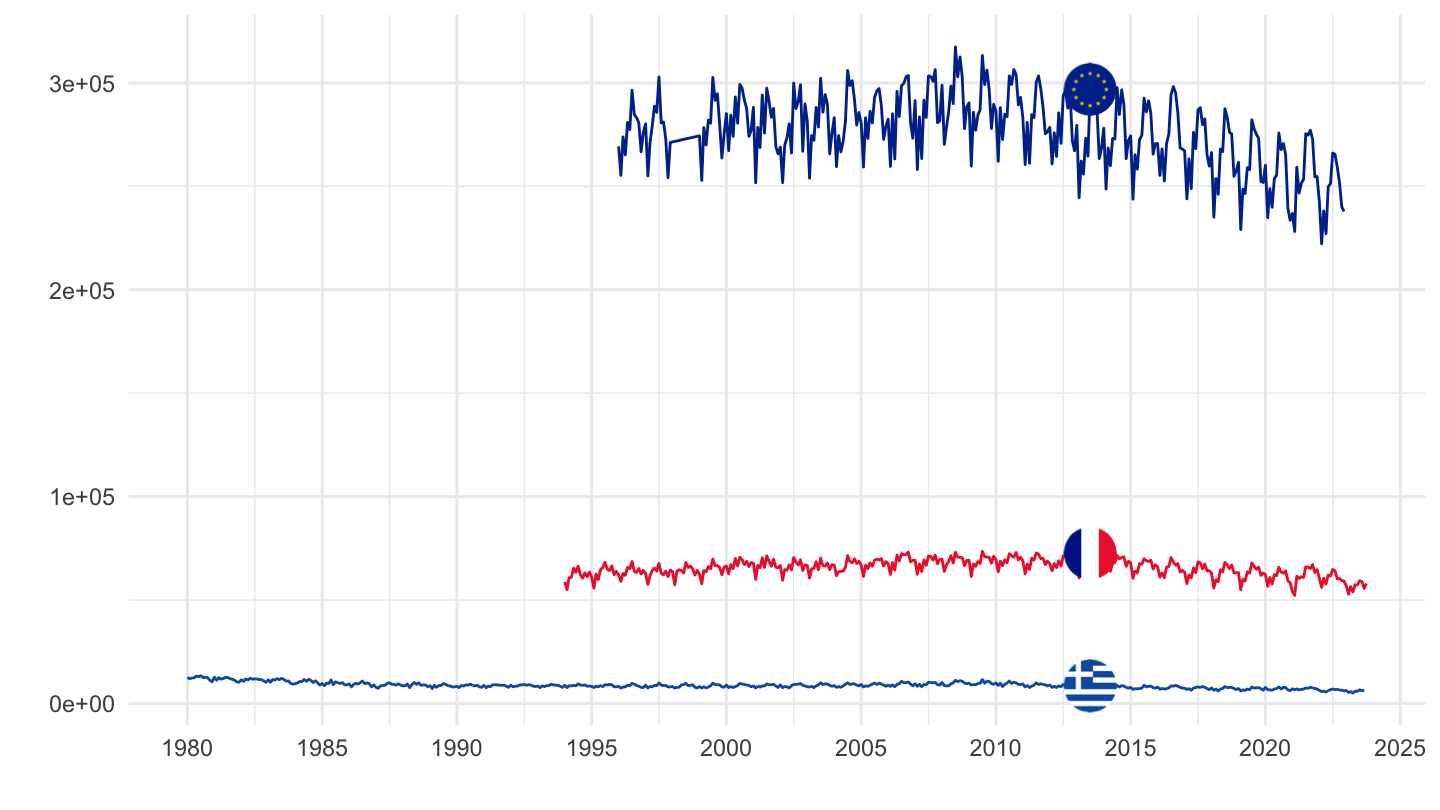
France, Italy, Germany
All
12 months
Code
demo_fmonth %>%
  filter(!(month %in% c("UNK", "TOTAL"))) %>%
  mutate(time = paste0(time, month)) %>%
  month_to_date %>%
  filter(geo %in% c("DE", "FR", "IT"),
         !is.na(values)) %>%
  group_by(geo) %>%
  arrange(date) %>%
  mutate(values = zoo::rollsum(x = values, 12, align = "right", fill = NA)) %>%
  left_join(geo, by = "geo") %>%
  left_join(colors, by = c("Geo" = "country")) %>%
  ggplot + geom_line(aes(x = date, y = values, color = color)) +
  scale_color_identity() + add_3flags +
  theme_minimal() + xlab("") + ylab("") +
  scale_x_date(breaks = seq(1910, 2100, 5) %>% paste0("-01-01") %>% as.Date,
               labels = date_format("%Y")) +
  scale_y_continuous(breaks =seq(0, 2000000, 100000),
                     labels = dollar_format(pre = "", acc = 1, su = "")) +
  theme(legend.position = c(0.2, 0.2),
        legend.title = element_blank())
1980-
Month
Code
demo_fmonth %>%
  mutate(time = paste0(time, month)) %>%
  month_to_date %>%
  filter(date >= as.Date("1980-01-01"),
         geo %in% c("DE", "FR", "IT", "FX")) %>%
  ggplot + geom_line(aes(x = date, y = values, color = geo)) +
  theme_minimal() + xlab("") + ylab("") +
  scale_x_date(breaks = seq(1910, 2100, 5) %>% paste0("-01-01") %>% as.Date,
               labels = date_format("%Y")) +
  scale_y_continuous() +
  theme(legend.position = c(0.2, 0.2),
        legend.title = element_blank())
12 months
Code
demo_fmonth %>%
  mutate(time = paste0(time, month)) %>%
  month_to_date %>%
  filter(date >= as.Date("1980-01-01"),
         geo %in% c("DE", "FR", "IT")) %>%
  group_by(geo) %>%
  arrange(date) %>%
  mutate(values = zoo::rollsum(x = values, 12, align = "right", fill = NA)) %>%
  left_join(geo, by = "geo") %>%
  left_join(colors, by = c("Geo" = "country")) %>%
  ggplot + geom_line(aes(x = date, y = values, color = color)) +
  scale_color_identity() + add_3flags +
  theme_minimal() + xlab("") + ylab("") +
  scale_x_date(breaks = seq(1910, 2100, 5) %>% paste0("-01-01") %>% as.Date,
               labels = date_format("%Y")) +
  scale_y_continuous() +
  theme(legend.position = c(0.2, 0.2),
        legend.title = element_blank())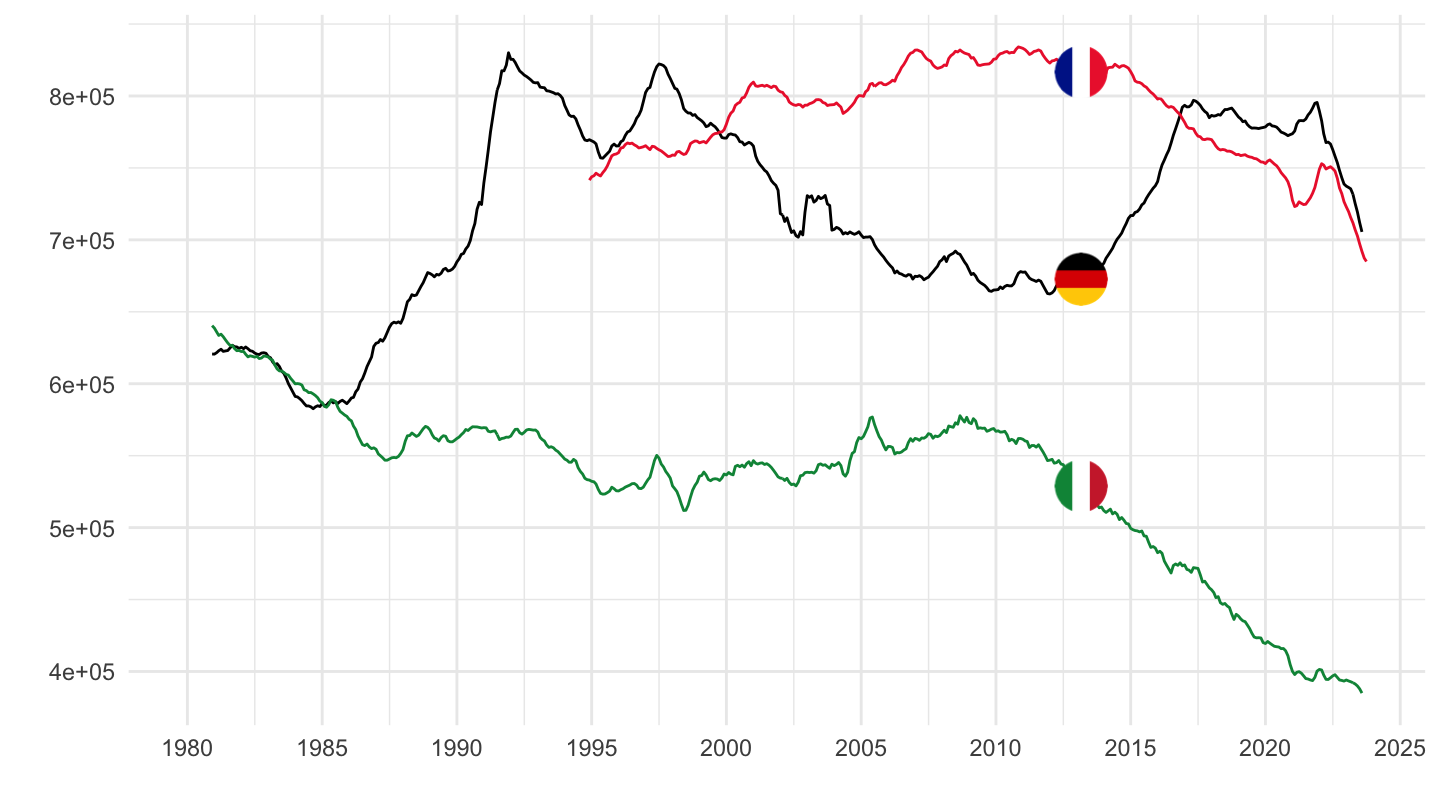
1990-
Code
demo_fmonth %>%
  mutate(time = paste0(time, month)) %>%
  month_to_date %>%
  filter(date >= as.Date("1990-01-01"),
         geo %in% c("DE", "FR", "IT")) %>%
  left_join(geo, by = "geo") %>%
  left_join(colors, by = c("Geo" = "country")) %>%
  ggplot + geom_line(aes(x = date, y = values, color = color)) +
  scale_color_identity() + add_3flags +
  theme_minimal() + xlab("") + ylab("") +
  scale_x_date(breaks = seq(1910, 2100, 5) %>% paste0("-01-01") %>% as.Date,
               labels = date_format("%Y")) +
  scale_y_continuous() +
  theme(legend.position = c(0.2, 0.2),
        legend.title = element_blank())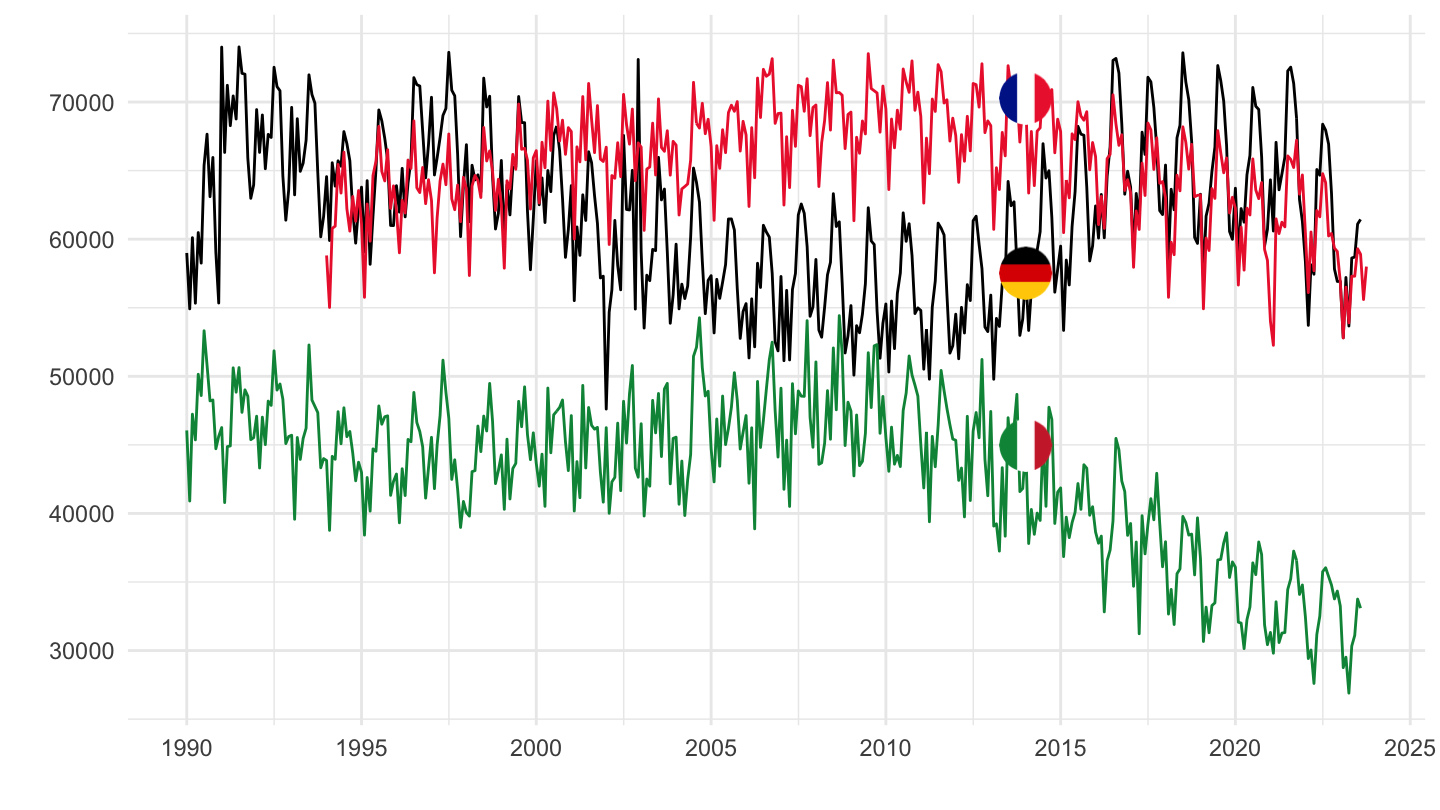
1995-
All
Code
demo_fmonth %>%
  mutate(time = paste0(time, month)) %>%
  month_to_date %>%
  filter(date >= as.Date("1995-01-01"),
         geo %in% c("DE", "FR", "IT")) %>%
  left_join(geo, by = "geo") %>%
  left_join(colors, by = c("Geo" = "country")) %>%
  ggplot + geom_line(aes(x = date, y = values, color = color)) +
  scale_color_identity() + add_3flags +
  theme_minimal() + xlab("") + ylab("") +
  scale_x_date(breaks = seq(1910, 2100, 5) %>% paste0("-01-01") %>% as.Date,
               labels = date_format("%Y")) +
  scale_y_continuous() +
  theme(legend.position = c(0.2, 0.2),
        legend.title = element_blank())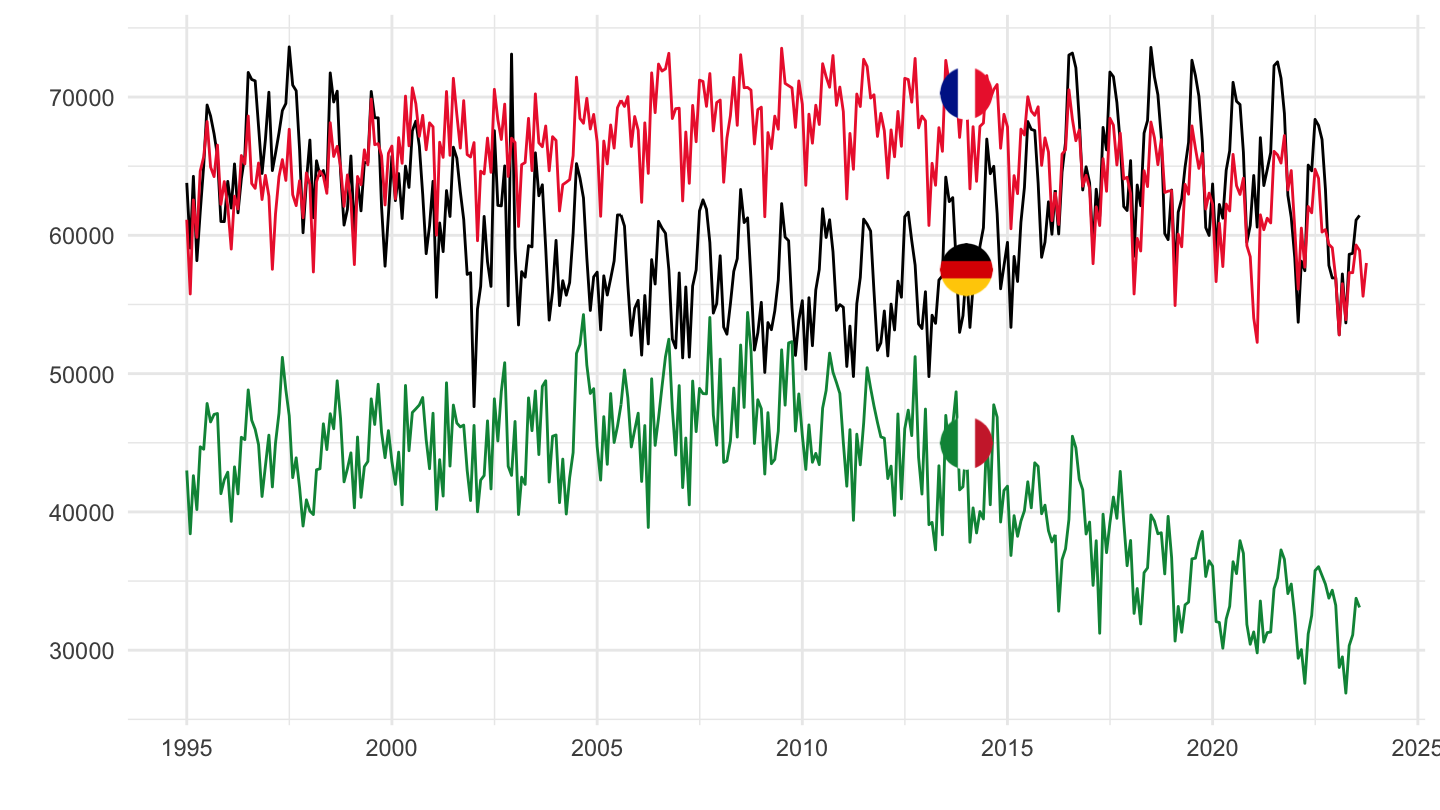
12 months
Code
demo_fmonth %>%
  mutate(time = paste0(time, month)) %>%
  month_to_date %>%
  filter(date >= as.Date("1980-01-01"),
         geo %in% c("DE", "FR", "IT")) %>%
  group_by(geo) %>%
  arrange(date) %>%
  mutate(values = zoo::rollsum(x = values, 12, align = "right", fill = NA)) %>%
  left_join(geo, by = "geo") %>%
  left_join(colors, by = c("Geo" = "country")) %>%
  ggplot + geom_line(aes(x = date, y = values, color = color)) +
  scale_color_identity() + add_3flags +
  theme_minimal() + xlab("") + ylab("") +
  scale_x_date(breaks = seq(1910, 2100, 5) %>% paste0("-01-01") %>% as.Date,
               labels = date_format("%Y")) +
  scale_y_continuous() +
  theme(legend.position = c(0.2, 0.2),
        legend.title = element_blank())
2010-
All
Code
demo_fmonth %>%
  mutate(time = paste0(time, month)) %>%
  month_to_date %>%
  filter(date >= as.Date("2010-01-01"),
         geo %in% c("DE", "FR", "IT")) %>%
  left_join(geo, by = "geo") %>%
  left_join(colors, by = c("Geo" = "country")) %>%
  ggplot + geom_line(aes(x = date, y = values, color = color)) +
  scale_color_identity() + add_3flags +
  theme_minimal() + xlab("") + ylab("") +
  scale_x_date(breaks = seq(1910, 2100, 5) %>% paste0("-01-01") %>% as.Date,
               labels = date_format("%Y")) +
  scale_y_continuous() +
  theme(legend.position = c(0.2, 0.2),
        legend.title = element_blank())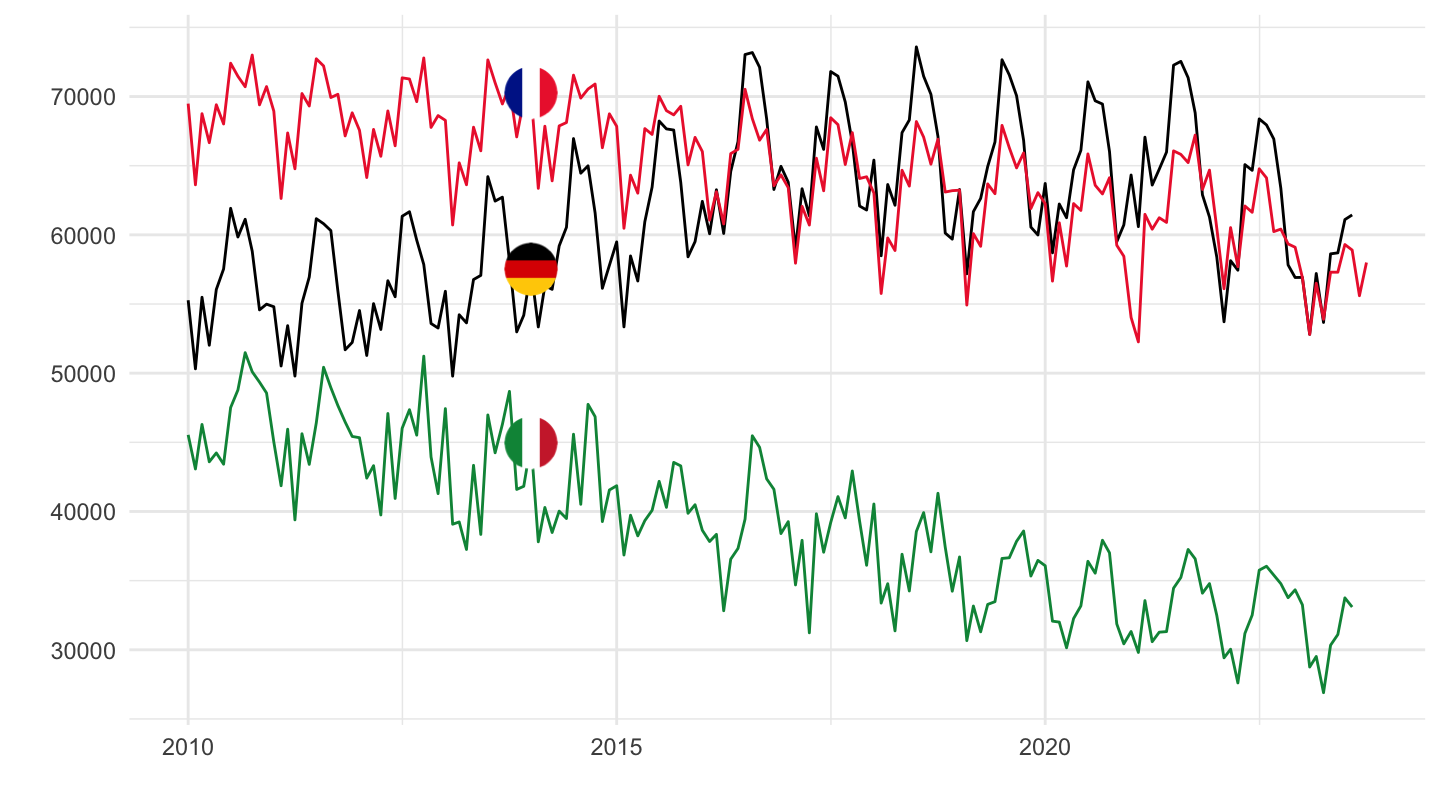
12 months
Code
demo_fmonth %>%
  mutate(time = paste0(time, month)) %>%
  month_to_date %>%
  filter(date >= as.Date("2010-01-01"),
         geo %in% c("DE", "FR", "IT")) %>%
  group_by(geo) %>%
  arrange(date) %>%
  mutate(values = zoo::rollsum(x = values, 12, align = "right", fill = NA)) %>%
  left_join(geo, by = "geo") %>%
  left_join(colors, by = c("Geo" = "country")) %>%
  ggplot + geom_line(aes(x = date, y = values, color = color)) +
  scale_color_identity() + add_3flags +
  theme_minimal() + xlab("") + ylab("") +
  scale_x_date(breaks = seq(1910, 2100, 1) %>% paste0("-01-01") %>% as.Date,
               labels = date_format("%Y")) +
  scale_y_continuous() +
  theme(legend.position = c(0.2, 0.2),
        legend.title = element_blank())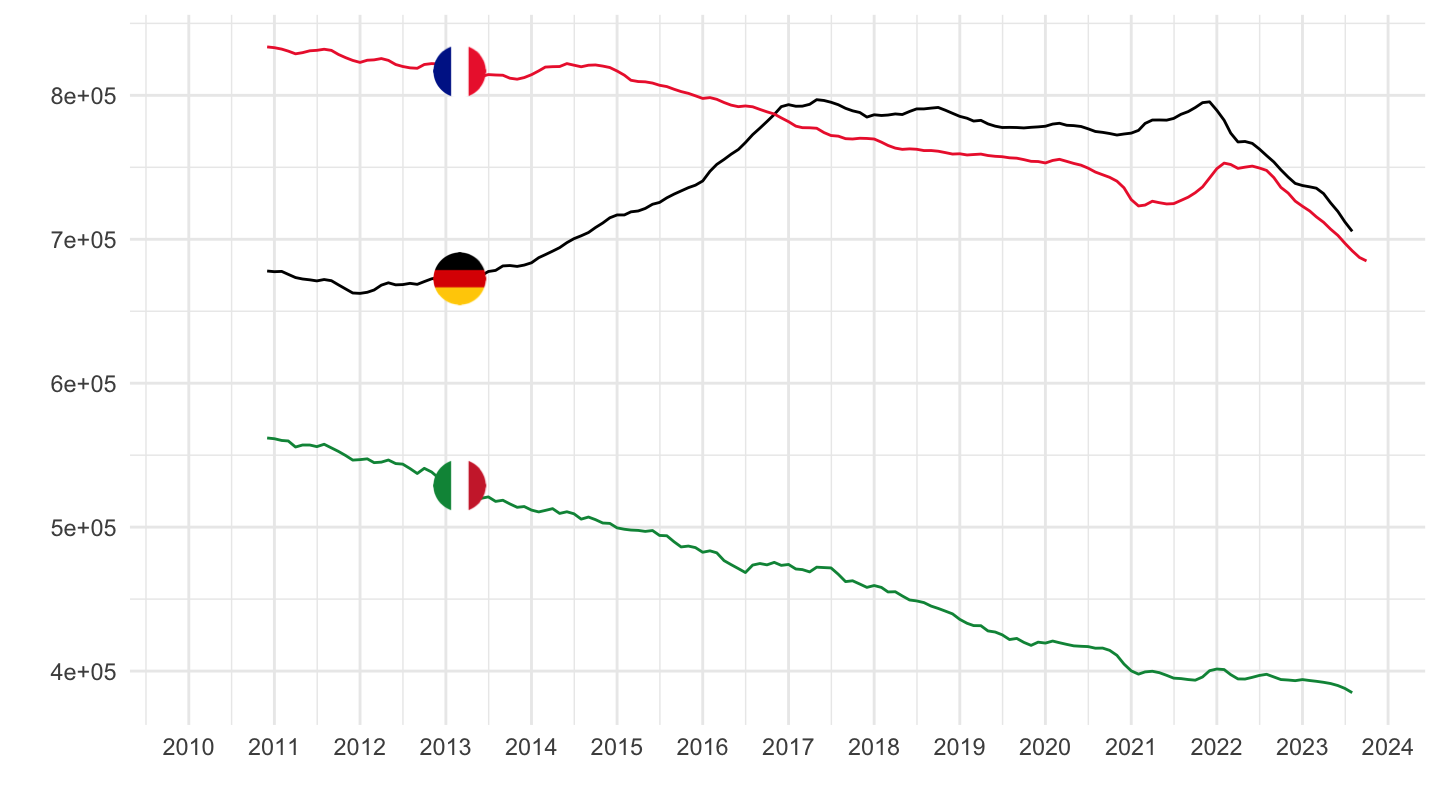
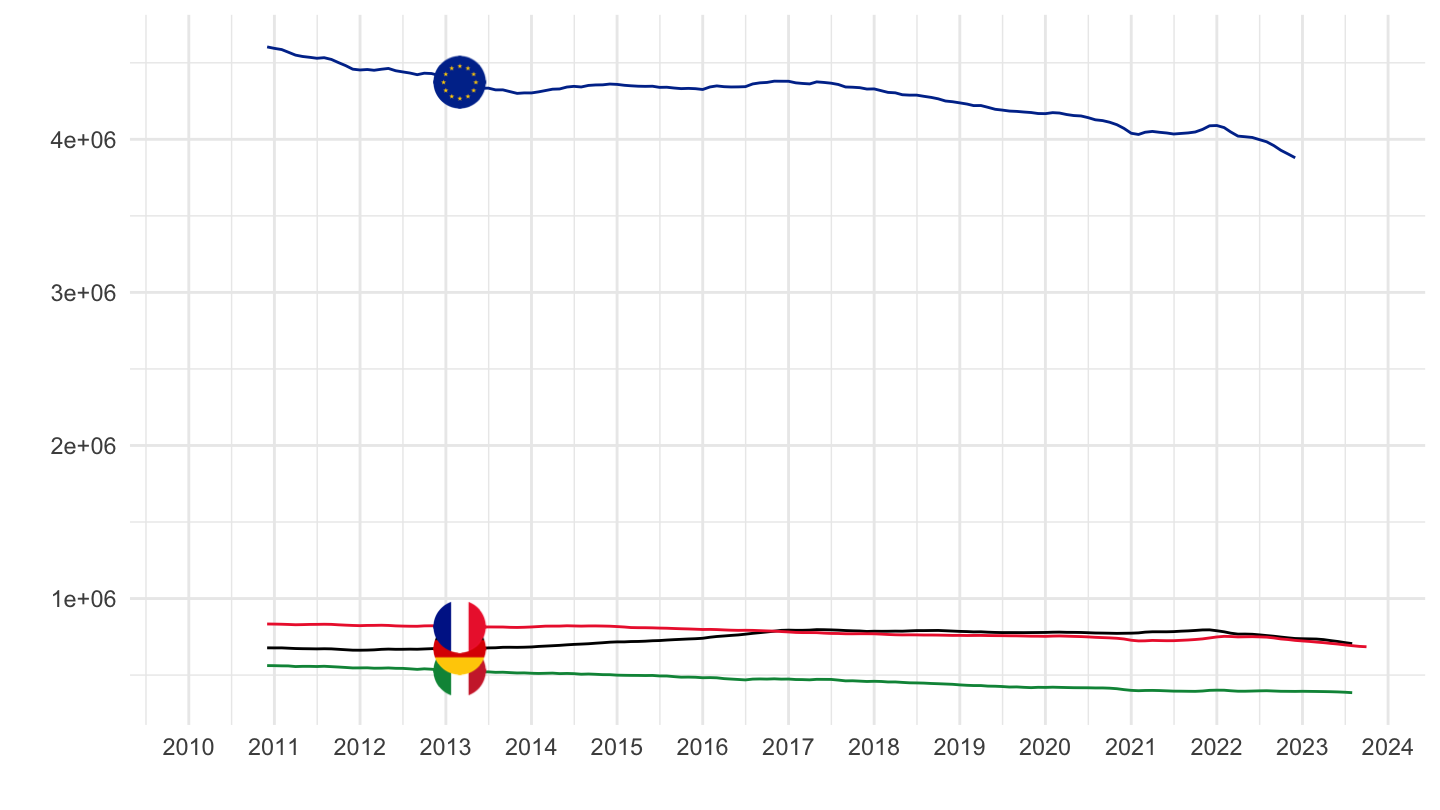
France Italy, Germany, Europe
12 months
Code
demo_fmonth %>%
  mutate(time = paste0(time, month)) %>%
  month_to_date %>%
  filter(date >= as.Date("2010-01-01"),
         geo %in% c("DE", "FR", "IT", "EU27_2020")) %>%
  group_by(geo) %>%
  arrange(date) %>%
  left_join(geo, by = "geo") %>%
  mutate(values = zoo::rollsum(x = values, 12, align = "right", fill = NA),
         Geo = ifelse(geo == "EU27_2020", "Europe", Geo)) %>%
  left_join(colors, by = c("Geo" = "country")) %>%
  ggplot + geom_line(aes(x = date, y = values, color = color)) +
  scale_color_identity() + add_4flags +
  theme_minimal() + xlab("") + ylab("") +
  scale_x_date(breaks = seq(1910, 2100, 1) %>% paste0("-01-01") %>% as.Date,
               labels = date_format("%Y")) +
  scale_y_continuous() +
  theme(legend.position = c(0.2, 0.2),
        legend.title = element_blank())