Measuring “the” Purchasing Power
“The figures are innocent people who, under solicitation, under torture, very quickly confess what is asked of them, even if it means retracting later.” (Alfred Sauvy)
Since the reappearance of inflation at the end of 2021, the question of purchasing power has once again become the number one concern of the French in opinion surveys: household consumption (notably food) has fallen in a historically unprecedented way, more and more French people report financial difficulties, and the rate of material and social deprivation has sharply increased. Yet, according to the official figures of the French National Statistics Institute (Insee), “the” purchasing power per consumption unit has continued to rise over the past three years: a sharp increase in 2021 (+2.8%), a slight decline in 2022 (-0.4%), followed by a moderate rebound in 2023 (+0.3%) and a significant increase in 2024, with a growth carry-over of +1.1% as early as the first quarter. Many economists, experts, journalists, as well as official institutions, regularly rely on these Insee figures to emphasize “the reality” of the rise in purchasing power in France, in contradiction with “perceptions.” This discrepancy between official statistics and the perception of a decline in purchasing power is not new: for several years, the gap between “the feeling” of declining purchasing power and “the reality of the numbers” has raised eyebrows—for example during the Yellow Vests movement. On the one hand, it is argued that this discrepancy necessarily stems from “misunderstandings,” or even from a “lack of economic literacy” among the French, requiring more “pedagogy.” On the other hand, official figures are sometimes rejected outright, either on the grounds that the numbers are too reductive and structurally fail to reflect economic reality, or that they are manipulated by the State. Official figures on purchasing power are too rarely subjected to a rational and reasoned critical examination.
Without a polemical spirit, this working paper demonstrates that there are numerous biases affecting the official purchasing power data published by Insee. First, the very definition of household purchasing power adopted by the national statistical institute—namely, “gross disposable income deflated by the household consumption deflator”—compares an income and a price index that do not cover the same scope, which contravenes the principles of national accounting, as set out in international manuals. The dissemination of this indicator at the same level as GDP growth in the national accounts, as well as its uniform definition, is a French peculiarity. Next, the “consumption deflator” underestimates inflation for several reasons: the absence of household investment in housing; the use of a Paasche index, which structurally tends to minimize inflation compared to other indices commonly used to measure living standards, such as the HICP and the CPI; stronger “quality adjustments” than in other European countries, notably for imported goods such as mobile phones and computer equipment, but also for telecommunications services. Moreover, “gross disposable income,” used as the numerator in the purchasing power calculation, omits several essential elements: the “inflation tax,” which creates an illusion of higher capital income when inflation and nominal interest rates rise simultaneously but ignores a major source of creditor impoverishment; the depreciation of households’ housing capital; and the unequal distribution of capital income within the population, making the notion of an “average” hardly representative. Many “structural effects” linked to age and social category are also not taken into account, even though they can objectively explain the “feeling of downgrading.”
How should purchasing power be measured? The evolution of net wages, deflated by the Harmonized Index of Consumer Prices (HICP), constitutes an indispensable and already available indicator, which confirms a significant decline in purchasing power in recent years. In the medium term, other indicators could be considered to complement the existing data. In any case, once the methodological biases in the official measurement of purchasing power are identified, Insee should show more caution and nuance in its communication on the evolution of purchasing power, for example by communicating more about the purchasing power of net wages. The credibility of public statistics is at stake.
A Growing Gap Between “the Numbers” and “the Perception”
The official figures on purchasing power, published by Insee every quarter alongside the detailed quarterly accounts, and every year with the national accounts, show an increase in purchasing power since 2021. According to these official figures reproduced in Table 1, “the” purchasing power of households has not ceased to increase over the entire period: +3.4% in 2021, +0.2% in 2022, and +0.8% in 2023, with a growth carry-over of +1.4% for 2024. For “purchasing power per consumption unit”: +2.8% in 2021, -0.4% in 2022, +0.3% in 2023, and +1.1% for 2024. The official diagnosis is therefore one of an increase in household purchasing power over the entire inflationary period.
| Evolution of… | 2021 | 2022 | 2023 | 2024 |
|---|---|---|---|---|
| … purchasing power | +3.4% | +0.2% | +0.8% | +1.4% |
| … purchasing power per CU | +2.8% | -0.4% | +0.3% | +1.1% |
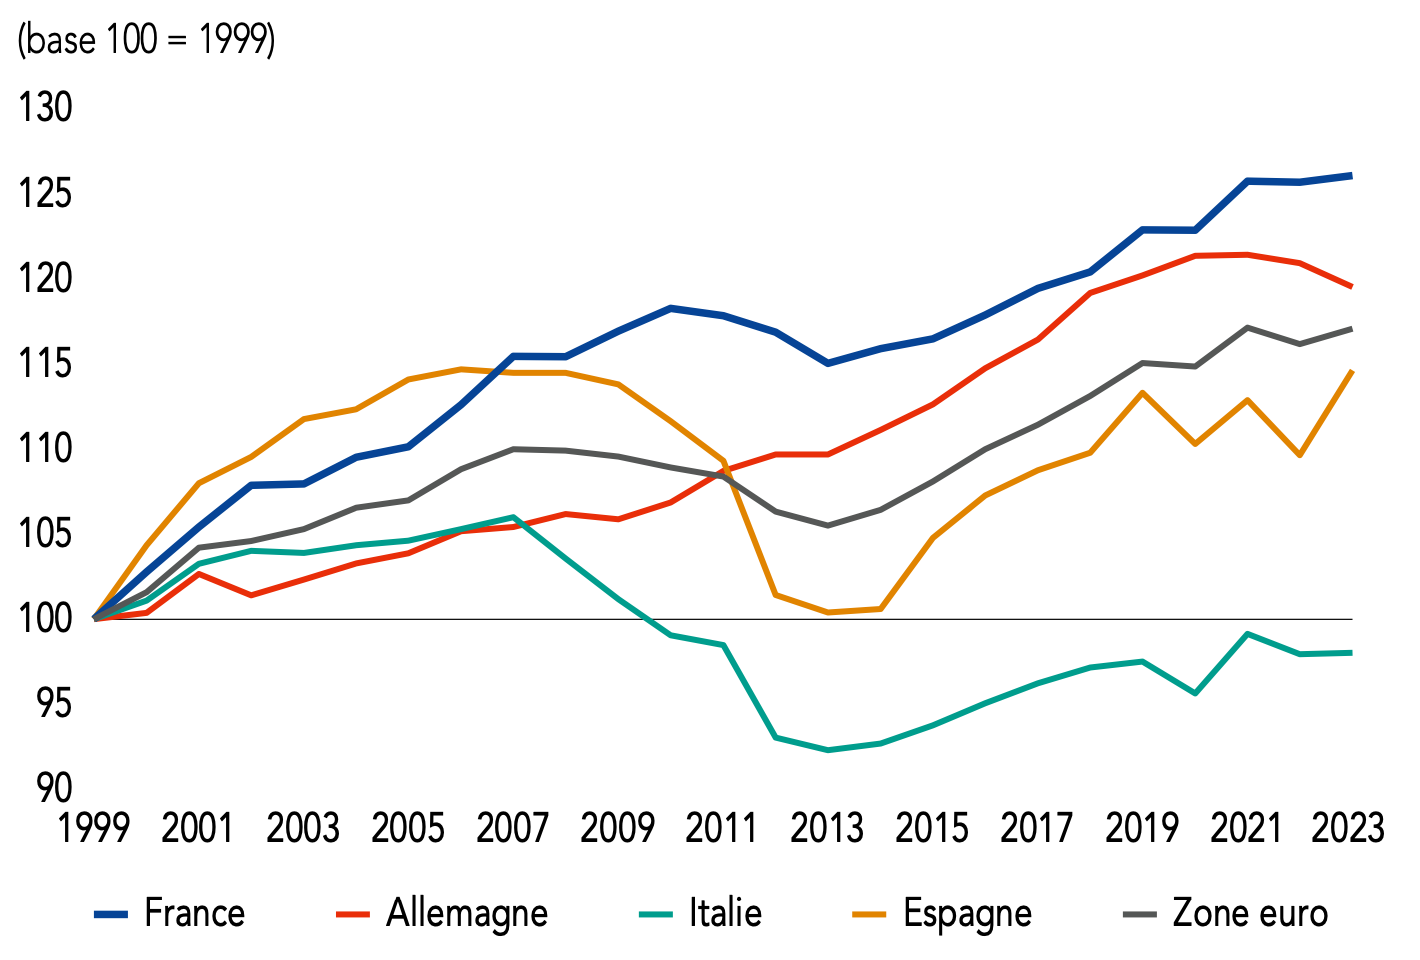
These official figures, widely relayed by the media, stand in significant contrast to many other indicators, which on the contrary tend to show a sharp decline in household purchasing power. According to the monthly household confidence survey carried out by Insee, household confidence reached a historic low in July 2022: the synthetic household confidence index stood at 80, a level it had only reached in June 2013, in the midst of fiscal austerity. Household consumption of goods, notably food, dropped considerably, much more than during the austerity period of 2012–13. In addition, surveys by Insee reveal an increase in material and social deprivation, notably regarding protein meals and heating. Other studies show that more and more French people report financial difficulties, with more than one in two having cut certain expenses in recent months. Politically, the issue of purchasing power has become the top priority for the French, much more than elsewhere in Europe. During electoral debates, Insee’s statistics on the evolution of purchasing power were often brandished by journalists, in front of leading political figures, to demonstrate that the purchasing power difficulties reported by the French were not based on objective facts. A graph in the letter from the Governor of the Banque de France to the President of the Republic (Figure 8, replicated in Figure 9) was widely relayed by the media during these debates1.
This gap between the official figures on purchasing power and “perceptions” does not date from the inflationary crisis of 2021–2024, but at least from the 2000s (Cnis (2006) ; Accardo et al. (2007) ; Moati and Rochefort (2008) ; Quinet (2008)), no doubt partly due to the rise in housing prices during that period (Geerolf (2022)). It widened significantly during the Yellow Vests crisis in 2018, where the gap between protesters’ perceptions and official data fueled numerous calls for better “pedagogy.” However, before questioning perceptions, should we not first make sure that the official figures on purchasing power are not themselves biased?
A monolithic, but distinctly French, definition of “purchasing power”: the “gross disposable income deflated by the household consumption deflator”
How should purchasing power be measured? For many years, Insee has offered a uniform—indeed, monolithic—answer to this question. It defines “purchasing power” based on a macroeconomic measure of gross disposable income (GDI), deflated by the household consumption deflator (Insee (2019)), as confirmed by a simple Google search or by looking at its economic dashboard. This indicator enjoys a privileged position within Insee’s statistics: it is published quarterly alongside the detailed national accounts—at the highest level of the statistical hierarchy, just after Gross Domestic Product (GDP)—as well as annually with the national accounts. For example, when publishing the detailed accounts for the first quarter of 2024, Insee headlined: “In the first quarter of 2024, GDP increased by 0.2% and household purchasing power rose by 0.5% (per consumption unit).” The quarterly and annual national accounts include a section devoted to “Income, purchasing power, and household accounts.” Because Insee is authoritative, other French official institutions (Banque de France (2024); France Stratégie (2023); OFCE (2022)) adopt this definition, as do educational resources such as Citéco, Faciléco, and ABC de l’économie.
According to Insee, “Statistics on purchasing power are drawn from the national accounts. These provide an overall picture of the country’s economic activity, harmonized at the international level.” (Insee (2014); Insee (2019)). In reality, however, national accounting—governed by internationally and European codified rules—provides no official definition of “purchasing power.” Publishing this indicator at the same level as GDP is a uniquely French peculiarity. At best, one can say that Insee’s purchasing power indicator is derived from two elements in the national accounts: on the one hand, households’ gross disposable income (GDI), a very familiar indicator to macroeconomists, and on the other, the household consumption deflator, far less well known than other price indices such as the national CPI or the European HICP. Moreover, the indicator lacks methodological rigor, as it relates two inhomogeneous concepts in the numerator and denominator. From a macroeconomic standpoint, households’ “gross disposable income” is not used solely for consumption but also for household investment in housing. In the national accounts, it is easy to verify in the household accounts that gross household saving (B8)—amounting to €81.1 billion in Q1 2024—serves both to invest in dwellings (P51) and to constitute financial savings (B9F), equal to €37.2 billion. There is therefore a form of inconsistency in the construction of this indicator, since the two terms do not refer to the same perimeter. The methodological manual of the European System of Accounts (ESA 2010) (Eurostat (2013)) explicitly notes that ratios built from national accounting indicators must be homogeneous2. The definition of purchasing power does not meet this requirement: contrary to what Insee claims, this measure of purchasing power does not genuinely stem from the national accounts, which define no official measure of “purchasing power.”
But above all, there is no reason to define “purchasing power” in such a monolithic manner. By definition, “purchasing power corresponds to the volume of goods and services that a given income can purchase.” Consequently, any definition of income and any price index may be used to calculate purchasing power rigorously. Thus, it is entirely possible to define purchasing power in terms of net wages, deflating them by the Harmonised Index of Consumer Prices (rather than by the national CPI, see Geerolf (2024a)). Purchasing power defined as “gross disposable income deflated by the consumption deflator” is sometimes considered more comprehensive because it encompasses all household incomes—not only wages but also social benefits (such as pensions), taxes, and capital income. In reality, however, including capital income has serious drawbacks, as explained later. Furthermore, the household consumption deflator supposedly has the advantage of accounting for owner-occupied housing, unlike the CPI and HICP, which is indeed a limitation of those indices (see Geerolf (2022)). Nevertheless, this price index structurally underestimates inflation because it is a “Paasche index,” among other issues arising from the use of this very particular price index.
An Underestimated Inflation by the “Consumption Deflator”
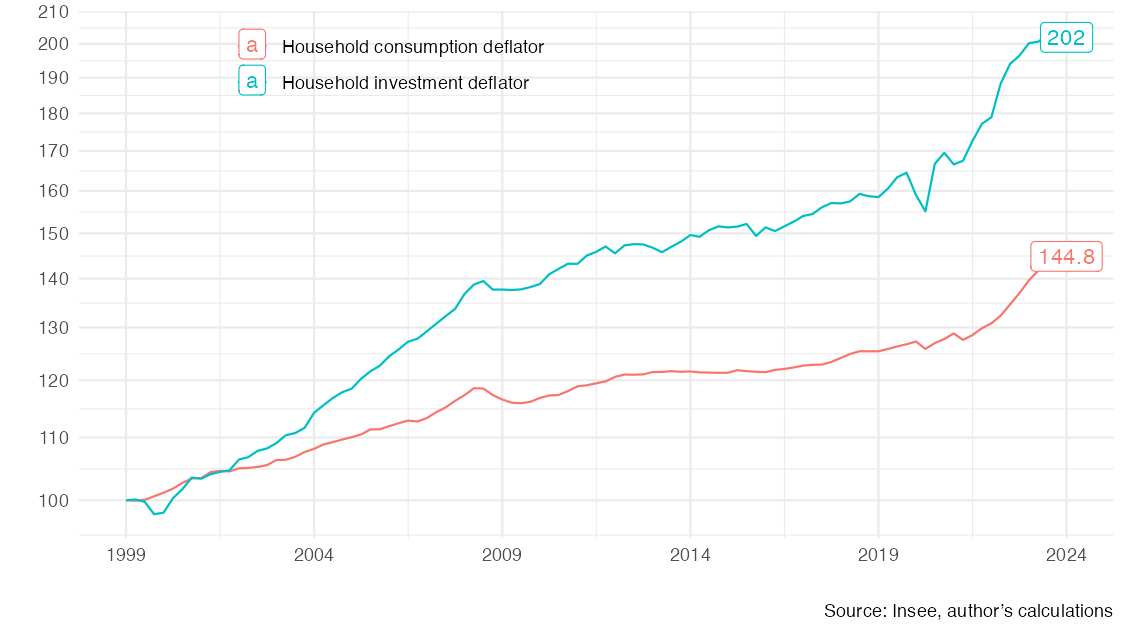
The official Insee indicator of “purchasing power” relies on a specific price index, namely the “household consumption deflator,” derived from national accounts. First, as previously mentioned, its use as the denominator to calculate purchasing power raises a consistency issue from the perspective of national accounting, since it is paired with gross disposable income as the numerator. Indeed, this index excludes household investment in new housing, even though such investment is financed out of disposable income. This constitutes a first source of underestimation of inflation, all the more so as, in the long run, the rise in new housing prices far exceeds the inflation measured by the consumption deflator. As illustrated by Figure 1, since 1999, inflation according to the household investment deflator has reached +102%, compared to only +44.8% for inflation measured by the consumption deflator3. If “purchasing power” were really defined in national accounts as “real gross disposable income,” consistency would require that this definition use an average of these two deflators in the denominator to deflate income.
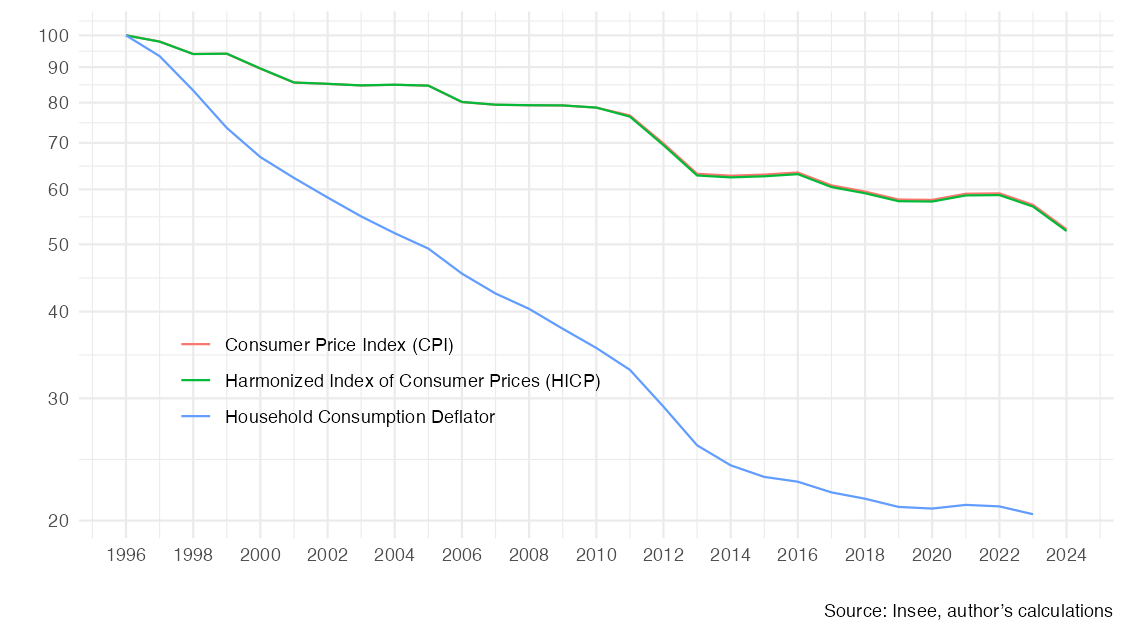
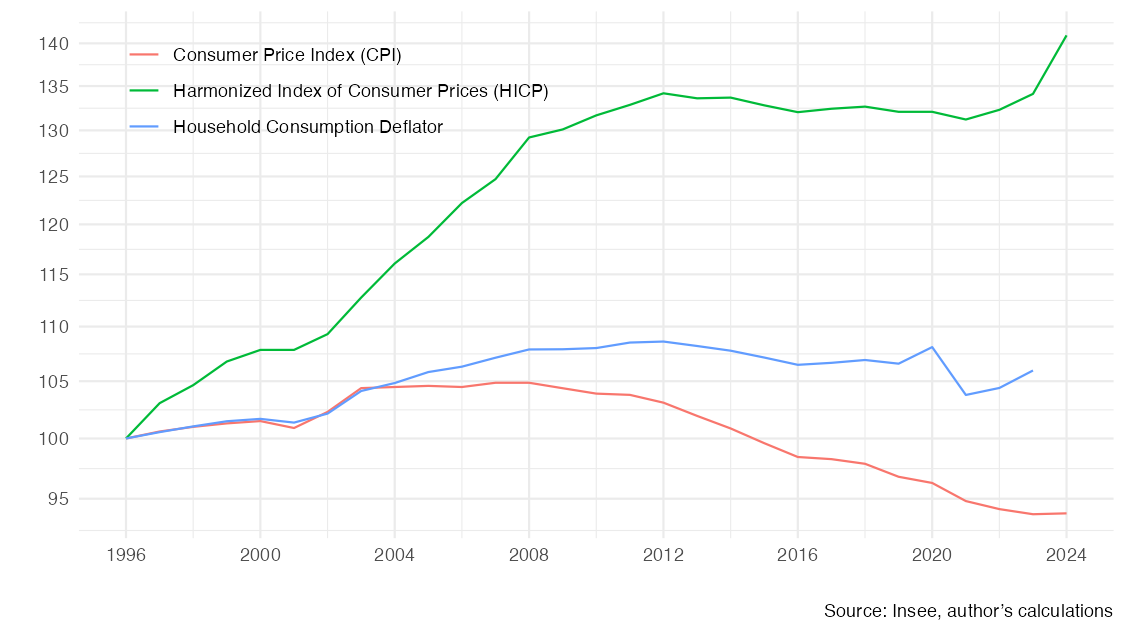
Second, the “household consumption deflator” is a Paasche index which, by construction, tends to systematically underestimate inflation4. In fact, it was not designed to measure inflation or purchasing power — which is the purpose of a consumer price index — but rather to compute the real counterparts of national accounts aggregates. The consumption deflator is a “Paasche index” (whereas consumer price indices such as the HICP or CPI are “Laspeyres indices”). The Paasche index principle is based on using end-of-period consumption quantities to weight the various components of inflation. Thus, when the price of a good rises, consumers adjust their behavior by switching to substitute goods, reducing the quantities consumed of the good in question at the end of the period. This adaptation means that the loss of utility for the consumer is underestimated, since the inflation of goods whose prices rise most is underrepresented. Yet this shift in consumption habits in response to price changes also entails a cost in terms of utility. Although the consumption deflator relies on inflation measures drawn from the Consumer Price Index (CPI) for its subcomponents, its aggregation method differs. Regarding Paasche indices, Berthier (2005) considers them the least relevant among the three main indices available (p. 26). This difference is particularly significant for many aggregates, notably when compared to the Harmonised Index of Consumer Prices (HICP) or to the CPI, for example in the communications sector (Figure 2). In health, too, one observes an underestimation by the deflator relative to the HICP, which is the correct reference point, unlike the CPI (Figure 4). Unlike the CPI, the HICP reflects the expenditures actually borne by households, in line with international methodological guidelines ((imf_ilo_oecd_eurostat_un_wb_consumer_2020?)), whereas the CPI also includes reimbursed health expenditures (see Geerolf (2024a)).
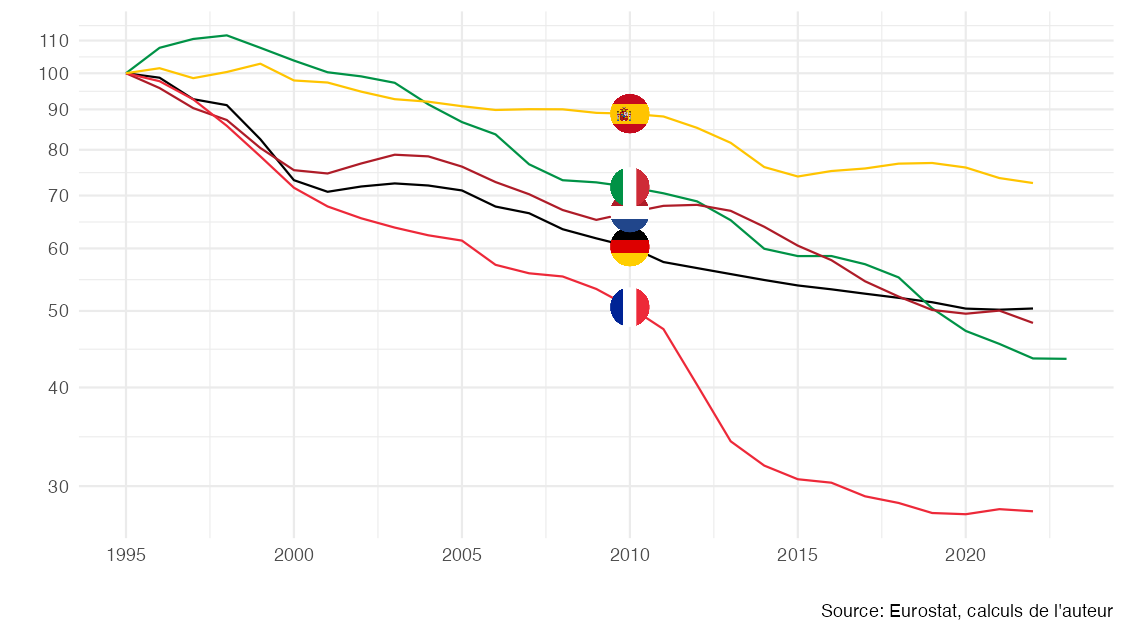
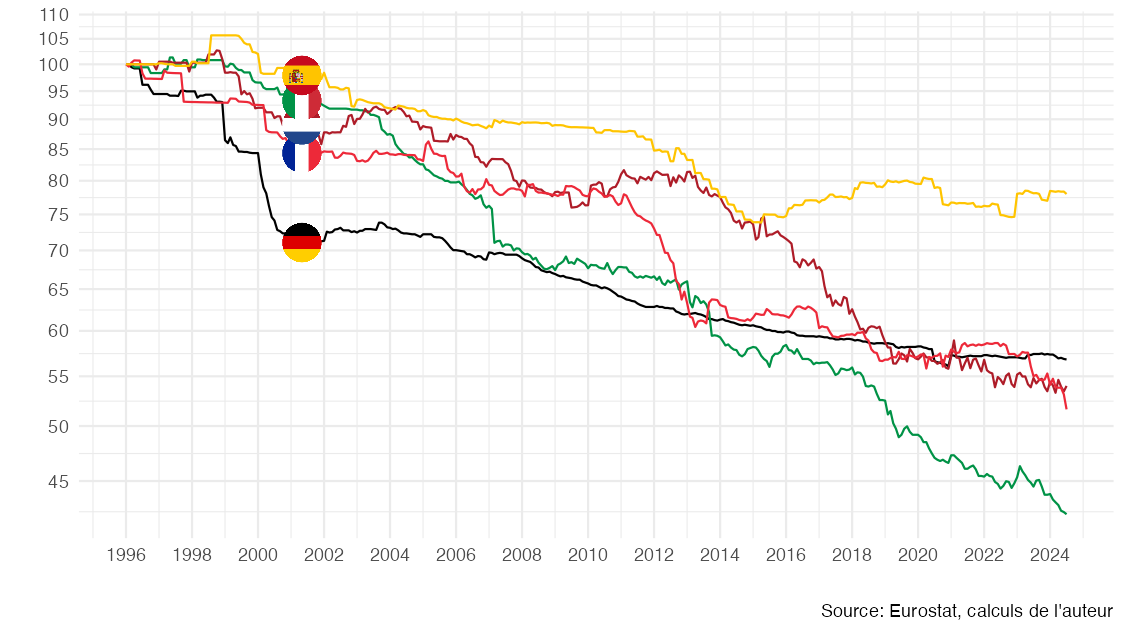
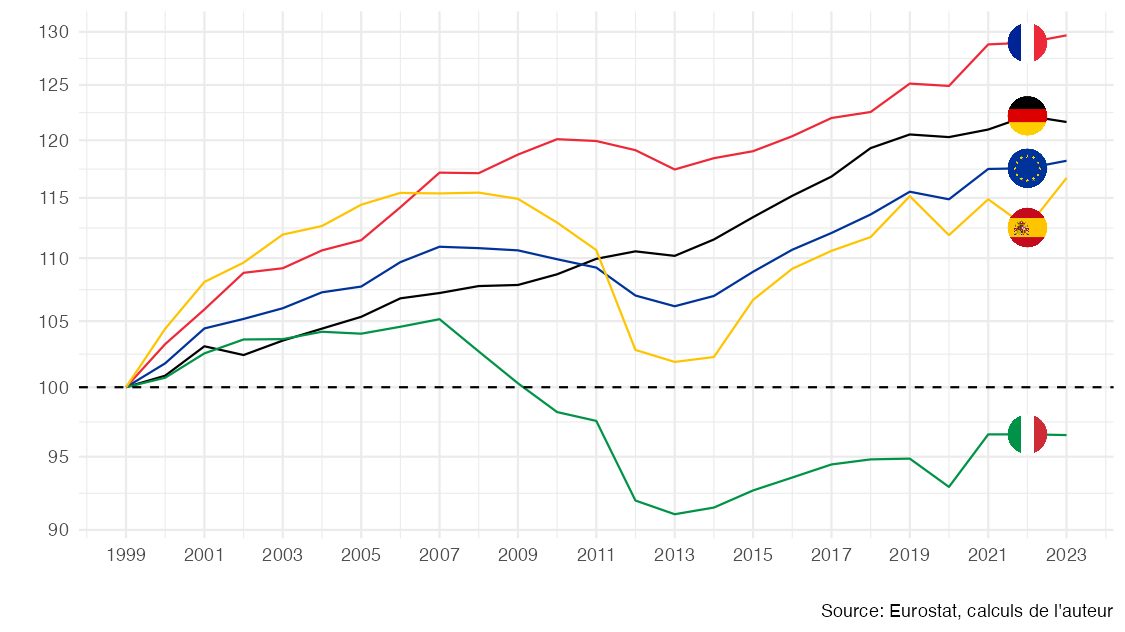
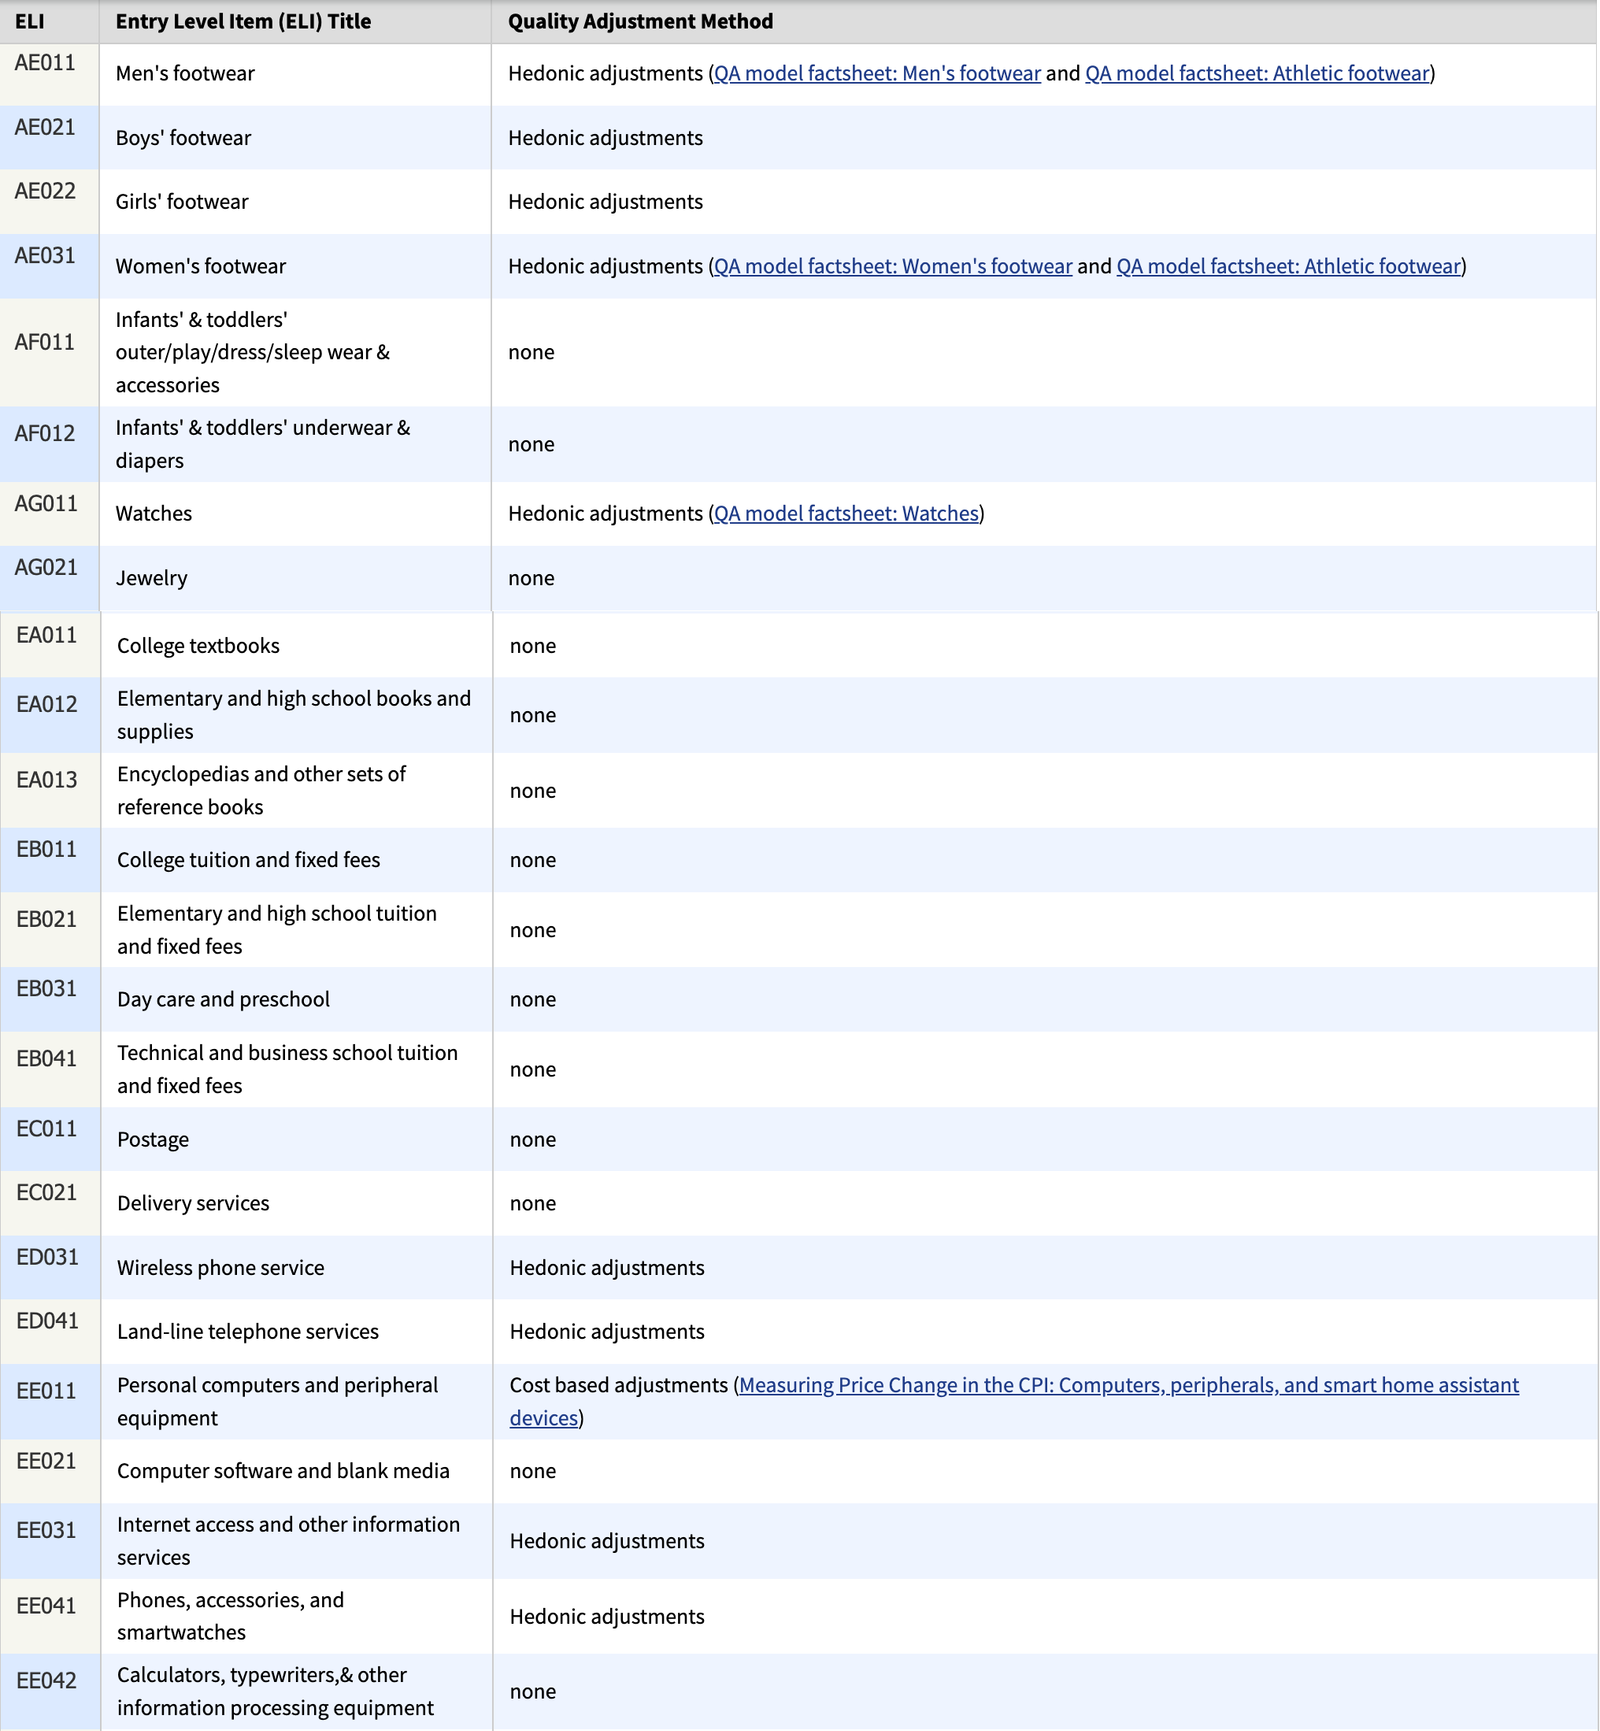
Third, and this is also a crucial point, quality adjustment methods are not the same in France as in other Western countries, whether in the United States or elsewhere in Europe. This is particularly visible in the communications services sector, as shown in Figure 3. The issue is not, as Philippe Herlin (2018) contends, to challenge the legitimacy of quality adjustment as such — a far too radical stance5. However, Philippe Herlin (2018) and later Emmanuel Todd (2020) are correct on one point: Insee overestimates the growth of purchasing power, at least relative to other statistical institutes, not because it incorporates quality adjustments, but because it assumes them to be greater than others do. This bias also appears in the HICP, making cross-country comparisons within Europe less harmonised than they may seem (Figure 5). This issue is amplified by the use of a Paasche index, as revealed by comparisons of national consumption deflators published by Eurostat.
There can be no perfectly objective measure of “quality adjustments,” and their proper assessment can ultimately lead to sterile philosophical debates: accounting for “quality adjustments” necessarily involves some element of judgment. It should be noted that, historically, critiques of quality adjustment have concerned both the possibility of overestimation and of underestimation, notably following the Boskin Report6. However, international harmonization of methods would be desirable, at least at the European level, especially when quality adjustments concern homogeneous imported goods such as mobile phones. As early as 25 years ago, Lequiller (1997) already recommended “pooling research resources on quality adjustments across European statistical institutes.” Yet Insee has acknowledged in several publications that quality adjustment methods still vary by country. For example, in a 2017 Insee economic report comparing France and Italy, Giraud and Quévat (2017) admitted that the deflator is underestimated in France relative to Italy, due to the method of volume/price splitting for telecommunications services (minutes, SMS, or MMS exchanged in France). Other Insee studies show that quality adjustments are larger in France than in Germany, both in CPI/HICP and in deflators. According to Aeberhardt et al. (2020), in the field of information and communication goods alone, the gap between French and German HICPs since 2000 amounts to more than 6 points per year for telephony and telefax equipment (including mobile phones) and nearly 3 points per year for audiovisual, photographic, and information-processing equipment (including computers and tablets). In that article and in others dealing with GDP comparisons, the significance of this difference is downplayed because the focus is on GDP effects, and these goods are imported — so the impact on imports cancels out that on consumption. However, for measuring purchasing power, this difference is crucial, since consumption obviously includes imported goods (see also Aeberhardt and Bidault (2018); Abdirahman et al. (2022)).
Studies comparing quality adjustments across countries remain rare, since only statistical institutes have the necessary data. Sweden’s central bank has highlighted very significant discrepancies, without access to ideal data (Tysklind (2020)). In France, publications on this issue have often been motivated by controversies, pushing Insee toward greater transparency (Jany-Catrice (2019)). Thus, following a controversy launched by Michel-Edouard Leclerc in the early 2000s, Guédès (2004) showed that quality adjustments reduced inflation by about 0.3 percentage points per year. However, to our knowledge, this estimate has not been updated since: in a blog post of February 4, 2020, responding to Emmanuel Todd (2020) on the issue of the 6% weight given to housing in the CPI, Insee promised a forthcoming note on the subject on its blog7, but to our knowledge it has not been published to date. One promising avenue would be to make quality adjustment methods more transparent, as also recommended8 in Eurostat’s methodological manual (Eurostat (2018)), following the model of the U.S. Bureau of Labor Statistics (BLS). Compared to the United States, it would appear that France relies almost exclusively on the overlap method, which tends to overestimate quality gains9, whereas the United States more often employs hedonic methods (as does Germany). In the context of ecological transition, this overlap method will imply that more expensive products purchased by consumers (sometimes under regulatory constraint), such as electric vehicles or more energy-efficient housing, will be treated as higher-quality new products — even though they may in practice reduce purchasing power and living standards. This issue was already raised in the thematic “Inflation” report of the Pisani-Mahfouz report (Dees et al. (2023)). It is indeed unlikely that the financial efforts devoted to energy-efficient renovations will, on average, yield energy savings sufficient to justify the initial investments, as implicitly assumed by this inflation adjustment method. Other divergences exist among European countries, for instance the introduction in France since 2020 of “scanner data,” which contributes to measuring lower inflation. In the eurozone, only Italy, Belgium, the Netherlands, and Luxembourg have also adopted it. Overall, it appears that the comparability of “harmonized” CPIs is more limited than claimed, and statistical institutes could communicate much more on these issues.
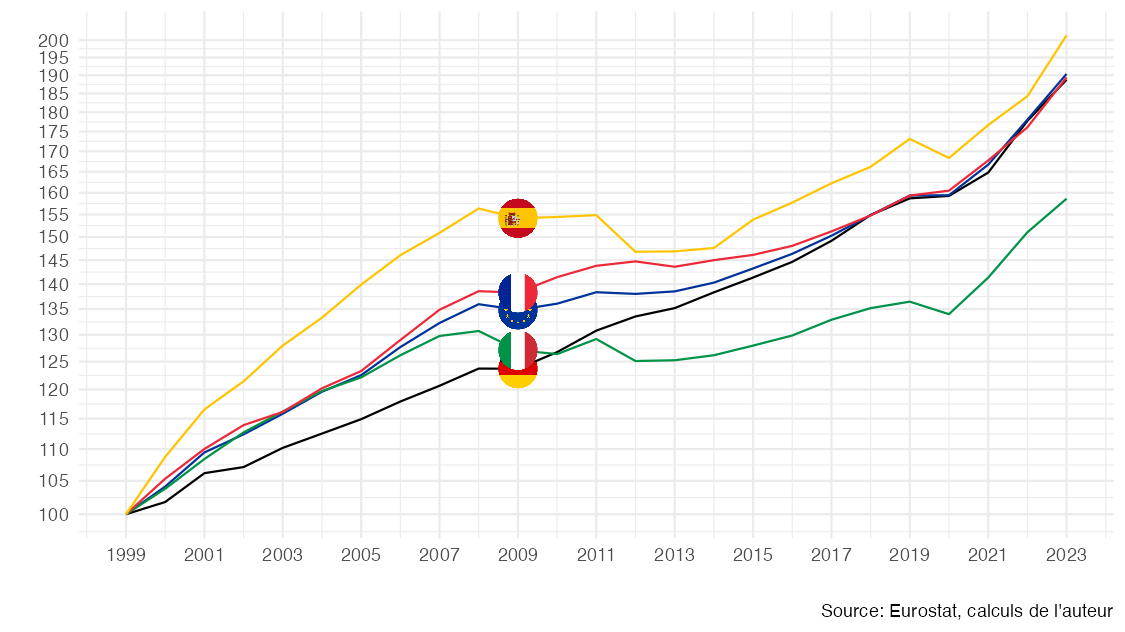
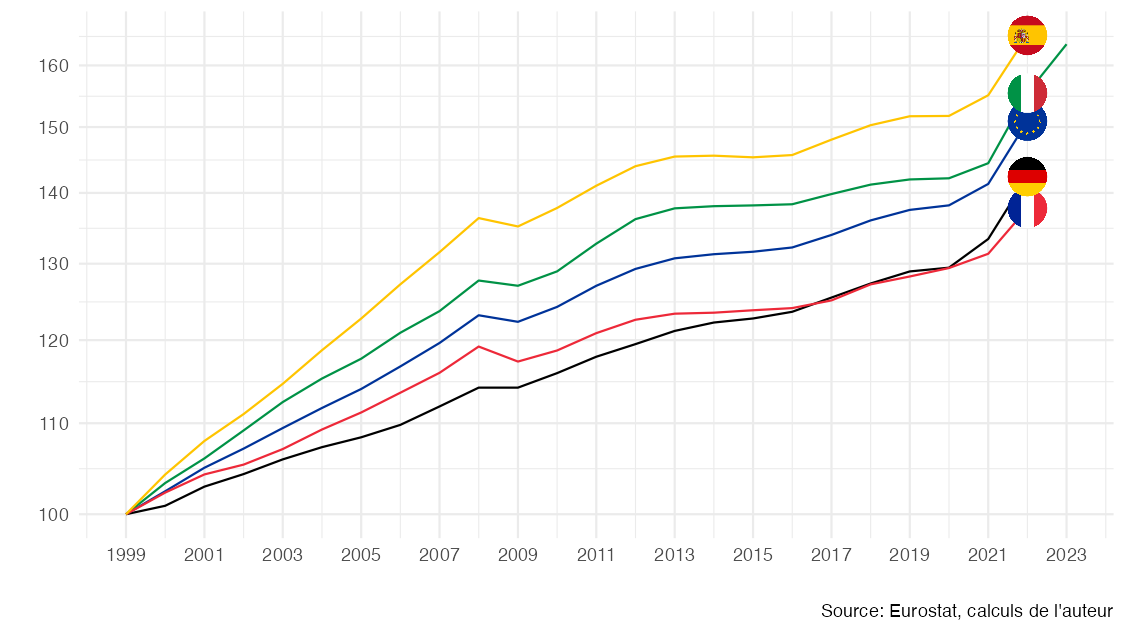
To conclude, these multiple biases in the measurement of inflation as “the evolution of the household consumption deflator” imply that the official figures of purchasing power trends, such as those presented in the letter of the Banque de France reproduced in Figure 8, are unfortunately not comparable. It is indeed worth noting that the stronger increase in purchasing power in France does not stem from a more dynamic rise in household incomes in euros (Figure 6) — quite the opposite — but from a supposedly weaker rise in the consumption deflator (Figure 7), which explains the more favorable evolution of the ratio (Figure 9). Methodological differences in measuring the evolution of the consumption deflator therefore prevent meaningful cross-country comparisons within Europe and from asserting: “Contrary to what our citizens might perceive, the purchasing power of disposable income per capita has significantly increased in France.”
An Overestimated Income by “Gross Disposable Income”
While most criticisms of Insee’s official measurement of purchasing power concern the price index used in the denominator, the “gross disposable income” (GDI), used in the numerator, also contains certain biases. In periods of high inflation, as since the end of 2021, the main source of bias is linked to the “inflation tax,” which leads to an overestimation of GDI growth. Indeed, capital income appears to rise sharply due to higher nominal interest rates, a consequence of central bank actions aimed at curbing inflation: for example, interest from Livret A savings accounts, sustainable development and solidarity savings accounts, euro-denominated life insurance, term deposits, etc. This is all the more true since many of these investments are regulated and their rates increase mechanically. However, this does not take into account the fact that inflation devalues financial wealth stocks, which are most often fixed in nominal terms and not indexed to inflation. Thus, we arrive at a paradox: capital income, as measured in GDI, seems to increase even as the real interest rate decreases. This problem stems from conventions firmly rooted in national accounting, but it is crucial to keep it in mind when interpreting purchasing power statistics during this period — for more details on this “inflation tax,” Geerolf (2024b) explains why it leads to an overestimation of disposable income growth and therefore of purchasing power in Insee’s sense — symmetrically, the budget balance is underestimated.
The fact that wealth income is highly concentrated within a small segment of the population also distances the evolution of GDI from the experience of the average French household. For example, net dividends paid to households have risen sharply in recent years, but dividend receipts are very unequally distributed across the population. Similarly, imputed rents of owner-occupiers (and landlords) are distributed unequally, just like real estate wealth itself. It is also important to note that mortgage repayments are accounted for in gross disposable income only at their nominal value. This approach is limited from an economic perspective, since what truly matters is the real interest rate, not the nominal rate. This discrepancy contributes to distorting the assessment of households’ real purchasing power, this time in the opposite direction, but the effect of the “inflation tax” in raising the income of mortgage borrowers is quantitatively less significant than the bias from the taxation of financial wealth: the reason being that part of public debt is held, directly or indirectly, by households.
Finally, GDI, as a macroeconomic aggregate, is influenced by many other factors, making its interpretation as a “purchasing power” indicator difficult. Households must renovate their homes to maintain their real estate investment, and pay condominium fees, which argues for the use of net disposable income (NDI) — i.e., reduced by consumption of fixed capital — rather than GDI. This is the preferred indicator in Germany. GDI also includes imputed (non-monetary) income such as insurance services for 3.7% of GDI (Billot and Bourgeois (2019)), which one can understand is not “felt.” Finally, GDI is increased by “structural effects”: population aging mechanically raises average wages, as does a higher level of education, even though, at equal age and degree, wages may stagnate or even decline. This is why wage trends in euros are often adjusted to account for such structural effects, which GDI trends, by construction, do not do. It is worth noting in this regard that these “constant structure” wage indicators are now published less regularly by the Statistical Institute than they were a few years ago.
Conclusion: how to measure purchasing power?
Official figures show an increase in purchasing power, even during the inflationary episode of 2021–2024, confirming that they “are innocent people who, under solicitation, under torture, very quickly confess what is asked of them.” “Even if it means retracting later,” added Alfred Sauvy (1965): a rational examination of Insee’s indicator reveals that it overestimates by construction the rise in purchasing power: inflation is underestimated, while income growth is overestimated. Naturally, the analysis presented here would require further studies to refine the conclusions: precisely evaluating the biases linked to quality adjustments would require research that only the statistical institute is capable of conducting, given access to the necessary data. In France, information remains particularly lacking for researchers outside Insee concerning “pure inflation” compared to quality adjustments, as well as on the adjustment methods used for each category of goods. U.S. public statistics from the BLS stand out for their greater transparency.
How to measure purchasing power? There cannot exist a universal measure of “purchasing power” sufficiently consensual to impose itself as the sole reference, and to serve as an official definition. Rather than monolithically defining “purchasing power” as “gross disposable income deflated by the household consumption deflator” and closing the debate on the subject, Insee should maintain a plurality of purchasing power indicators, and add at least the purchasing power of net wages adjusted by the HICP (and not the CPI, see Geerolf (2024a)), which clearly shows a decline in purchasing power over 2021–2024. Historically, Insee in fact allowed itself to speak of “purchasing power” in the sense of “wage purchasing power.” In any case, the use of a Paasche index as a price index, whose growth underestimates inflation by construction, should be avoided, unless one admits that figures for changes in purchasing power are upwardly biased by construction. Ideally, the HICP should be replaced by an index built like the HICP but including the consumption of housing services of owner-occupiers (see Geerolf (2022)). Similarly, quality adjustments should be more harmonized in Europe: the French HICP or CPI should include quality adjustments at the same level as other European countries, on average, for relatively homogeneous goods and services (such as mobile phones). Until such changes are implemented, it must be kept in mind that European comparisons of purchasing power based on official Eurostat/Insee figures are not valid, since methodologies are not harmonized.
In the immediate term, it is imperative and urgent to diversify the official definitions of purchasing power, without claiming a continuous increase, even in the midst of the most severe inflationary crisis in decades. It is also necessary to stop asserting, as was done during the latest European election campaigns and then the early legislative elections of June 2024, that France is the European country where purchasing power has risen the most over the long run, since no comparable data currently allow such a statement. This concerns the credibility of Insee, of public statistics in France and Europe as a whole, but also the trust that citizens can legitimately place in our institutions and in science.
Bibliography
Appendix: Other data
Footnotes
For example, this Figure 8 was extensively mentioned by the Governor of the Banque de France in a morning interview on France Inter on April 23, 2024, one month before the European elections: “On average we have more gains in purchasing power, 26% over 25 years, than the European average and, it’s true, than the Germans… I know I am going to surprise a number of listeners by saying this, but these are not Banque de France figures, they are figures established by the statistical institutes.” Sonia Devillers then very aptly asked: “Why don’t the French feel this? Why does the surge in voting intentions for the far right so massively reflect anger, and anger about purchasing power? Are the French idiots who don’t understand anything?” The rest of the interview is also very interesting and revealing, with the Governor discussing the apolitical nature of these purchasing power figures, asserting that the average evolution of purchasing power indeed corresponds to what the vast majority of French people experience, etc. During the legislative debate of June 25, 2024, the presenter challenged the statements of the representative of the Nouveau Front Populaire about the decline in purchasing power, using these same figures, also citing Insee and the Banque de France: “What you are saying is factually incorrect. The purchasing power of the French, on average, according to Insee and the Banque de France, has increased by 26% over the past 24 years. That is much more than in the Eurozone.” Such examples multiplied in recent months and weeks, while in opinion polls, the issue of purchasing power topped the list of factors determining the French vote for the European elections on June 9, 2024, and then for the legislative elections of June 30 and July 7, 2024.↩︎
Section 1.23 provides several examples of homogeneous ratios:
“The systematic use of these common concepts within national accounts and other systems of economic and social statistics makes it possible to obtain coherent measures. It allows, for example, the calculation of various ratios such as productivity, expressed for instance by value added per hour worked (this indicator requires that the concepts of value added and hours worked be consistent).” The manual adds: “Internal consistency between concepts allows for the calculation of balancing items.”↩︎The codes are available here: https://github.com/Francois-Geerolf/measuring-the-purchasing-power↩︎
This key point is most often omitted (Insee (2019)), while more minor differences with the CPI are highlighted: “The deflator of final consumption expenditure differs somewhat from the growth rate of the consumer price index (CPI), mainly because its scope is broader than that of the CPI. It notably covers the consumption of imputed housing services by owner-occupier households, financial intermediation services consumed by households, life insurance services… Furthermore, for certain specific products such as non-life insurance, the methodology followed by national accountants differs somewhat from that of the CPI…” When it is mentioned, the fact that a Paasche index leads to underestimating inflation is not recalled (Billot and Bourgeois (2019)). One exception can be noted in 1999 in a methodological manual (Insee (1999)): “The implicit indices of national accounts are indeed Paasche indices, whereas the CPI is a Laspeyres index.”↩︎
Philippe Herlin’s book contains numerous other approximations and inaccuracies, not always in line with his argument. For example, he failed to notice that the index used to measure purchasing power is not the Consumer Price Index, but the consumption deflator — a Paasche index that therefore underestimates inflation even further.↩︎
The Boskin (1996) report, however, had an explicit political aim: to reduce the measured inflation rate in order to limit the increase in social benefits. “The debate over the CPI was, in reality, a political debate about how, and by how much, to reduce the purchasing power of social benefits” (Mankiw (1996)). It should be noted, moreover, that a number of the Boskin Report’s recommendations had already been implemented in France; it was met rather coolly by Insee experts (see Lequiller (1997)).↩︎
“Another recurring and equally under-documented criticism concerns the neutralization of ‘quality adjustments’ in the CPI. A note on this topic will be published shortly on this blog.” (Ourliac (2020))↩︎
Section 6.4.5 states: “It is important that users of indices have access to metadata, i.e. information on the quality adjustment methods applied. The choices and performance of methods and conventions in quality adjustment and replacement can have a crucial impact on the comparability and interpretation of results. Simple descriptive statistical tables, showing the frequency of quality adjustments by product category and by quality adjustment method, may be useful. The methods used to adjust specific product groups should be described in detail in the HICP inventories.”↩︎
New mobile phones are more expensive because they are higher quality but also for reasons related to the marketing cycle of products: the latest model is sold at a higher price than the previous one, for reasons of price discrimination.↩︎