The Share of Inherited Wealth in France
Revisiting Flow-Based Estimates
Motivation
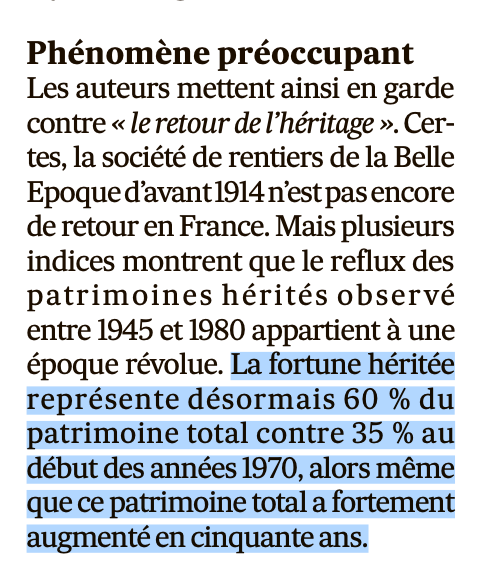
“60% of wealth is inherited”
- Dherbécourt et al. (2021) (CAE): “la fortune héritée représente désormais 60 % du patrimoine total contre 35 % en moyenne au début des années 1970”.
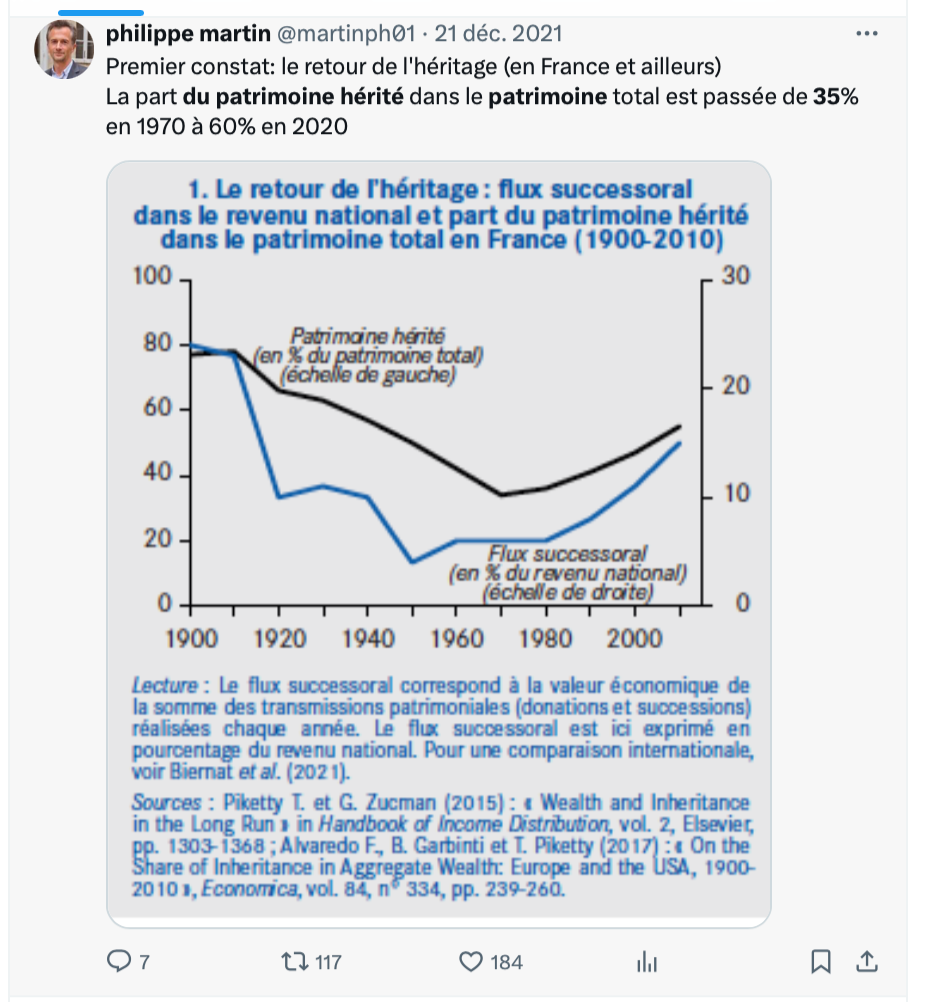
A figure repeated everywhere

Also by the CAE itself
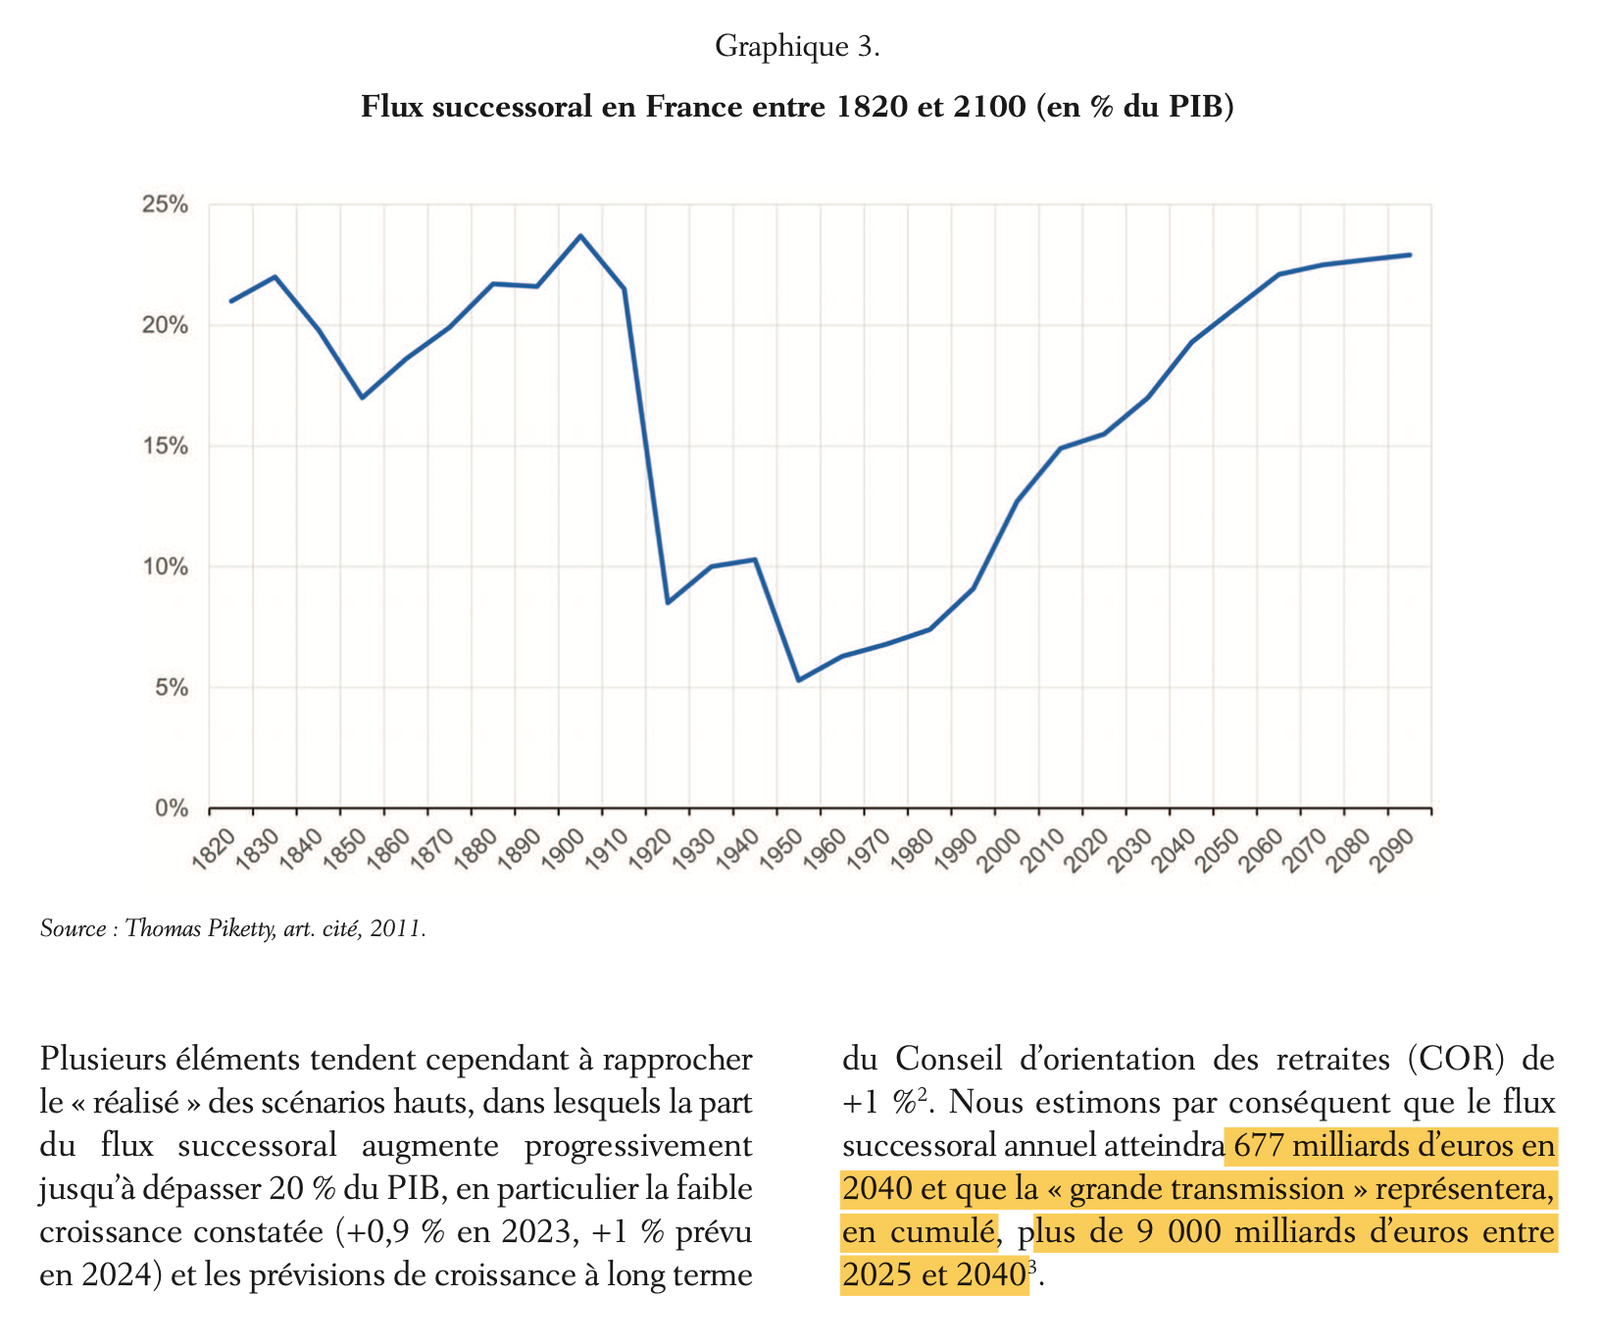
… and paired with a “great transmission” of €9,000bn
Where do these figures come from?
Share of inherited wealth: Piketty and Zucman (2015) and Alvaredo, Garbinti, and Piketty (2017) (AGP), “simplified definition”: compare inheritance flows and saving flows over the previous 30 years.
Inheritance flow: Piketty (2011), “close to 15%” of national income in 2008.
This paper: replicate exactly, then make each assumption explicit (as in Auten and Splinter 2024; companion paper Geerolf 2026).
A theoretical construct, not a statistic
No French data source links current wealth to inheritances received.
Surveys: reported inheritances = 21–29% of the estimated flow → discarded by AGP.
PPVR (micro) definition: Paris before 1927 only.
Simplified definition: inferred from two aggregate flows, assuming
same returns and capital gains for inherited and self-made wealth;
same saving propensity whatever the source of income;
flows of the previous 30 years – no more, no less – are what matters.
The inheritance flow itself is not observed after 2006.
Main result
Main results in numbers
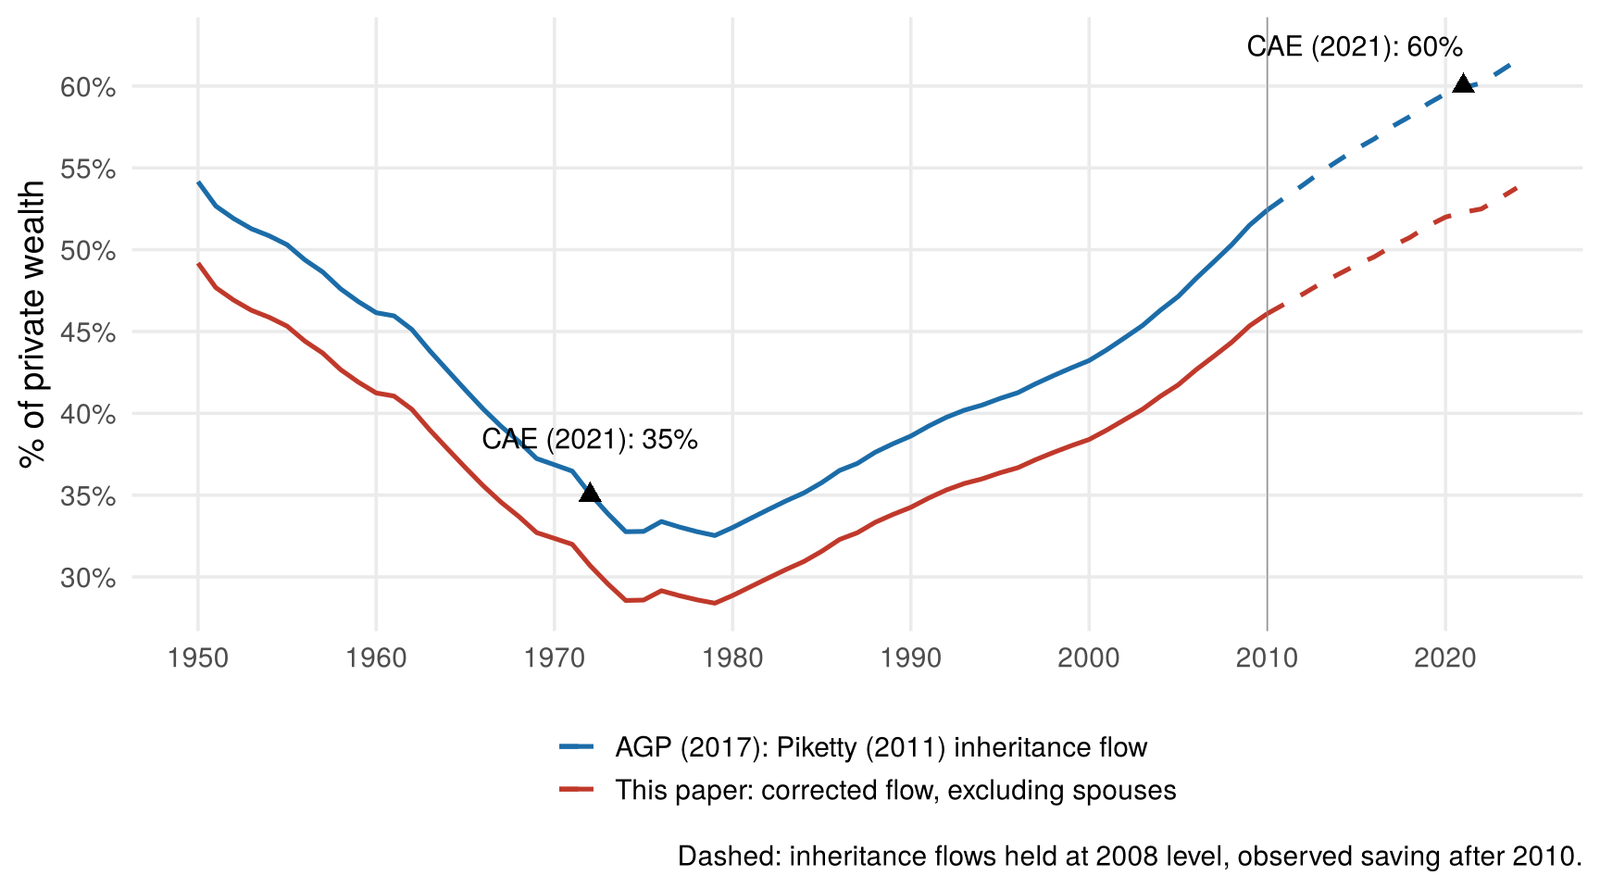
Published series: 36.9% in 1970, 52.4% in 2010 (last year; flows observed up to 2008). The CAE chart: ~55% in 2010.
60% requires holding the 2008 flow (14.5% of NI) for 15 years: crossed in 2022.
This paper (gifts corrected, spouses excluded): 46.1% in 2010, 52.3% in 2021 (extrapolated); 32.4% in 1970.
Cumulation window: 2010 share between 37% and 54% across specifications. With 50 years or more: no increase since 1970.
Great transmission: €9,059bn uses a share of national income applied to GDP, (+18%), and a rise to 23%; about €4,700bn with this paper’s flow.
The simplified definition
Three definitions
Kotlikoff–Summers (1981): life-cycle wealth from age profiles, residual = transfers → 81% (US, 1974). Modigliani (1986, 1988): uncapitalized bequest flow over 30 years → 15–20% (US, 1962). Gap mostly from definitions (return on inherited wealth).
Both count intergenerational transfers only: spouses excluded.
PPVR (Piketty, Postel-Vinay, and Rosenthal 2014): inherited wealth = min(current wealth, capitalized inheritance). Needs micro data over two generations: Paris, 1872–1927 only (rentiers: 10% of population, 70% of wealth). French “PPVR” series = extrapolation, “65–75%” in 2010.
Simplified definition (AGP), the one in the CAE note: \[ \varphi = \frac{b_y + \varphi \alpha s}{b_y + s} \quad\Longleftrightarrow\quad \varphi = \frac{b_y}{b_y + (1-\alpha)s} \] with 30-year averages of \(b_y\) and \((1-\alpha)s\).
Exact replication
\[ \varphi_t = \frac{\sum_{s=t-30}^{t-1} b_{ys}}{\sum_{s=t-30}^{t-1} \left[b_{ys} + (1-\alpha_s) s_s\right]} \]
Reproduces the published series to machine precision (3e-16).
Inheritance flow = economic flow of Piketty (2011), held at 14.5% from 2009 to 2019; saving held at 2010 level.
| 1970 (avg. 1940-69) | 2010 (avg. 1980-2009) | |
|---|---|---|
| Inheritance flow (% NI) | 6.7 | 8.6 |
| Net private saving (% NI) | 14.1 | 10.4 |
| Net capital share (%) | 19.5 | 24.5 |
| Labor-income saving (% NI) | 11.4 | 7.8 |
| Share of inherited wealth (%) | 36.9 | 52.4 |
Where does “60%” come from?
Genealogy of a number
| Source | Statement | Underlying |
|---|---|---|
| AGP (2017), abstract | “50–60% (and rising) since around 2010” | Europe; France 52.4% |
| PZ (2015), AGP Fig. 3 | “about 60–70% in the early 21st century” | Mostly PPVR extrapolation |
| CAE (Dec. 2021) | “désormais 60 % […] contre 35 %” | Own chart: ~55% in 2010 |
| P. Martin, CAE (Dec. 2021) | “35% en 1970 à 60% en 2020” | Same chart |
| Les Echos (Dec. 2021) | “60 % […] contre 30 % en 1970” | CAE |
| F. Jean-Jaurès (2024) | “désormais 60 % […] contre 35 %” | CAE |
| franceinfo (Oct. 2025) | “aujourd’hui cette part est de 60 %” | – |
The 2010 figure is 52%; 60% is an extrapolation
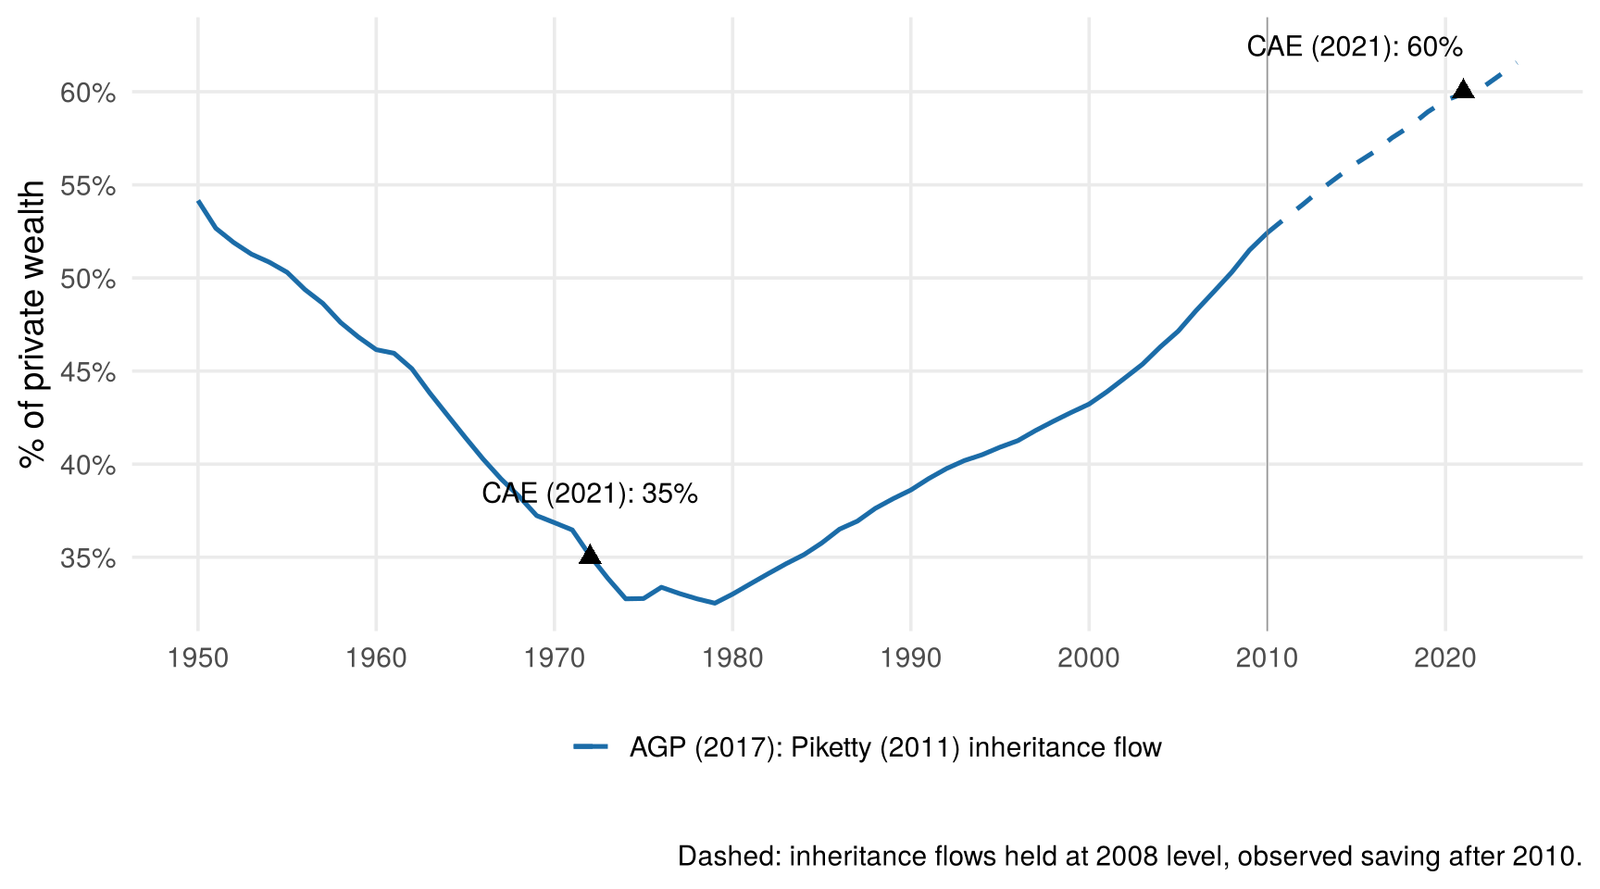
File: 57.3% in 2019 with flows and saving frozen; 59.9% in 2021 with observed saving.
No inheritance data published since 2006: “60% today” assumes the 2008 flow (housing boom peak) for 15 years.
The inheritance flow
Inputs: inheritance vs. labor-income saving
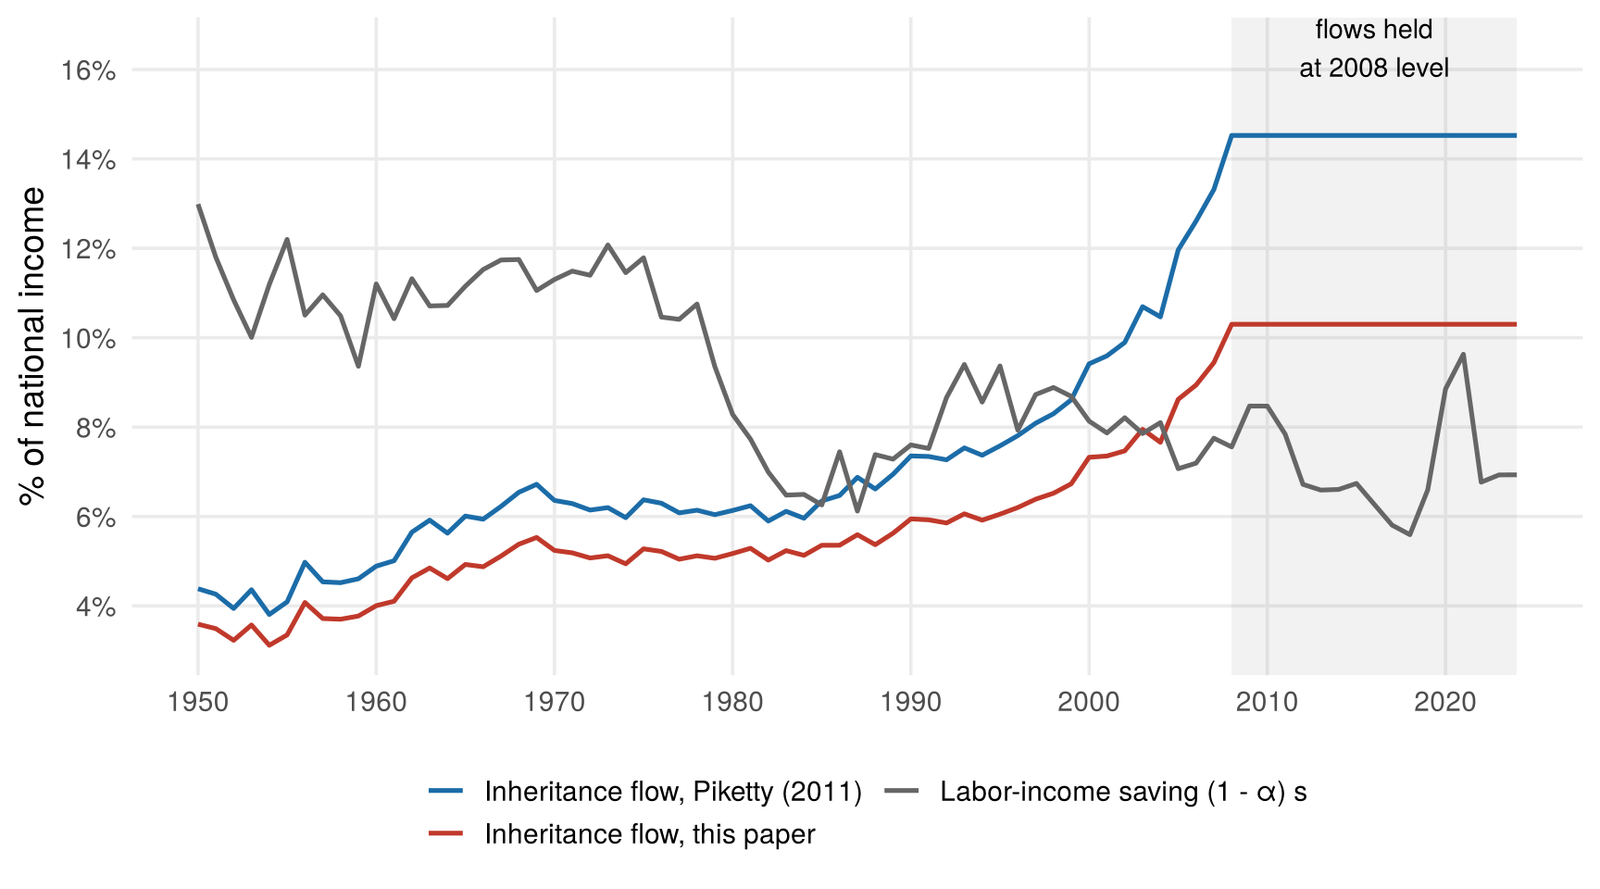
(1) Gifts: corrected inheritance flow
Companion paper (Geerolf 2026): gifts overstated in the 2000s
2006 includes a cash-gift scheme that ended in December 2005;
benchmark years for gifts all coincide with temporary tax incentives;
recorded gifts upgraded as if they contained life insurance.
Economic flow: 9.6% in 2006 and 11.1% in 2008, instead of 12.6% and 14.5%.
Share of inherited wealth: 48.0% in 2010 instead of 52.4%; +13.6 points since 1970 instead of +15.6.
Surveys: self-reported inheritances = 21–29% of the economic flow [AGP, Table 1]: underreporting, or an overstated economic flow.
(2) Spouses: not intergenerational, counted twice
The flow includes bequests to surviving spouses: transmitted again to children a few years later → same wealth counted twice within 30 years.
Excluded by Kotlikoff–Summers (“distant in age” transfers only), by Modigliani (subtracts husband-wife transfers), and by the CAE itself for lifetime inheritances (“excluding spousal transfers”).
Piketty (2011): spouses “about 10%” of the estate flow, excluding them “would make little difference”. CPO: 17.9% of bequests in 2006.
This paper: exclude 10% of bequests (conservative); 17.9% in sensitivity.
Share of inherited wealth: 46.1% in 2010 (vs. 52.4%), 52.3% extrapolated to 2021 (vs. 59.9%).
Methodological choices
Why 30 years?
AGP: \(H\) = “average generation length, that is, the average age at which parents have children”.
But what matters is how long inherited and self-made wealth stay with the living:
heirs inherit at about 50 (Dherbécourt et al. 2021) and live 30+ more years;
a 70-year-old saver’s wealth reflects 40–50 years of saving.
Deviations assumed to “balance each other”: not tested.
The window drives the result
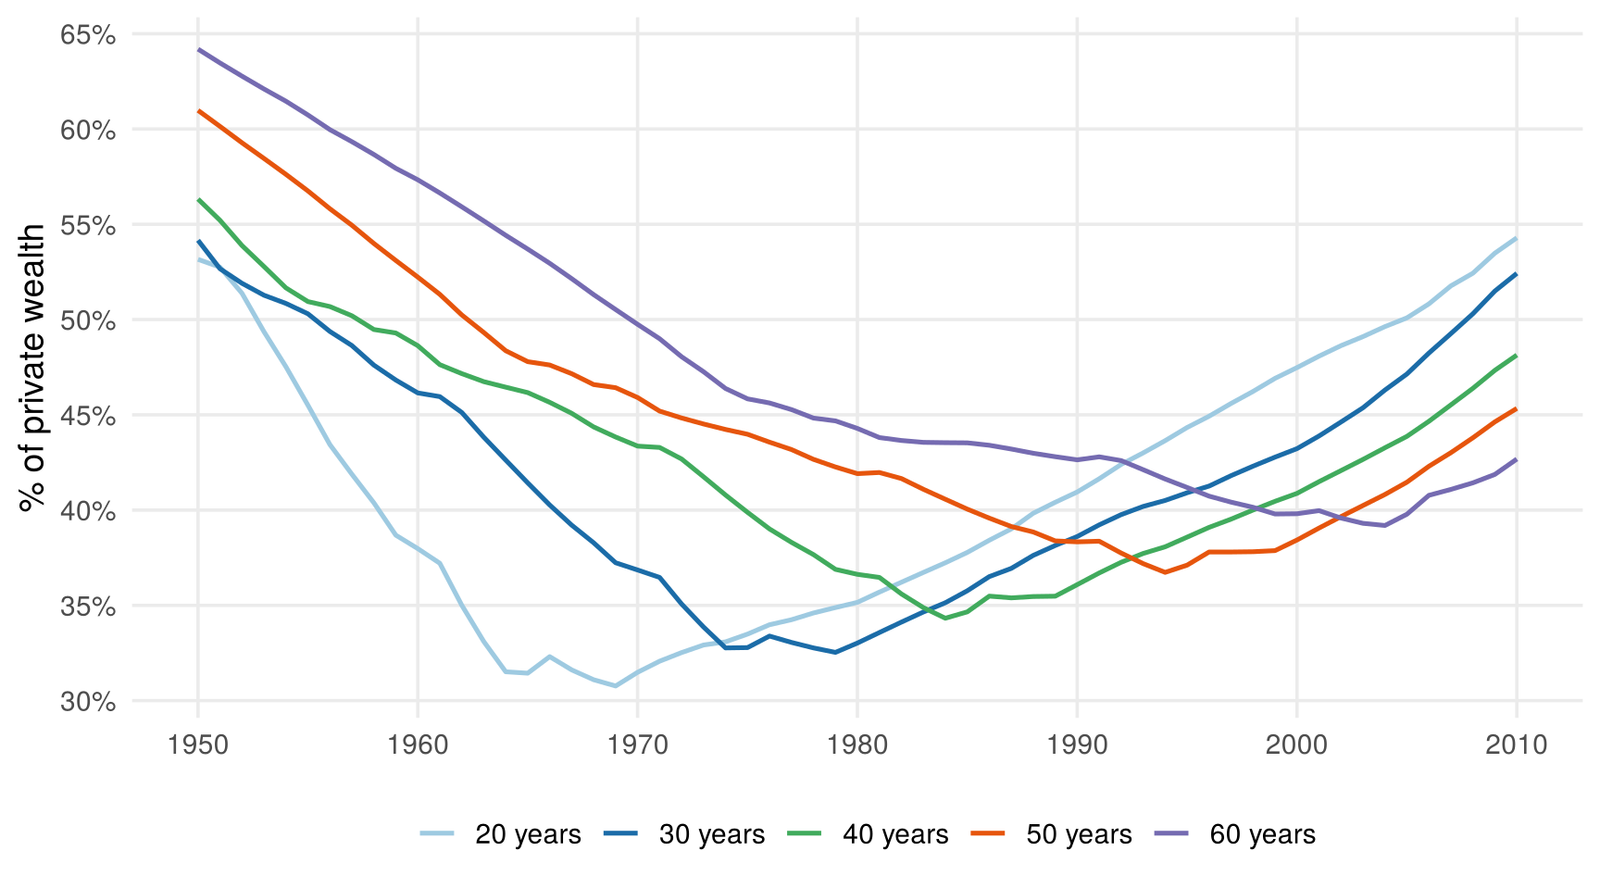
2010: 54.3% (20y), 52.4% (30y), 48.1% (40y), 45.3% (50y), 42.7% (60y).
1970 vs. 2010 with 50 years: 45.9% vs. 45.3%; with 60 years: 49.7% vs. 42.7%.
Other choices
Capitalization: the “full formula” capitalizes at \(r-g\), the series does not. Older flows are mostly saving → capitalizing lowers \(\varphi\) (2010: 51.4% at 2%).
Capital gains: \(b_y = (1+v)\mu m\beta\) embeds capital gains up to transmission (\(\beta\): 298% in 1980 → 563% in 2008; capital gains \(\approx\) 1/4 of 1970–2010 wealth growth, Piketty and Zucman (2014)); saving flows do not.
Gifts brought forward by tax incentives raise \(\varphi\) during the transition.
“Lower bound”? Based on AGP’s comparison with a PPVR series extrapolated from Paris 1872–1927; PPVR (2014) do not compare with the simplified definition. Several biases go the other way.
Sensitivity analysis (%)
| Assumption | 1970 | 2010 | Change | 2021 (extrap.) |
|---|---|---|---|---|
| AGP (2017) | 36.9 | 52.4 | 15.6 | 59.9 |
| (1) Gift corrections only | 34.4 | 48.0 | 13.6 | 54.1 |
| (2) + excl. spouses, 10% (preferred) | 32.4 | 46.1 | 13.7 | 52.3 |
| (2’) + excl. spouses, 17.9% (CPO) | 30.6 | 44.5 | 13.8 | 50.7 |
| (2) with 20-year window | 27.4 | 47.3 | 20.0 | 56.7 |
| (2) with 40-year window | 38.5 | 42.2 | 3.6 | 50.5 |
| (2) with 50-year window | 41.0 | 39.6 | -1.4 | 46.8 |
| (2) with 60-year window | 44.8 | 37.2 | -7.6 | 44.0 |
| (2) capitalized at 2% | 33.3 | 45.4 | 12.1 | 51.0 |
| (2) gift ratio held at 1987 level | 32.4 | 43.9 | 11.5 | 49.3 |
- 2010: from 37% to 54%; change since 1970 from negative to +15 points.
The “great transmission”
€9,000bn: how it is computed
Ouizille, Iberrakene, and Julien-Vauzelle (2024): GDP from €2,879bn (2025), +1% a year nominal; flow = 15% of GDP in 2021 rising linearly to 23% of GDP in 2050.
15% = Piketty (2011) 2008 flow (14.5%), a share of national income, not GDP (NNI \(\approx\) 85% of GDP \(\Rightarrow\) +18%).
The CAE note says both: flow “now exceeds 15%” of national income (p. 2) … and “more than 15% of GDP, or EUR 300 billion” (p. 5). But €300bn \(\approx\) 15% of NI.
23% = upper scenario of the simulations in Piketty and Zucman (2015) (\(g\) = 1%, \(r\) = 5%), also in % of NI; central scenario: “16–17%”. Authors: simulations “not fully satisfactory”.
Alternative assumptions
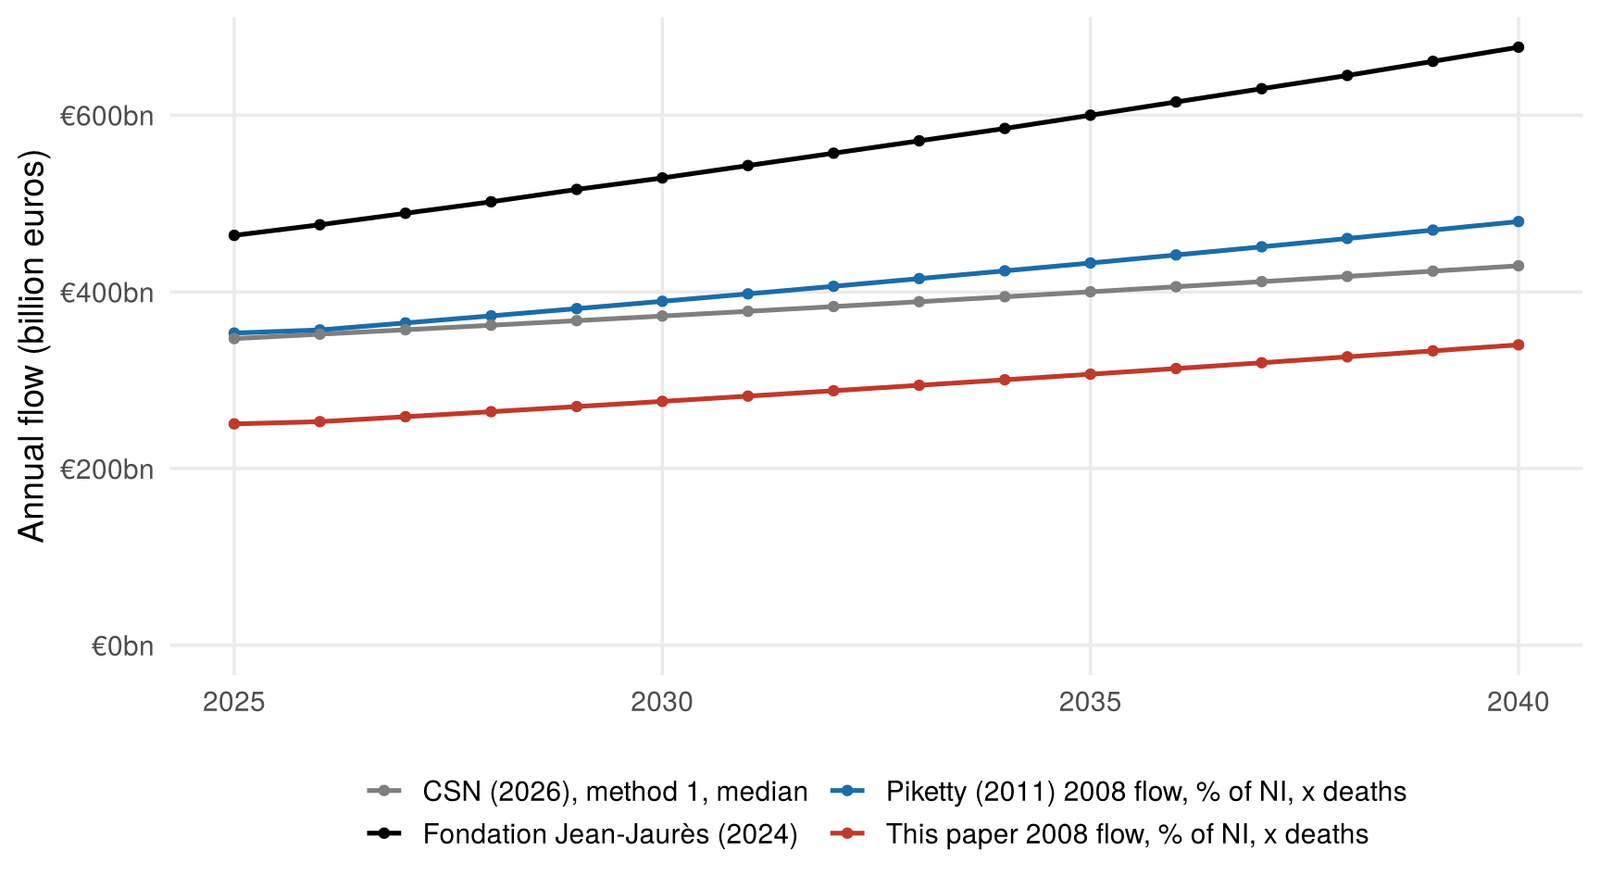
Cumulated flow 2025–2040
| Assumption | 2025-2040 (€bn) |
|---|---|
| Fondation Jean-Jaurès (2024), as published | 9,059 |
| (1) Same shares, % of national income | 7,655 |
| (2) Piketty (2011) 2008 flow held, % of NI | 6,099 |
| (3) (2) rising with projected deaths | 6,597 |
| (4) (3) with corrected gifts | 5,041 |
| (5) (4) excluding spouses (this paper) | 4,678 |
| Memo: published, nominal growth 3% | 10,646 |
| Memo: (5), nominal growth 3% | 5,488 |
| Memo: CSN (2026), total flow (range) | 3,599 - 7,558 |
Conseil supérieur du notariat (2026) (notaries): estates at death €1,800–3,779bn; “in no case the high hypothesis”; flow of new estates “never more than 30%” above 2018–2024: “not a multiplication, but a simple increase”. Jean-Jaurès: +46% from 2025 to 2040.
A cumulated flow is not a stock: gifts, spouses, re-transmissions are counted several times.
Conclusion
Conclusion
“60%” is not an estimate for any year with data: the published series gives 52.4% in 2010; 60% requires freezing the 2008 flow.
A theoretical construct, inferred under strong assumptions; fragile by the authors’ own account.
Gifts corrected, spouses excluded: 46.1% in 2010, about 52% extrapolated to 2021.
The cumulation window and other undocumented choices move 2010 between 37% and 54%; with long windows, no increase since 1970.
The €9,000bn “great transmission” applies a share of national income to GDP and assumes a rise to 23%: about €4,700bn with this paper’s flow.
Data needed: annual statistics on bequests and gifts, and survey questions linking wealth to past inheritances.
References
Auten, Gerald, and David Splinter. 2024. “Income Inequality in the United States: Using Tax Data to Measure Long-Term Trends.” Journal of Political Economy 132 (7). https://doi.org/10.1086/728741.
Conseil supérieur du notariat. 2026. “Étude « Grande transmission ».” Paris: Conseil supérieur du notariat.
Dherbécourt, Clément, Gabrielle Fack, Camille Landais, and Stefanie Stantcheva. 2021. “Repenser l’héritage.” Les notes du conseil d'analyse économique 69. Conseil d’analyse économique.
Geerolf, François. 2026. “Inheritance Flows in France: Using Estate and Gift Tax Data to Measure Long-Term Trends.”
Ouizille, Alexandre, Théo Iberrakene, and Boris Julien-Vauzelle. 2024. “Face à la « grande transmission », l’impôt sur les grandes successions.” Paris: Fondation Jean-Jaurès.
Piketty, Thomas. 2011. “On the Long-Run Evolution of Inheritance: France 1820–2050.” The Quarterly Journal of Economics 126 (3): 1071–131. https://doi.org/10.1093/qje/qjr020.
Piketty, Thomas, Gilles Postel-Vinay, and Jean-Laurent Rosenthal. 2014. “Inherited Vs Self-Made Wealth: Theory and Evidence from a Rentier Society (Paris 1872–1927).” Explorations in Economic History 51: 21–40.
Piketty, Thomas, and Gabriel Zucman. 2014. “Capital Is Back: Wealth-Income Ratios in Rich Countries 1700–2010.” The Quarterly Journal of Economics 129 (3): 1255–1310.
———. 2015. “Wealth and Inheritance in the Long Run.” In Handbook of Income Distribution, edited by Anthony B. Atkinson and François Bourguignon, 2:1303–68. Elsevier. https://doi.org/10.1016/B978-0-444-59429-7.00016-9.