
| 1970 (avg. 1940-69) | 2010 (avg. 1980-2009) | |
|---|---|---|
| Inheritance flow (% NI) | 6.7 | 8.6 |
| Net private saving (% NI) | 14.1 | 10.4 |
| Net capital share (%) | 19.5 | 24.5 |
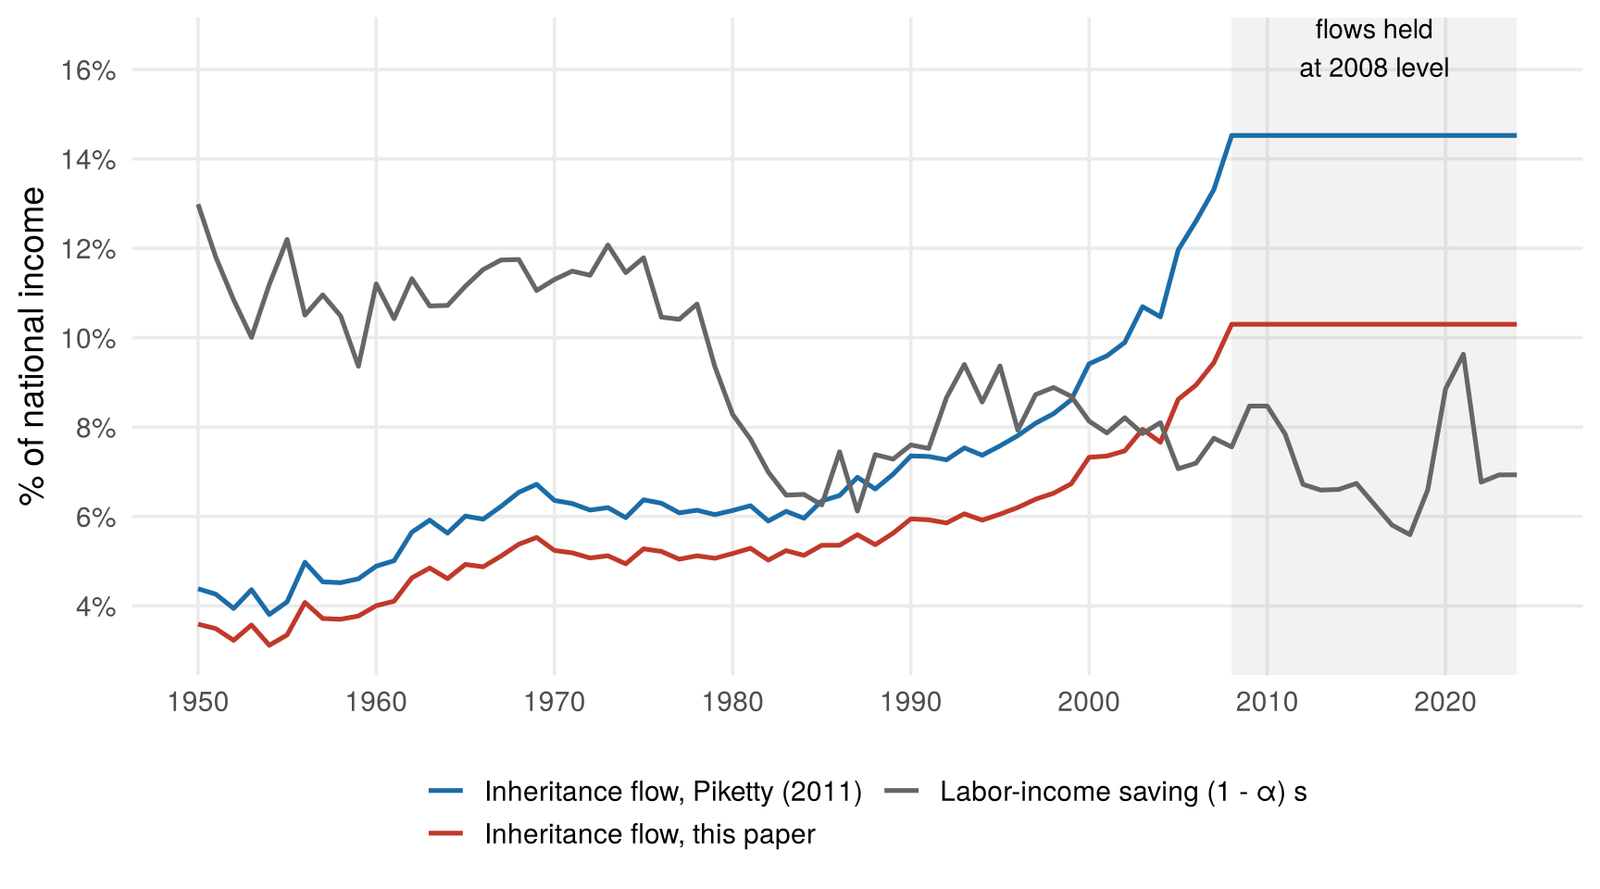
| Labor-income saving (% NI) | 11.4 | 7.8 |
| Share of inherited wealth (%) | 36.9 | 52.4 |
Main result
Revisiting Flow-Based Estimates
OFCE, Sciences Po, CEPR
September 2026
Share of inherited wealth: Piketty and Zucman (2015) and Alvaredo, Garbinti, and Piketty (2017) (AGP), “simplified definition”: compare inheritance flows and saving flows over the previous 30 years.
Inheritance flow: Piketty (2011), “close to 15%” of national income in 2008.
This paper: replicate exactly, then make each assumption explicit (as in Auten and Splinter 2024; companion paper Geerolf 2026).
Piketty and Zucman (2015): “this is an area where available evidence is scarce and incomplete.”
AGP: “there exists substantial uncertainty regarding the relative magnitude of inherited wealth and self-made wealth”; estimates “should still be viewed as tentative and exploratory”; “approximate lower-bound estimates”.
CAE note itself: “a critical lack of reliable data”; “since 2006, the administration has not produced any usable information” on transfers.
Notaries (Conseil supérieur du notariat 2026): any result “is based on a pile of assumptions”.
No French data source links current wealth to inheritances received.
Surveys: reported inheritances = 21–29% of the estimated flow → discarded by AGP.
PPVR (micro) definition: Paris before 1927 only.
Simplified definition: inferred from two aggregate flows, assuming
same returns and capital gains for inherited and self-made wealth;
same saving propensity whatever the source of income;
flows of the previous 30 years – no more, no less – are what matters.
The inheritance flow itself is not observed after 2006.
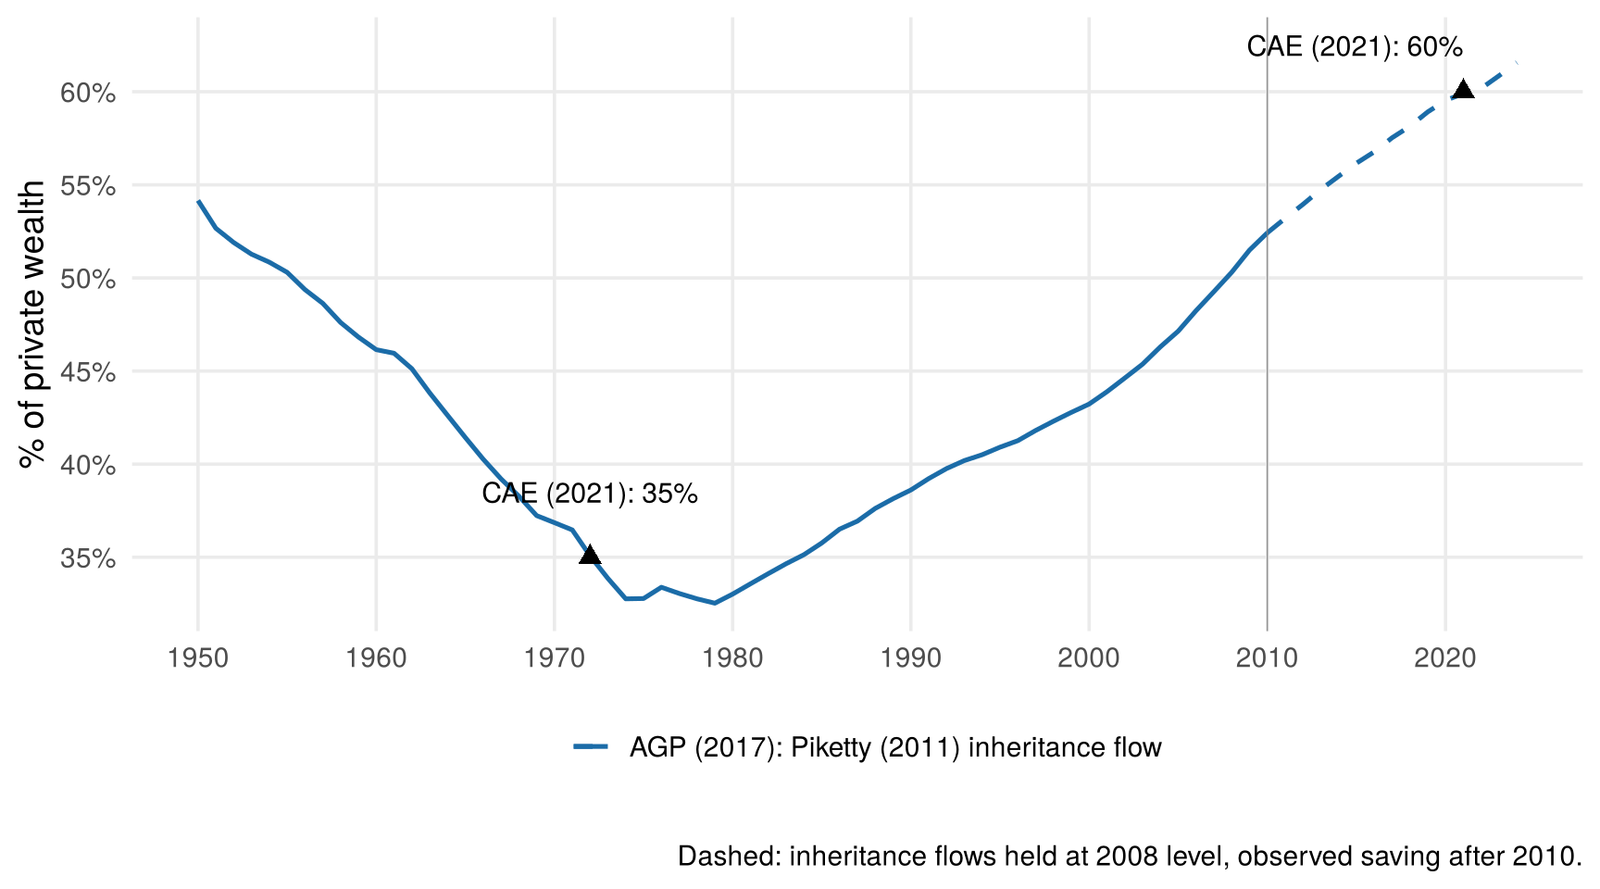
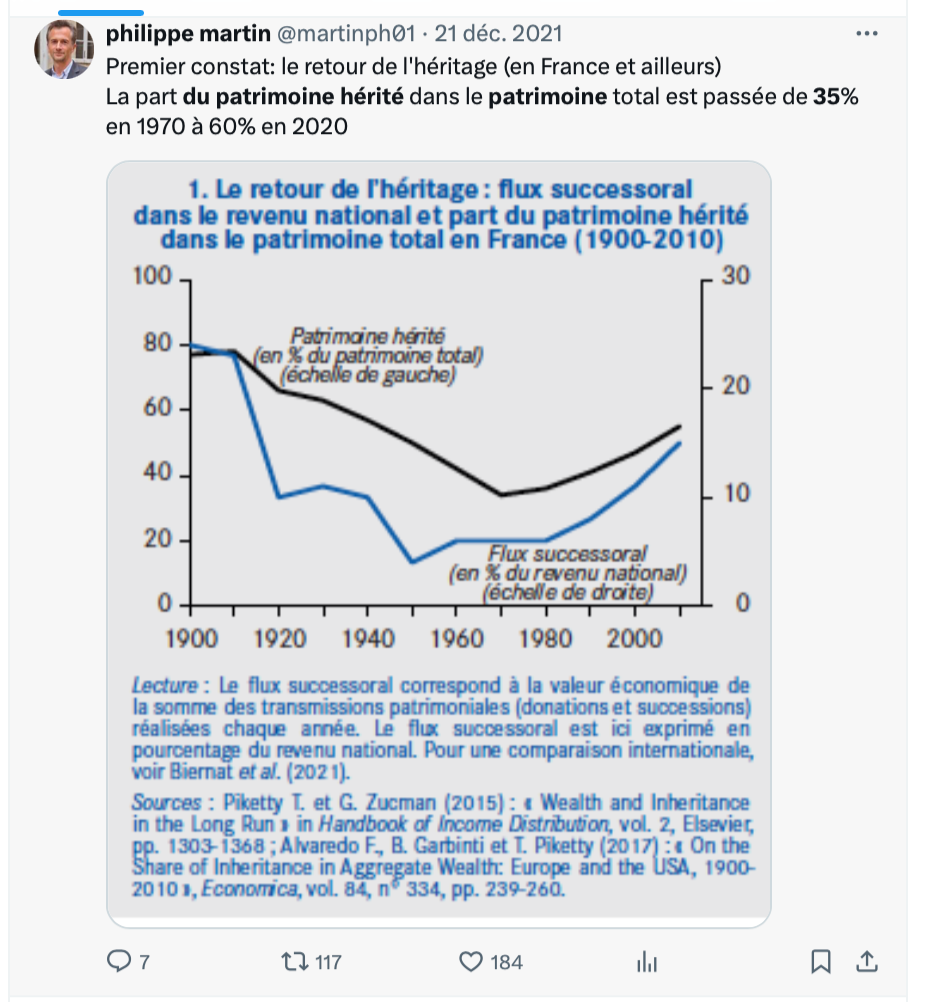
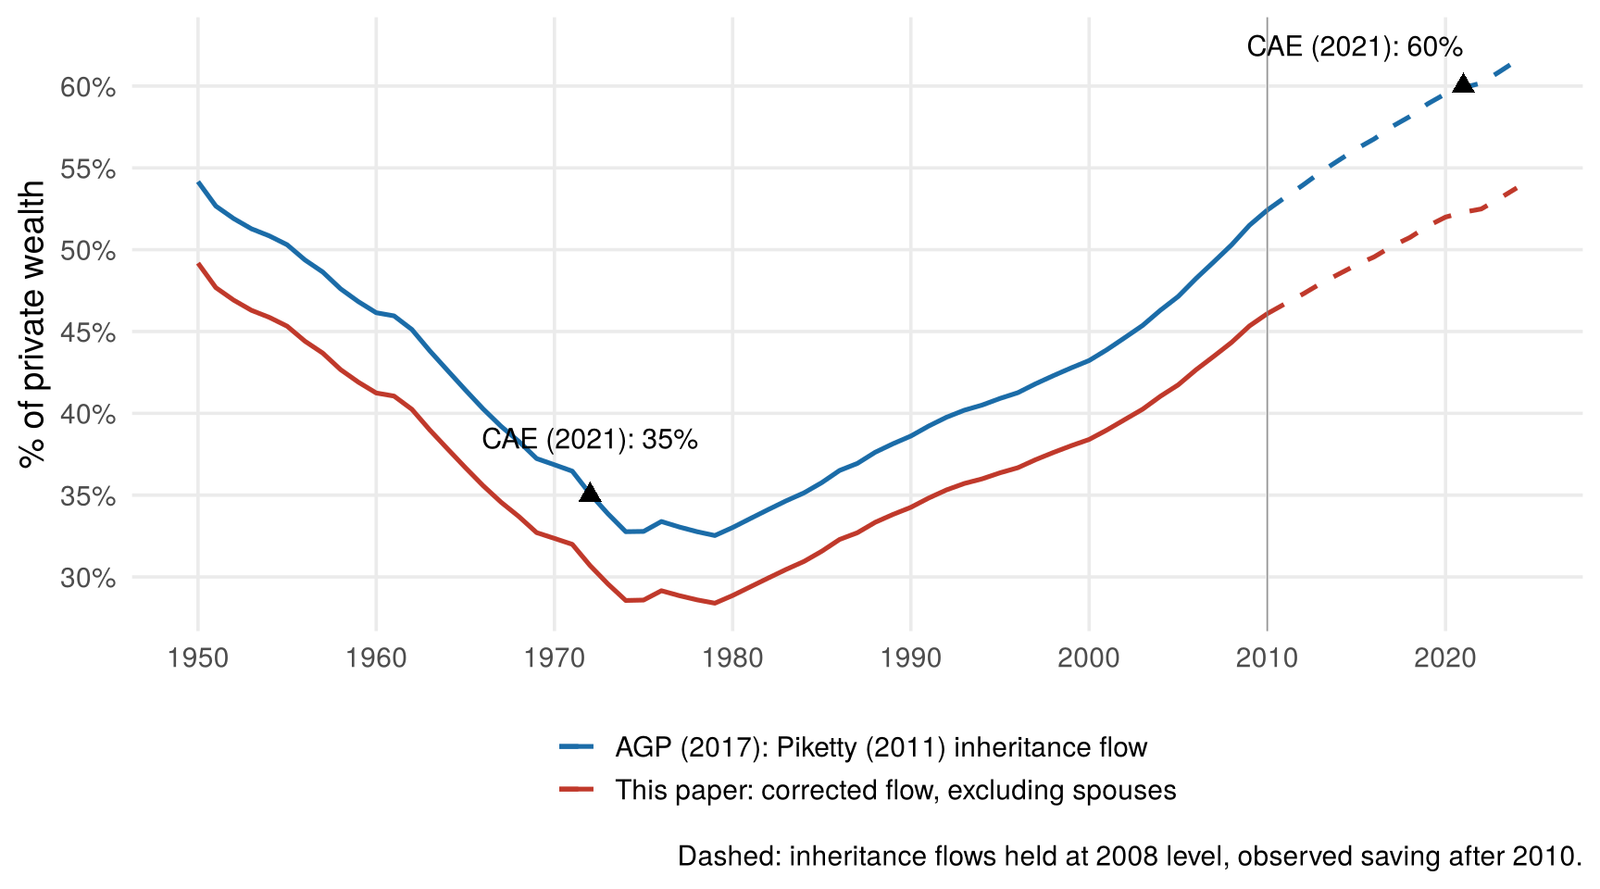
Published series: 36.9% in 1970, 52.4% in 2010 (last year; flows observed up to 2008). The CAE chart: ~55% in 2010.
60% requires holding the 2008 flow (14.5% of NI) for 15 years: crossed in 2022.
This paper (gifts corrected, spouses excluded): 46.1% in 2010, 52.3% in 2021 (extrapolated); 32.4% in 1970.
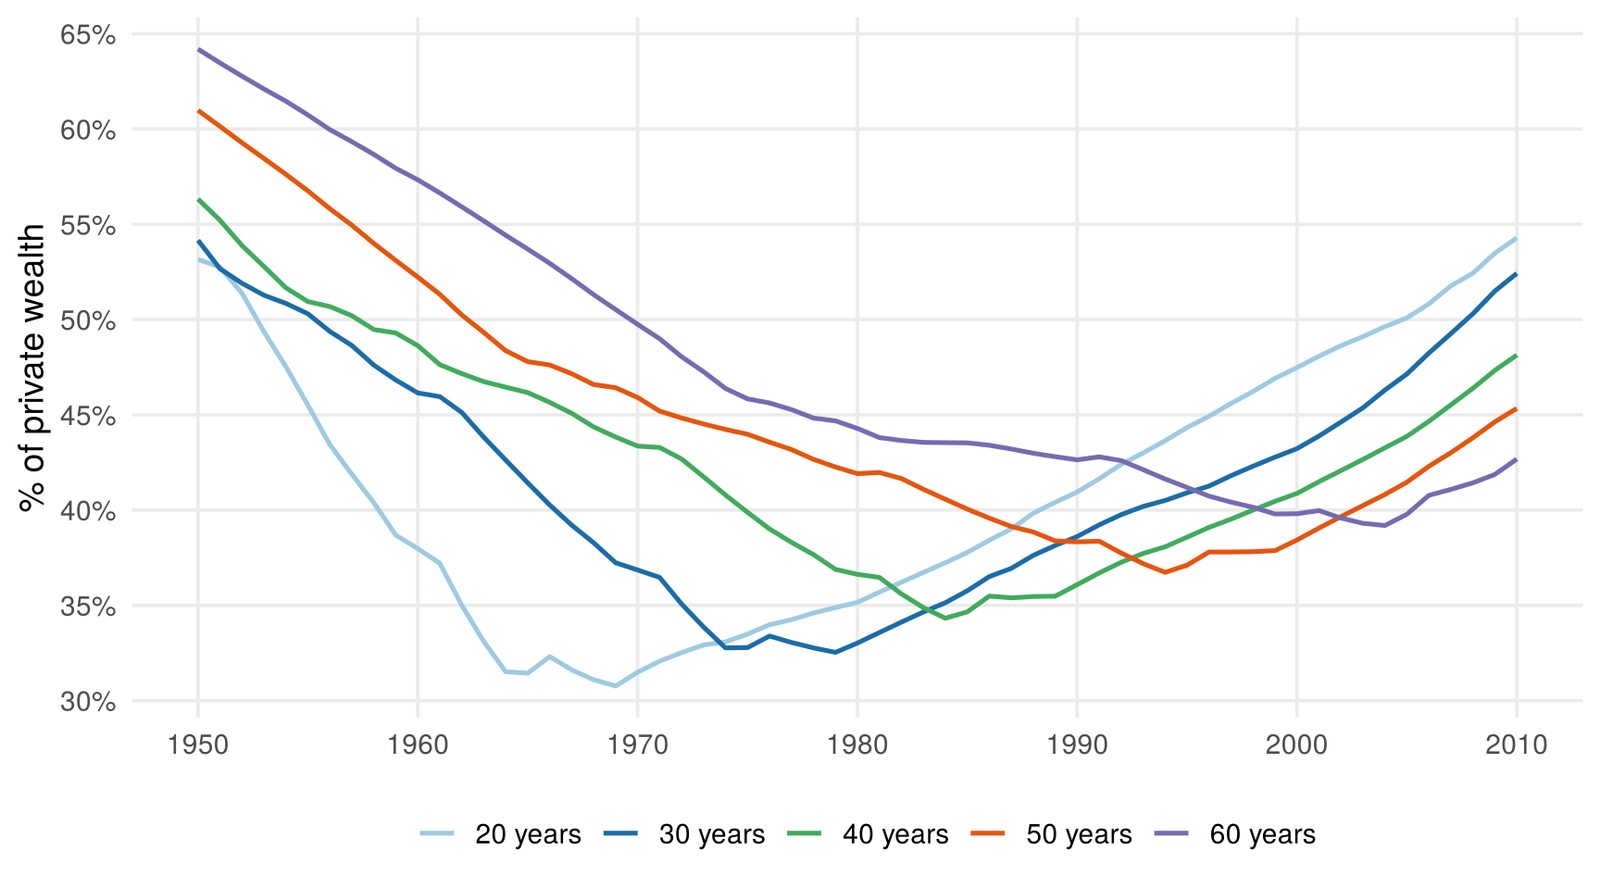
Cumulation window: 2010 share between 37% and 54% across specifications. With 50 years or more: no increase since 1970.
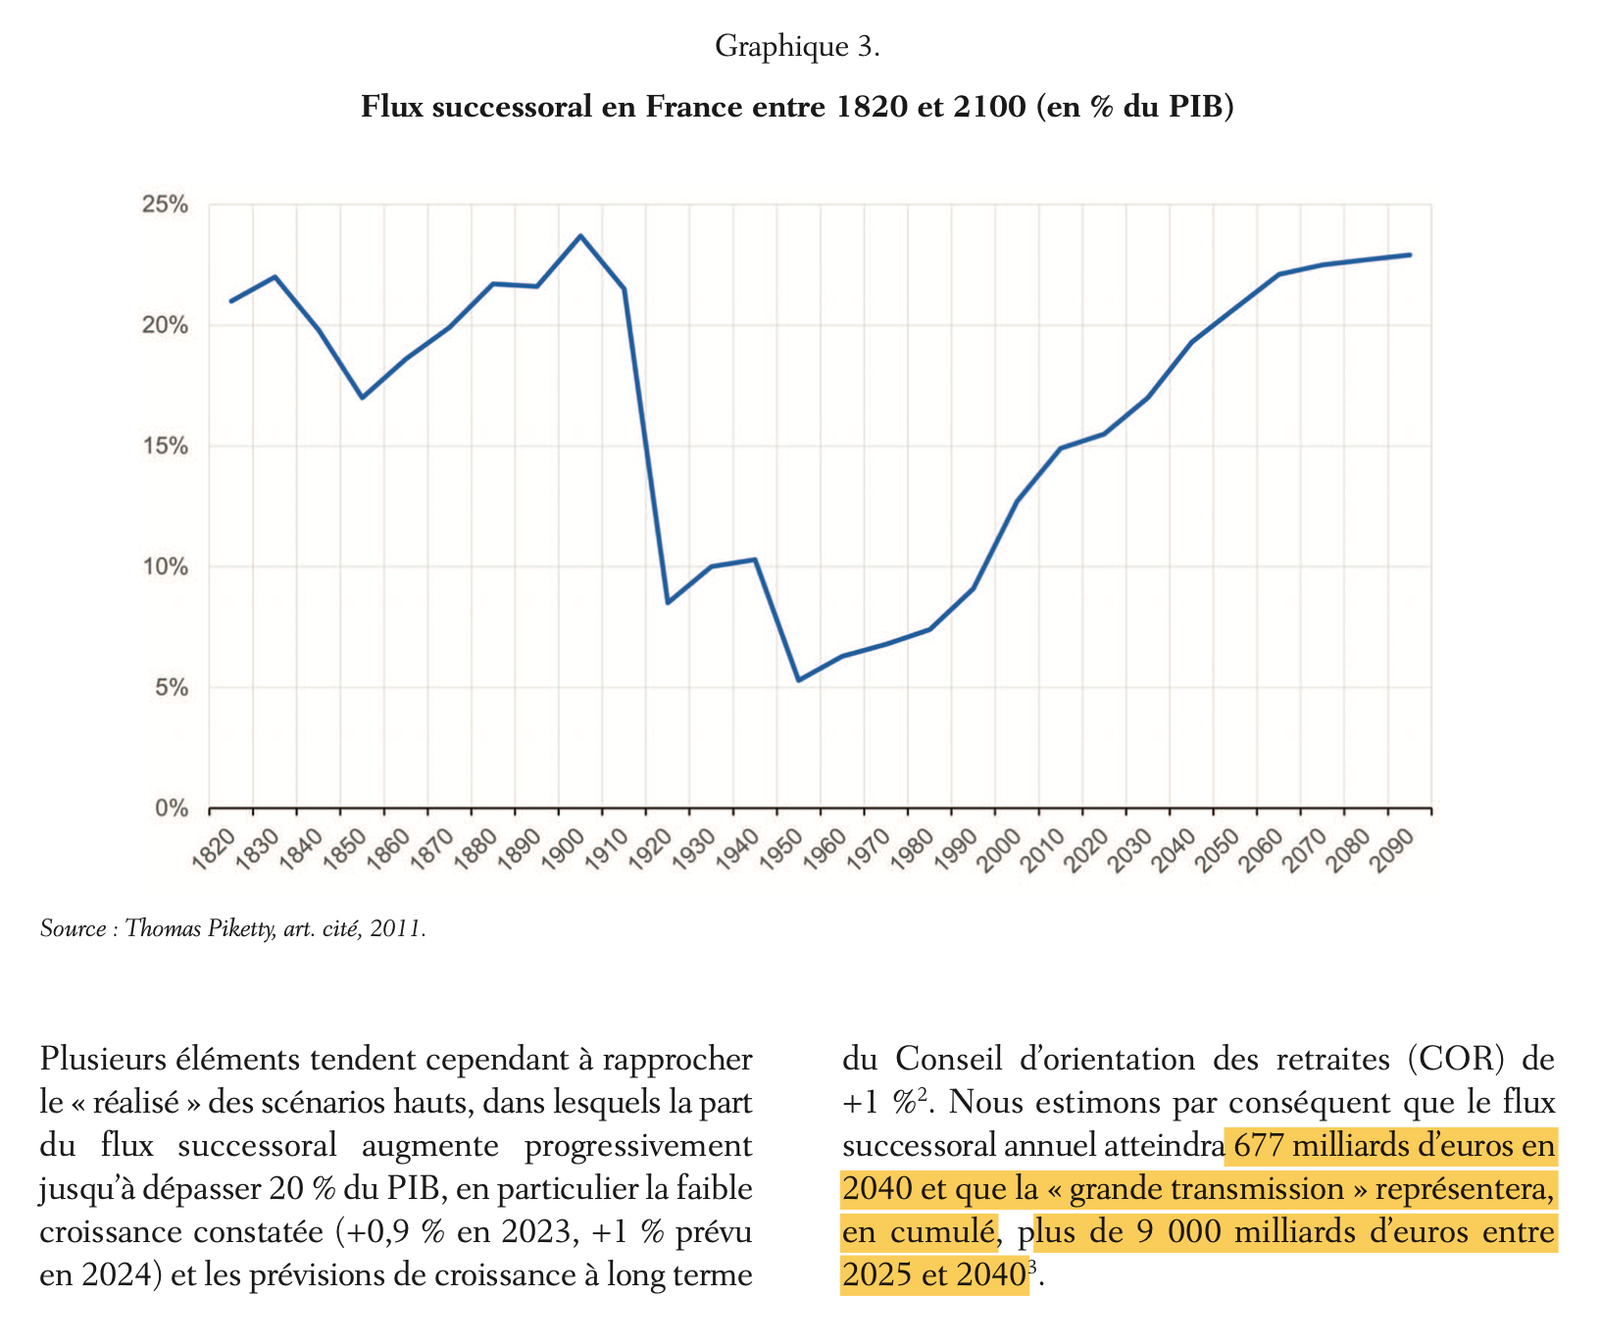
Great transmission: €9,059bn uses a share of national income applied to GDP, (+18%), and a rise to 23%; about €4,700bn with this paper’s flow.
Kotlikoff–Summers (1981): life-cycle wealth from age profiles, residual = transfers → 81% (US, 1974). Modigliani (1986, 1988): uncapitalized bequest flow over 30 years → 15–20% (US, 1962). Gap mostly from definitions (return on inherited wealth).
Both count intergenerational transfers only: spouses excluded.
PPVR (Piketty, Postel-Vinay, and Rosenthal 2014): inherited wealth = min(current wealth, capitalized inheritance). Needs micro data over two generations: Paris, 1872–1927 only (rentiers: 10% of population, 70% of wealth). French “PPVR” series = extrapolation, “65–75%” in 2010.
Simplified definition (AGP), the one in the CAE note: \[ \varphi = \frac{b_y + \varphi \alpha s}{b_y + s} \quad\Longleftrightarrow\quad \varphi = \frac{b_y}{b_y + (1-\alpha)s} \] with 30-year averages of \(b_y\) and \((1-\alpha)s\).
\[ \varphi_t = \frac{\sum_{s=t-30}^{t-1} b_{ys}}{\sum_{s=t-30}^{t-1} \left[b_{ys} + (1-\alpha_s) s_s\right]} \]
Reproduces the published series to machine precision (3e-16).
Inheritance flow = economic flow of Piketty (2011), held at 14.5% from 2009 to 2019; saving held at 2010 level.
| 1970 (avg. 1940-69) | 2010 (avg. 1980-2009) | |
|---|---|---|
| Inheritance flow (% NI) | 6.7 | 8.6 |
| Net private saving (% NI) | 14.1 | 10.4 |
| Net capital share (%) | 19.5 | 24.5 |
| Labor-income saving (% NI) | 11.4 | 7.8 |
| Share of inherited wealth (%) | 36.9 | 52.4 |
| Source | Statement | Underlying |
|---|---|---|
| AGP (2017), abstract | “50–60% (and rising) since around 2010” | Europe; France 52.4% |
| PZ (2015), AGP Fig. 3 | “about 60–70% in the early 21st century” | Mostly PPVR extrapolation |
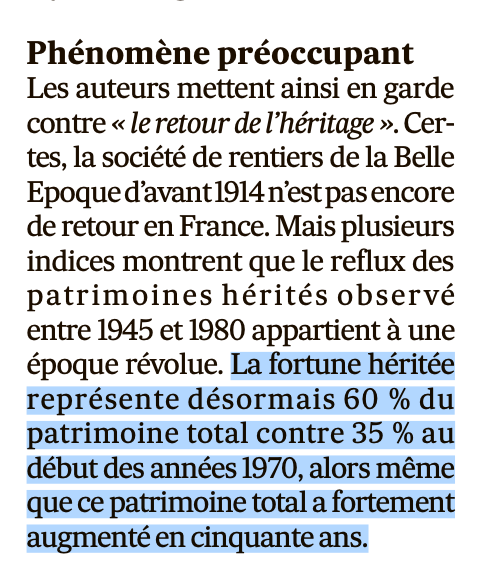
| CAE (Dec. 2021) | “désormais 60 % […] contre 35 %” | Own chart: ~55% in 2010 |
| P. Martin, CAE (Dec. 2021) | “35% en 1970 à 60% en 2020” | Same chart |
| Les Echos (Dec. 2021) | “60 % […] contre 30 % en 1970” | CAE |
| F. Jean-Jaurès (2024) | “désormais 60 % […] contre 35 %” | CAE |
| franceinfo (Oct. 2025) | “aujourd’hui cette part est de 60 %” | – |
File: 57.3% in 2019 with flows and saving frozen; 59.9% in 2021 with observed saving.
No inheritance data published since 2006: “60% today” assumes the 2008 flow (housing boom peak) for 15 years.
Companion paper (Geerolf 2026): gifts overstated in the 2000s
2006 includes a cash-gift scheme that ended in December 2005;
benchmark years for gifts all coincide with temporary tax incentives;
recorded gifts upgraded as if they contained life insurance.
Economic flow: 9.6% in 2006 and 11.1% in 2008, instead of 12.6% and 14.5%.
Share of inherited wealth: 48.0% in 2010 instead of 52.4%; +13.6 points since 1970 instead of +15.6.
Surveys: self-reported inheritances = 21–29% of the economic flow [AGP, Table 1]: underreporting, or an overstated economic flow.
The flow includes bequests to surviving spouses: transmitted again to children a few years later → same wealth counted twice within 30 years.
Excluded by Kotlikoff–Summers (“distant in age” transfers only), by Modigliani (subtracts husband-wife transfers), and by the CAE itself for lifetime inheritances (“excluding spousal transfers”).
Piketty (2011): spouses “about 10%” of the estate flow, excluding them “would make little difference”. CPO: 17.9% of bequests in 2006.
This paper: exclude 10% of bequests (conservative); 17.9% in sensitivity.
Share of inherited wealth: 46.1% in 2010 (vs. 52.4%), 52.3% extrapolated to 2021 (vs. 59.9%).
AGP: \(H\) = “average generation length, that is, the average age at which parents have children”.
But what matters is how long inherited and self-made wealth stay with the living:
heirs inherit at about 50 (Dherbécourt et al. 2021) and live 30+ more years;
a 70-year-old saver’s wealth reflects 40–50 years of saving.
Deviations assumed to “balance each other”: not tested.
2010: 54.3% (20y), 52.4% (30y), 48.1% (40y), 45.3% (50y), 42.7% (60y).
1970 vs. 2010 with 50 years: 45.9% vs. 45.3%; with 60 years: 49.7% vs. 42.7%.
Capitalization: the “full formula” capitalizes at \(r-g\), the series does not. Older flows are mostly saving → capitalizing lowers \(\varphi\) (2010: 51.4% at 2%).
Capital gains: \(b_y = (1+v)\mu m\beta\) embeds capital gains up to transmission (\(\beta\): 298% in 1980 → 563% in 2008; capital gains \(\approx\) 1/4 of 1970–2010 wealth growth, Piketty and Zucman (2014)); saving flows do not.
Gifts brought forward by tax incentives raise \(\varphi\) during the transition.
“Lower bound”? Based on AGP’s comparison with a PPVR series extrapolated from Paris 1872–1927; PPVR (2014) do not compare with the simplified definition. Several biases go the other way.
| Assumption | 1970 | 2010 | Change | 2021 (extrap.) |
|---|---|---|---|---|
| AGP (2017) | 36.9 | 52.4 | 15.6 | 59.9 |
| (1) Gift corrections only | 34.4 | 48.0 | 13.6 | 54.1 |
| (2) + excl. spouses, 10% (preferred) | 32.4 | 46.1 | 13.7 | 52.3 |
| (2’) + excl. spouses, 17.9% (CPO) | 30.6 | 44.5 | 13.8 | 50.7 |
| (2) with 20-year window | 27.4 | 47.3 | 20.0 | 56.7 |
| (2) with 40-year window | 38.5 | 42.2 | 3.6 | 50.5 |
| (2) with 50-year window | 41.0 | 39.6 | -1.4 | 46.8 |
| (2) with 60-year window | 44.8 | 37.2 | -7.6 | 44.0 |
| (2) capitalized at 2% | 33.3 | 45.4 | 12.1 | 51.0 |
| (2) gift ratio held at 1987 level | 32.4 | 43.9 | 11.5 | 49.3 |
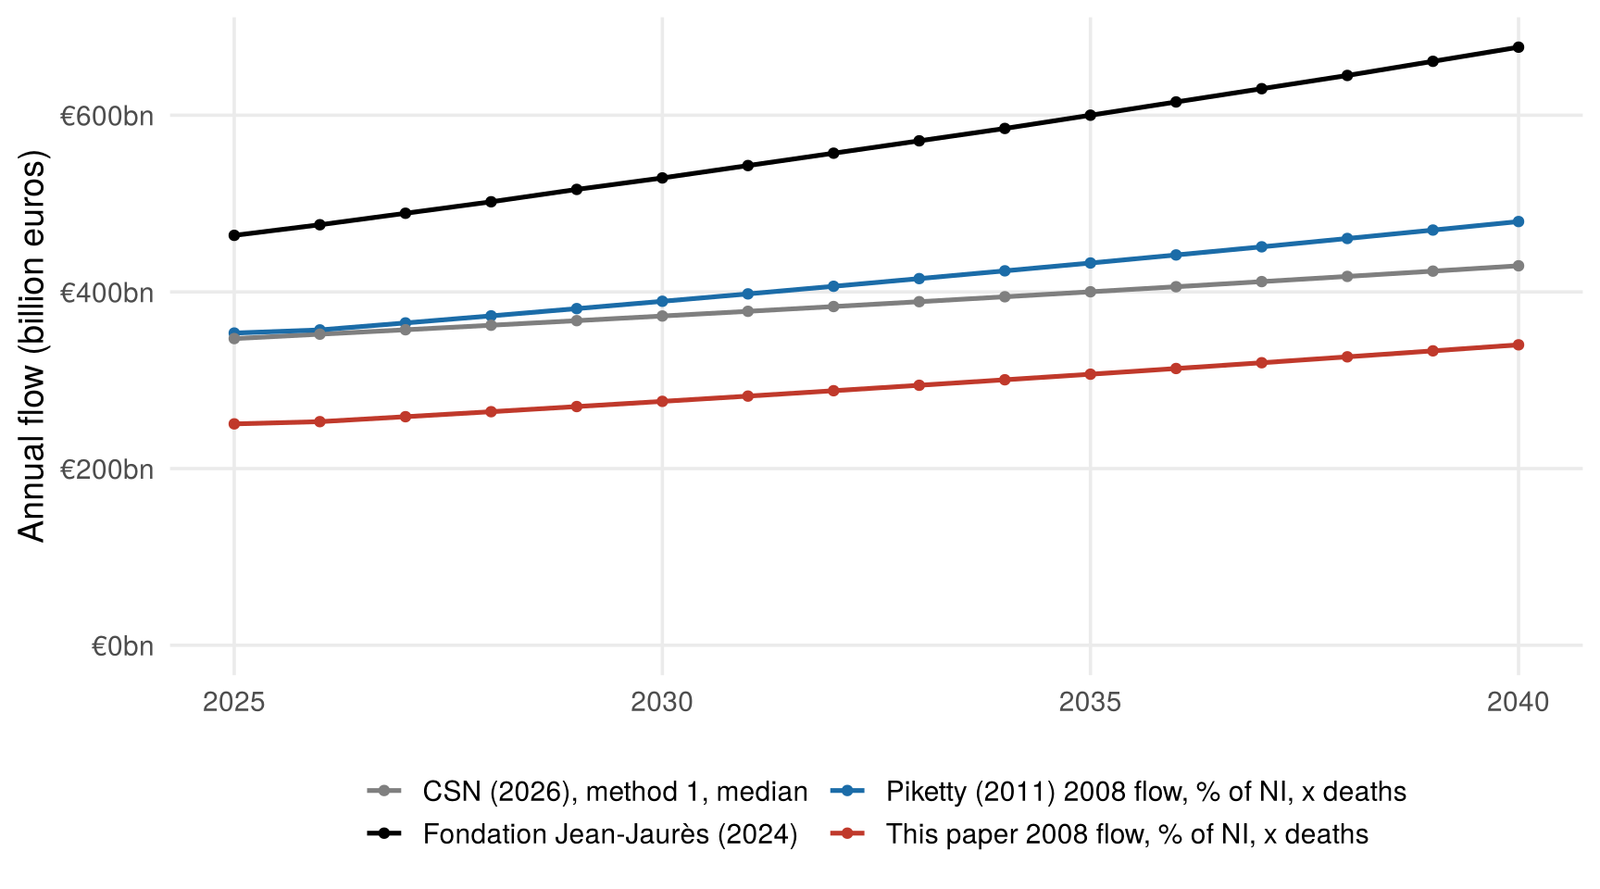
Ouizille, Iberrakene, and Julien-Vauzelle (2024): GDP from €2,879bn (2025), +1% a year nominal; flow = 15% of GDP in 2021 rising linearly to 23% of GDP in 2050.
15% = Piketty (2011) 2008 flow (14.5%), a share of national income, not GDP (NNI \(\approx\) 85% of GDP \(\Rightarrow\) +18%).
The CAE note says both: flow “now exceeds 15%” of national income (p. 2) … and “more than 15% of GDP, or EUR 300 billion” (p. 5). But €300bn \(\approx\) 15% of NI.
23% = upper scenario of the simulations in Piketty and Zucman (2015) (\(g\) = 1%, \(r\) = 5%), also in % of NI; central scenario: “16–17%”. Authors: simulations “not fully satisfactory”.
| Assumption | 2025-2040 (€bn) |
|---|---|
| Fondation Jean-Jaurès (2024), as published | 9,059 |
| (1) Same shares, % of national income | 7,655 |
| (2) Piketty (2011) 2008 flow held, % of NI | 6,099 |
| (3) (2) rising with projected deaths | 6,597 |
| (4) (3) with corrected gifts | 5,041 |
| (5) (4) excluding spouses (this paper) | 4,678 |
| Memo: published, nominal growth 3% | 10,646 |
| Memo: (5), nominal growth 3% | 5,488 |
| Memo: CSN (2026), total flow (range) | 3,599 - 7,558 |
Conseil supérieur du notariat (2026) (notaries): estates at death €1,800–3,779bn; “in no case the high hypothesis”; flow of new estates “never more than 30%” above 2018–2024: “not a multiplication, but a simple increase”. Jean-Jaurès: +46% from 2025 to 2040.
A cumulated flow is not a stock: gifts, spouses, re-transmissions are counted several times.
“60%” is not an estimate for any year with data: the published series gives 52.4% in 2010; 60% requires freezing the 2008 flow.
A theoretical construct, inferred under strong assumptions; fragile by the authors’ own account.
Gifts corrected, spouses excluded: 46.1% in 2010, about 52% extrapolated to 2021.
The cumulation window and other undocumented choices move 2010 between 37% and 54%; with long windows, no increase since 1970.
The €9,000bn “great transmission” applies a share of national income to GDP and assumes a rise to 23%: about €4,700bn with this paper’s flow.
Data needed: annual statistics on bequests and gifts, and survey questions linking wealth to past inheritances.