Phillips Curve
Intermediate Macroeconomics - UCLA - Econ 102
François Geerolf
November 25, 2020
Introduction
Links
There are several versions of these slides:
If you want to know more, there also exists a more advanced version of these slides (Ph.D. Level), as well as some related research of mine - this is absolutely not exam material:
Own Research. Phillips curve. Dynamic inefficiency.
What is it?
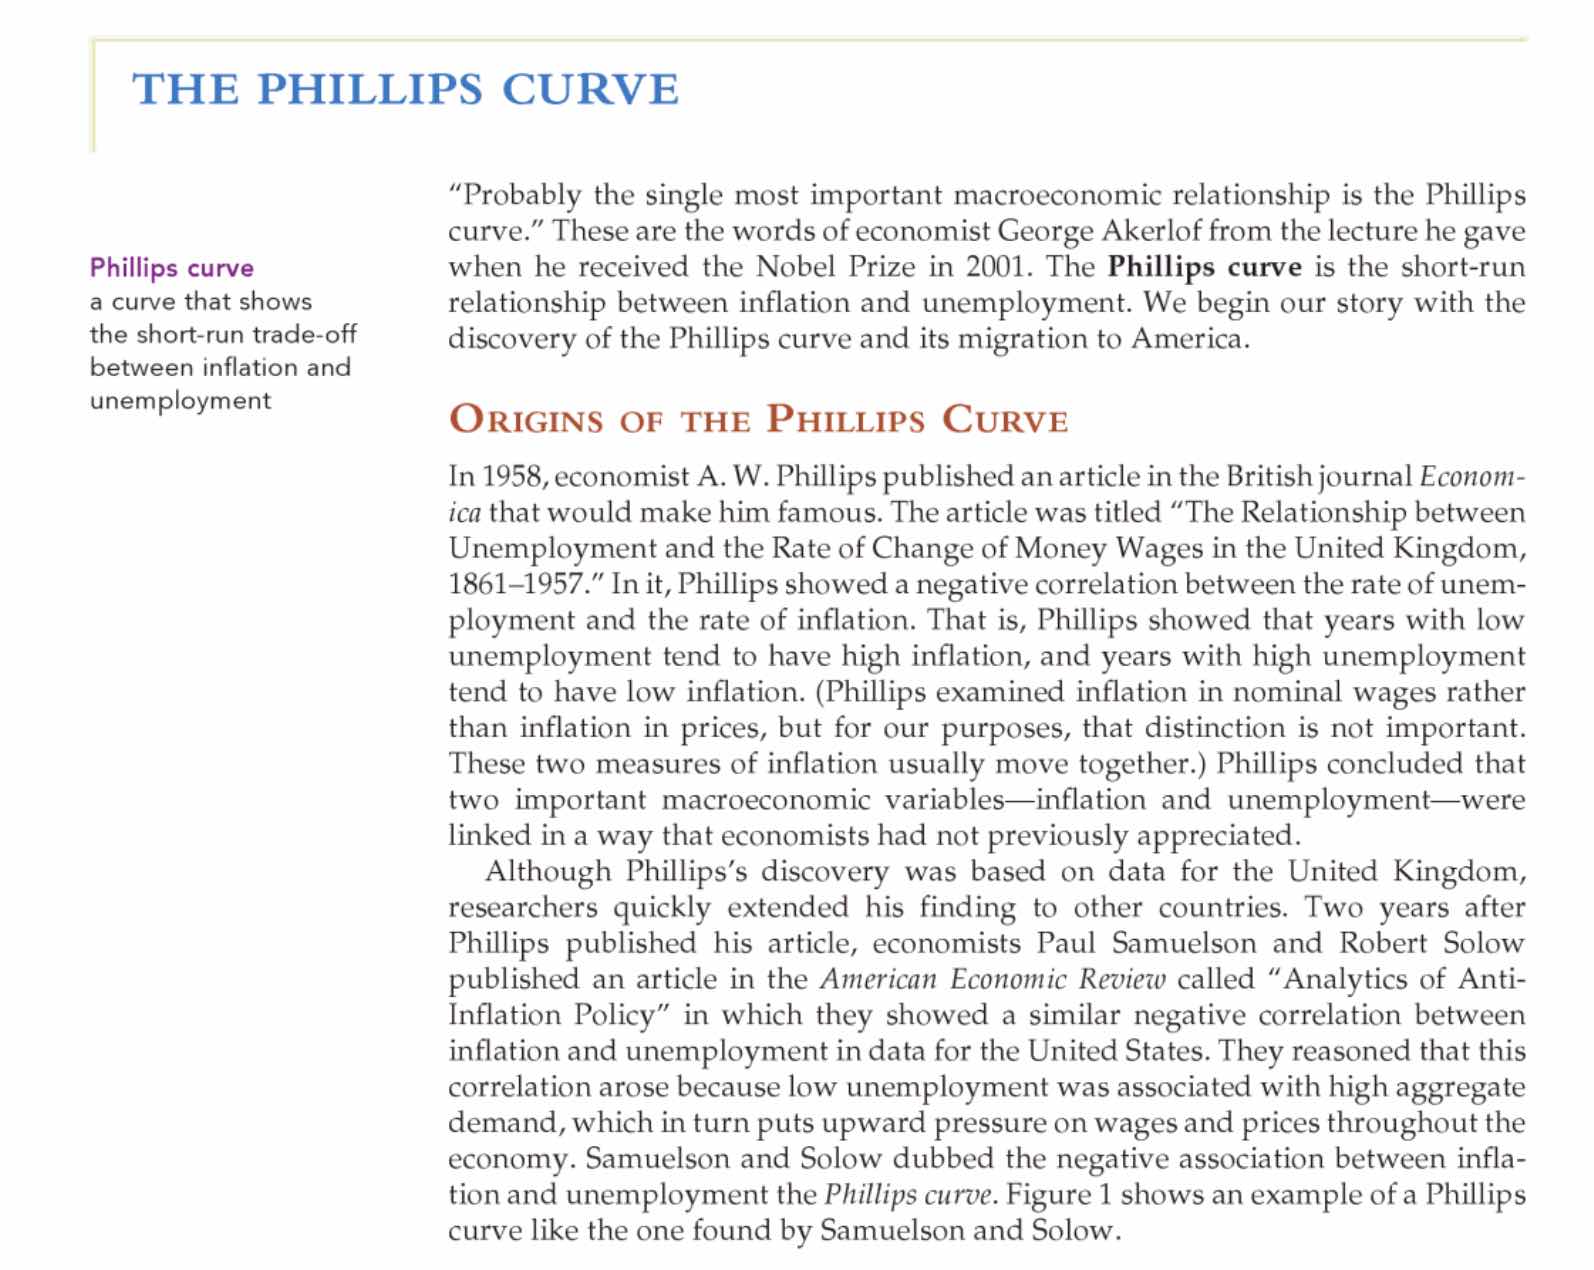
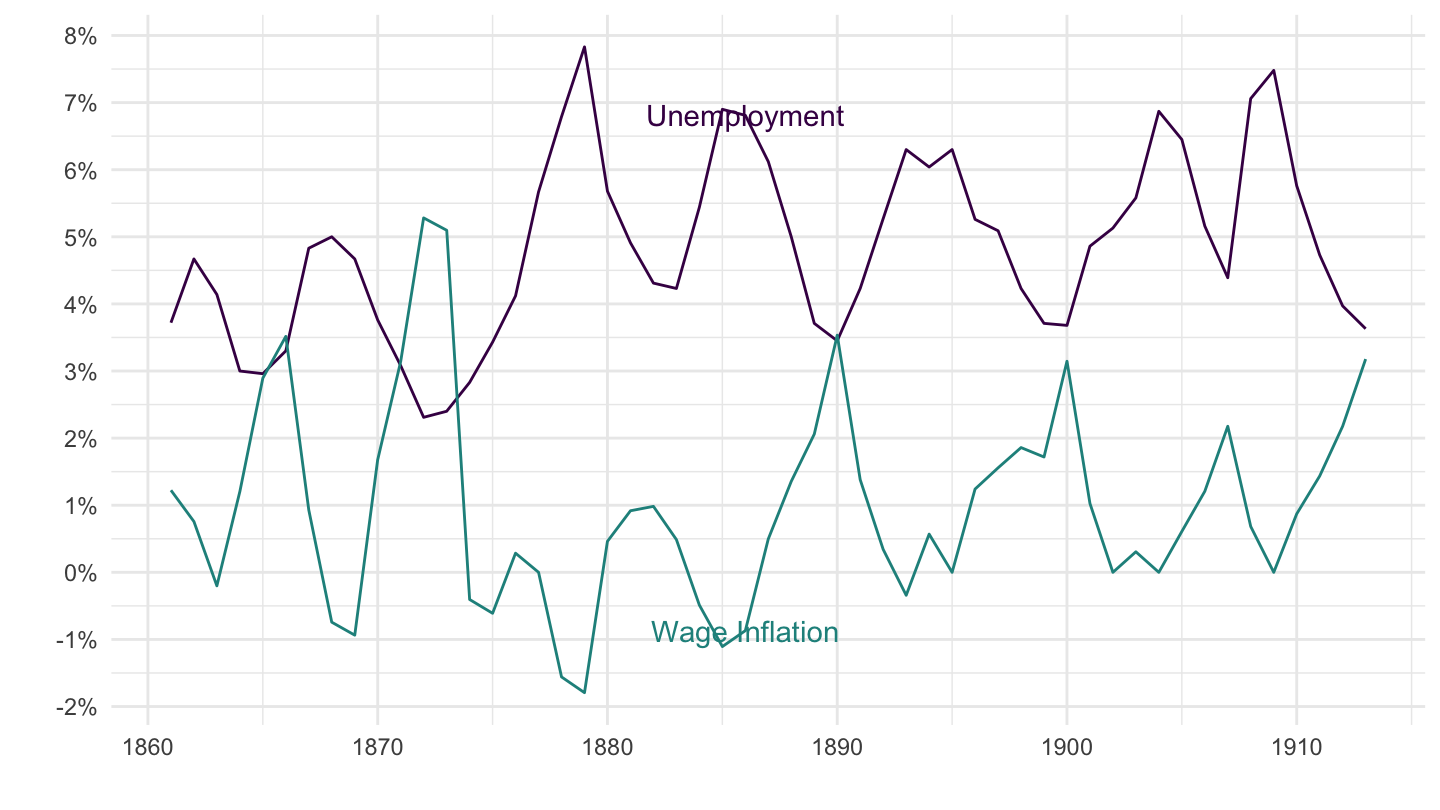
In 1958. A.W. Phillips uncovered a negative association between the rate of nominal wage inflation and unemployment, in the U.K., from 1861 to 1957.
2 years later, two American economists, Paul Samuelson and Robert Solow replicated the analysis for the U.S., using data from 1900 to 1960. Apart from the late 1930s, they found a similar association. This relation was soon labeled the “Phillips curve,” and became central to macroeconomic thinking and policy.
This is a core of “traditional” undergraduate macroeconomics.
Plan of the lecture
First I shall review what I am supposed to teach you from two references:
Greg Mankiw’s Principles of Economics’s textbook.
Olivier Blanchard’s Macroeconomics’ textbook.
I am first going to teach you what they teach, and what they research: Greg Mankiw’s at Harvard University, and Olivier Blanchard’s at MIT and was present of the American Economic Association, so what they teach is considered to be the orthodoxy.
I’ll then tell you why I am very skeptical about the Phillips curve, and about the neoclassical synthesis more broadly that’s based on the Phillips curve.
Finally, I’ll give you my own views on the Phillips curve.
Traditional View in Textbooks
Three textbooks
I used to teach from from these textbooks in 2014-2016, until I decided to teach in line with my own thinking.
Consequence: Do not use old material from 2014-2016 !

Mankiw (from Google Books) - Introduction
Origins
Phillips curve in traditional textbooks
Phillips curve = AS curve
Blanchard’s Macroeconomics
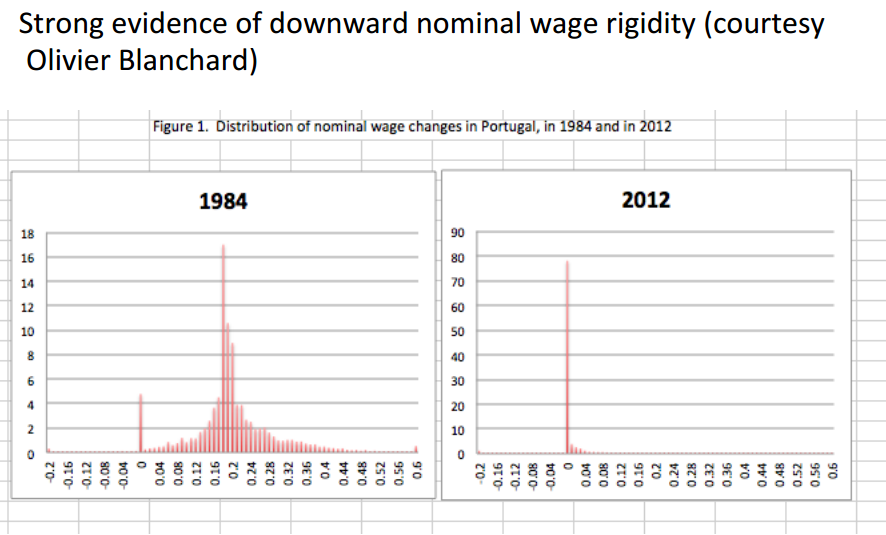
Nominal wage rigidity
Blanchard’s textbook (1970s Stagflation)
33-39 Missing Deflation (Blanchard’s textbook)
Neoclassical “Synthesis”
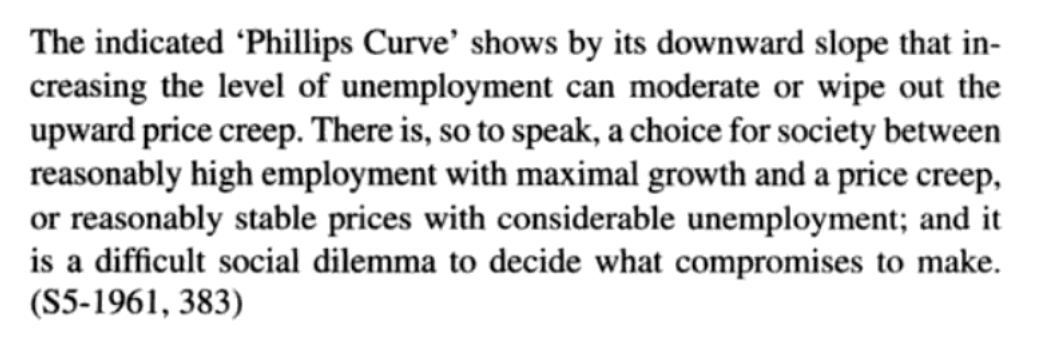
Samuelson (1955)’s Economics - Definition
Economics, Fifth Edition (1961)
Stagflation in the 1970s
Reading: “Where does the buck stop?” The Economist, August 11, 2016.
First time the Keynesian consensus fractured was in the 1970s.
Accommodative fiscal and monetary policies were attempted in the 1970s to remedy high unemployment, and only led to more inflation, as unemployment remained high.
Appeared to be inconsistent with the “Phillips curve” view \(=\) no trade-off between inflation and unemployment?
Monetarism convinced many economists that the business cycle was caused by fluctuations in the money supply, so that monetary policy was enough to stabilize the economy (fiscal policy was not needed). e.g. Milton Friedman.
Freshwater VS Saltwater school
Freshwater: fiscal stimulus in the form of tax cuts was ineffective, as it was entirely offset by increased private saving.
Because of “Ricardian equivalence.”
In general, “freshwater” economists were very skeptical of Keynesian principles. For them, everything should be explained by supply, and technological forces.
In contrast, “saltwater” economists borrowed insights from Keynesianism, as well as from the freshwater school, trying to build a more “balanced” view of Keynesianism.
According to them, central banks should do most of the job of macroeconomic management. This belief was however contradicted by the crisis in Japan in the 1990s, or the 2007-09 U.S. financial crisis, where fiscal policy was used very heavily.
Natural rate of unemployment
Response to the Phillips curve failure in the 1970s.
Attempt to save the Phillips curve: it is a relation between accelerating inflation and unemployment.
NAIRU: level of unemployment such that inflation would not accelerate (“Non Accelerating Inflation Rate of Unemployment”), also known as the natural rate of unemployment.
Whenever policymakers tried to have less unemployment than that, there would be rising inflation.
Whenever there would be more unemployment, there would be a deceleration in inflation.
2010-2020 Doubts
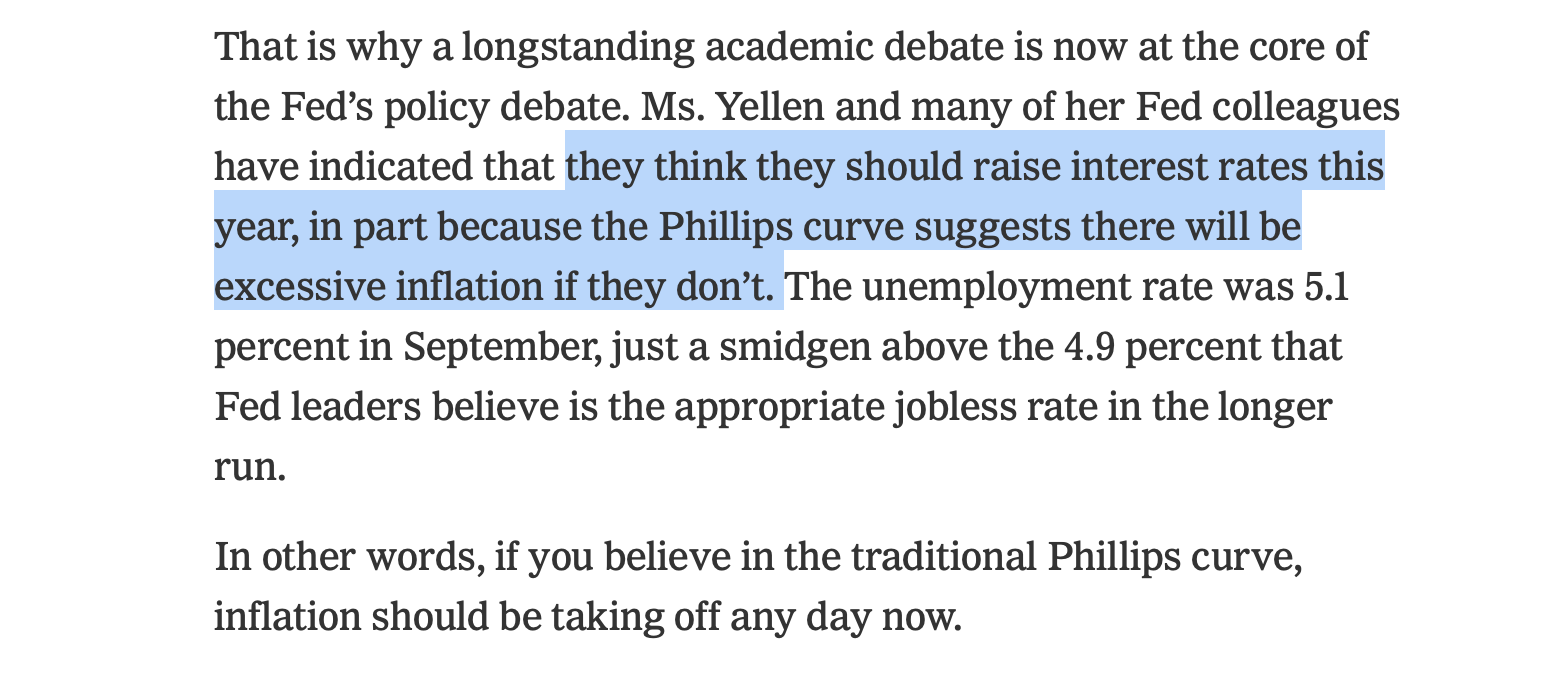
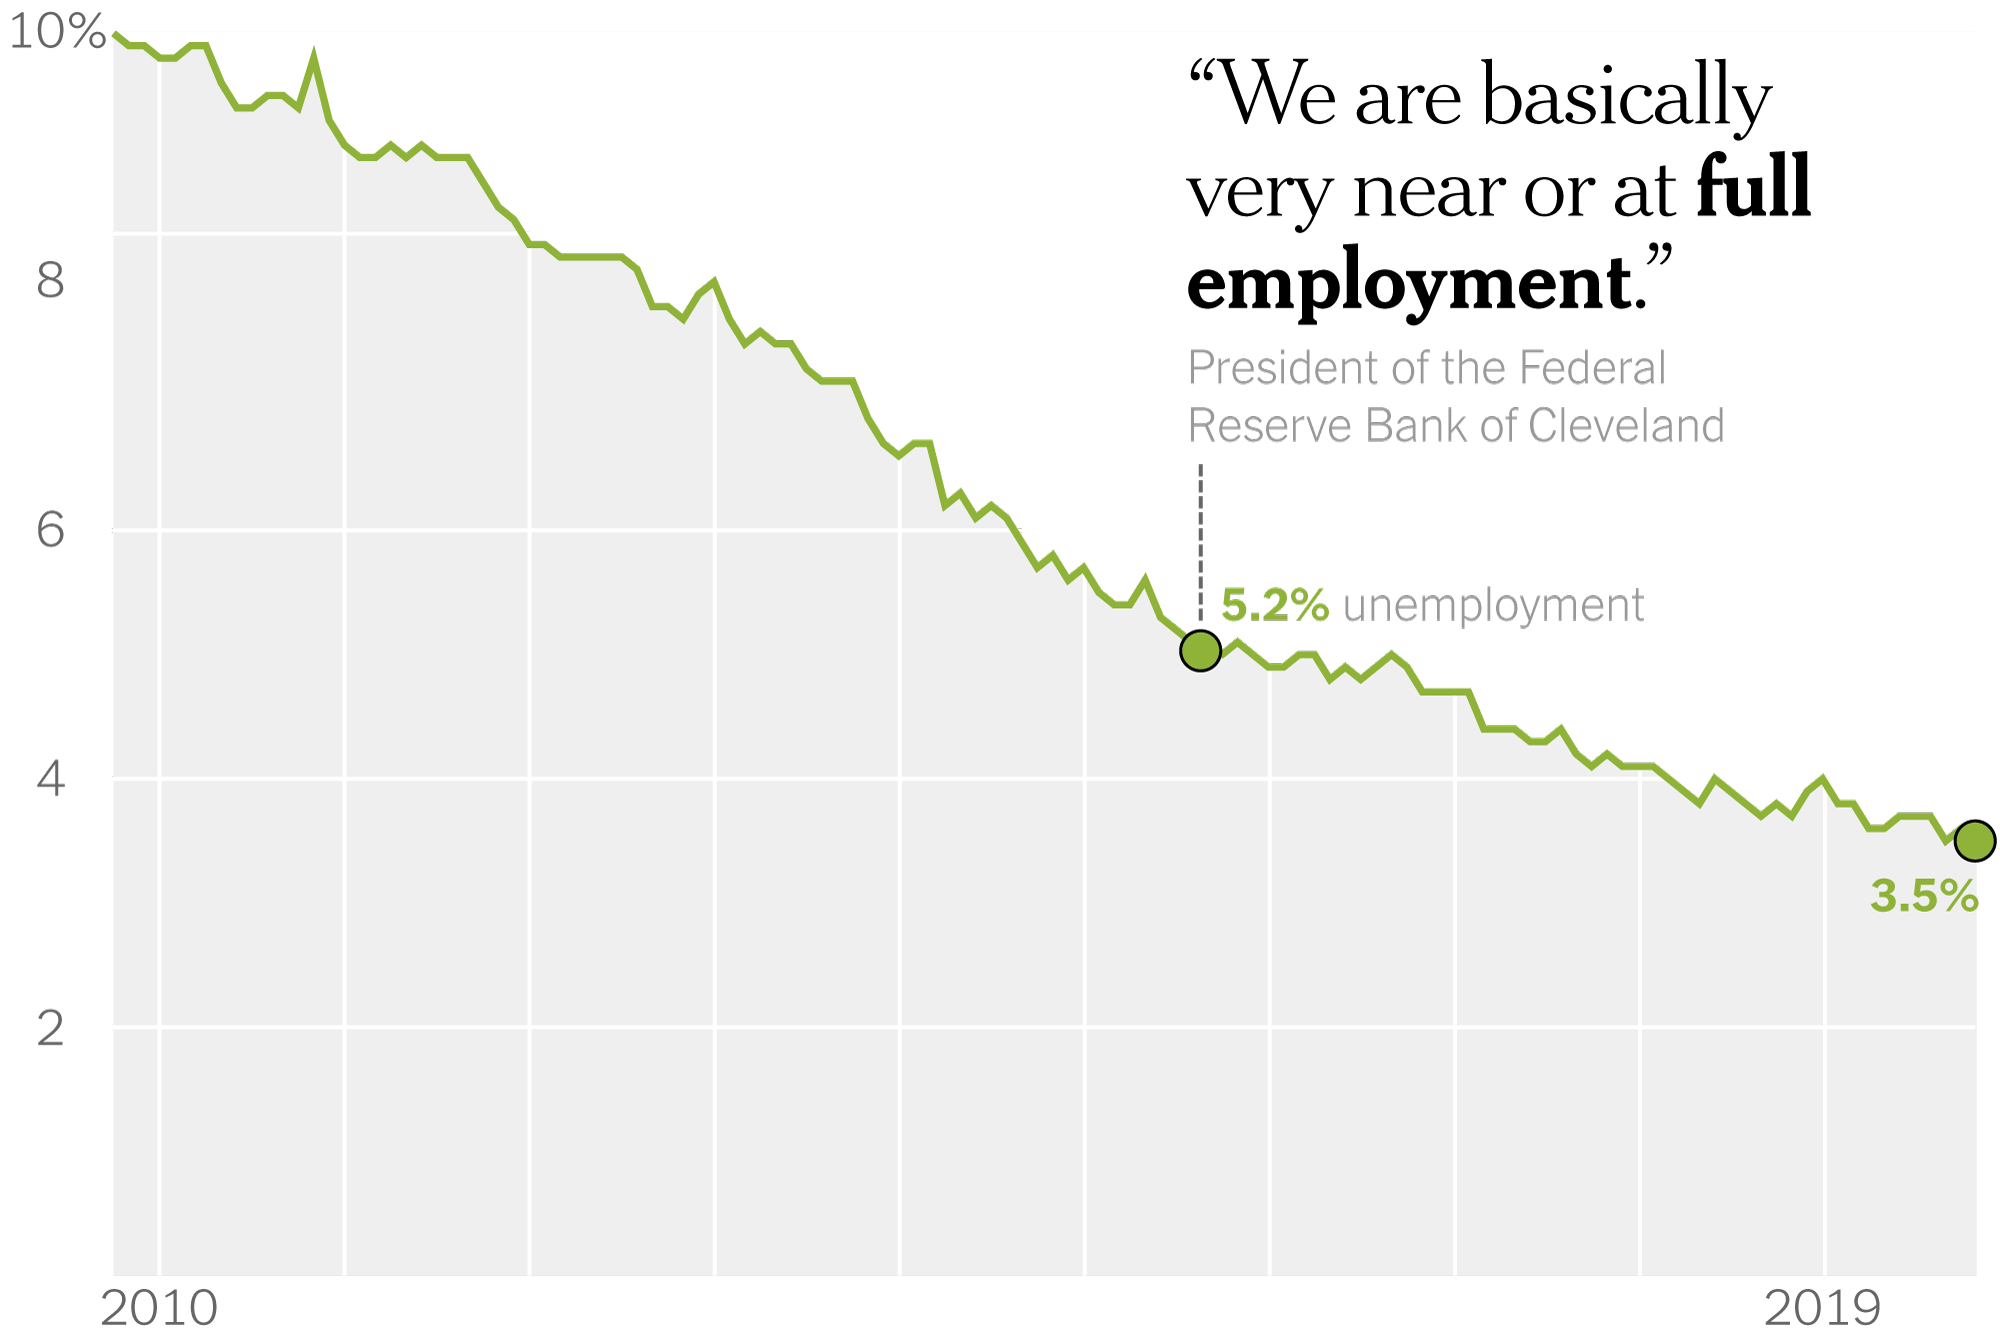
Neil Irwin’s 2015 article
Neil Irwin’s 2015 article
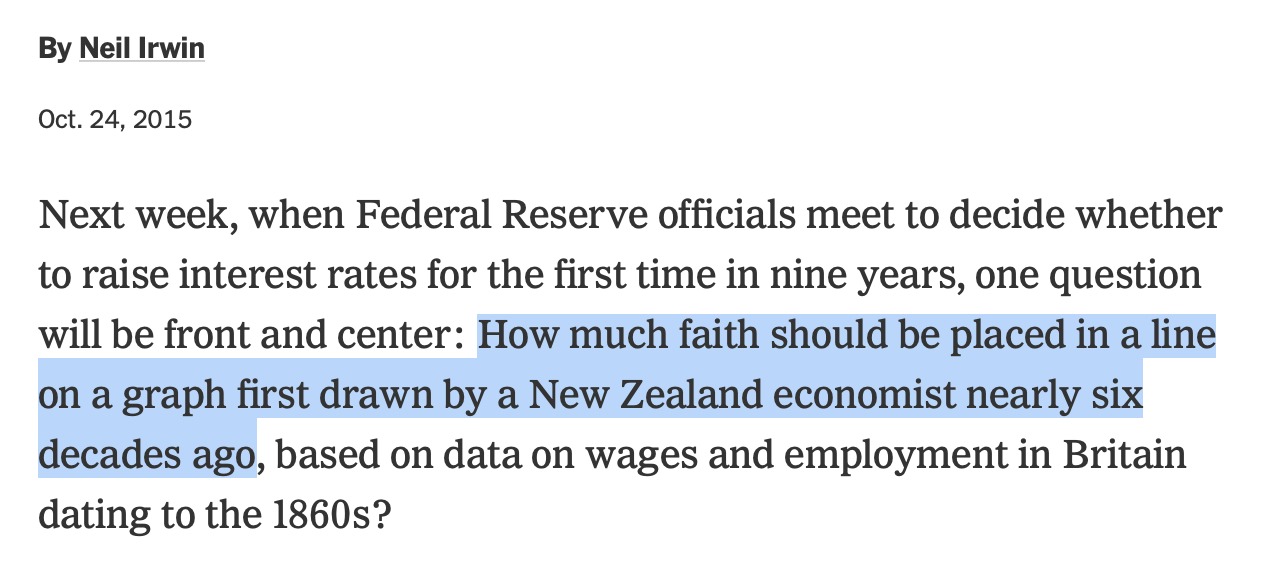
Neil Irwin’s 2015 article
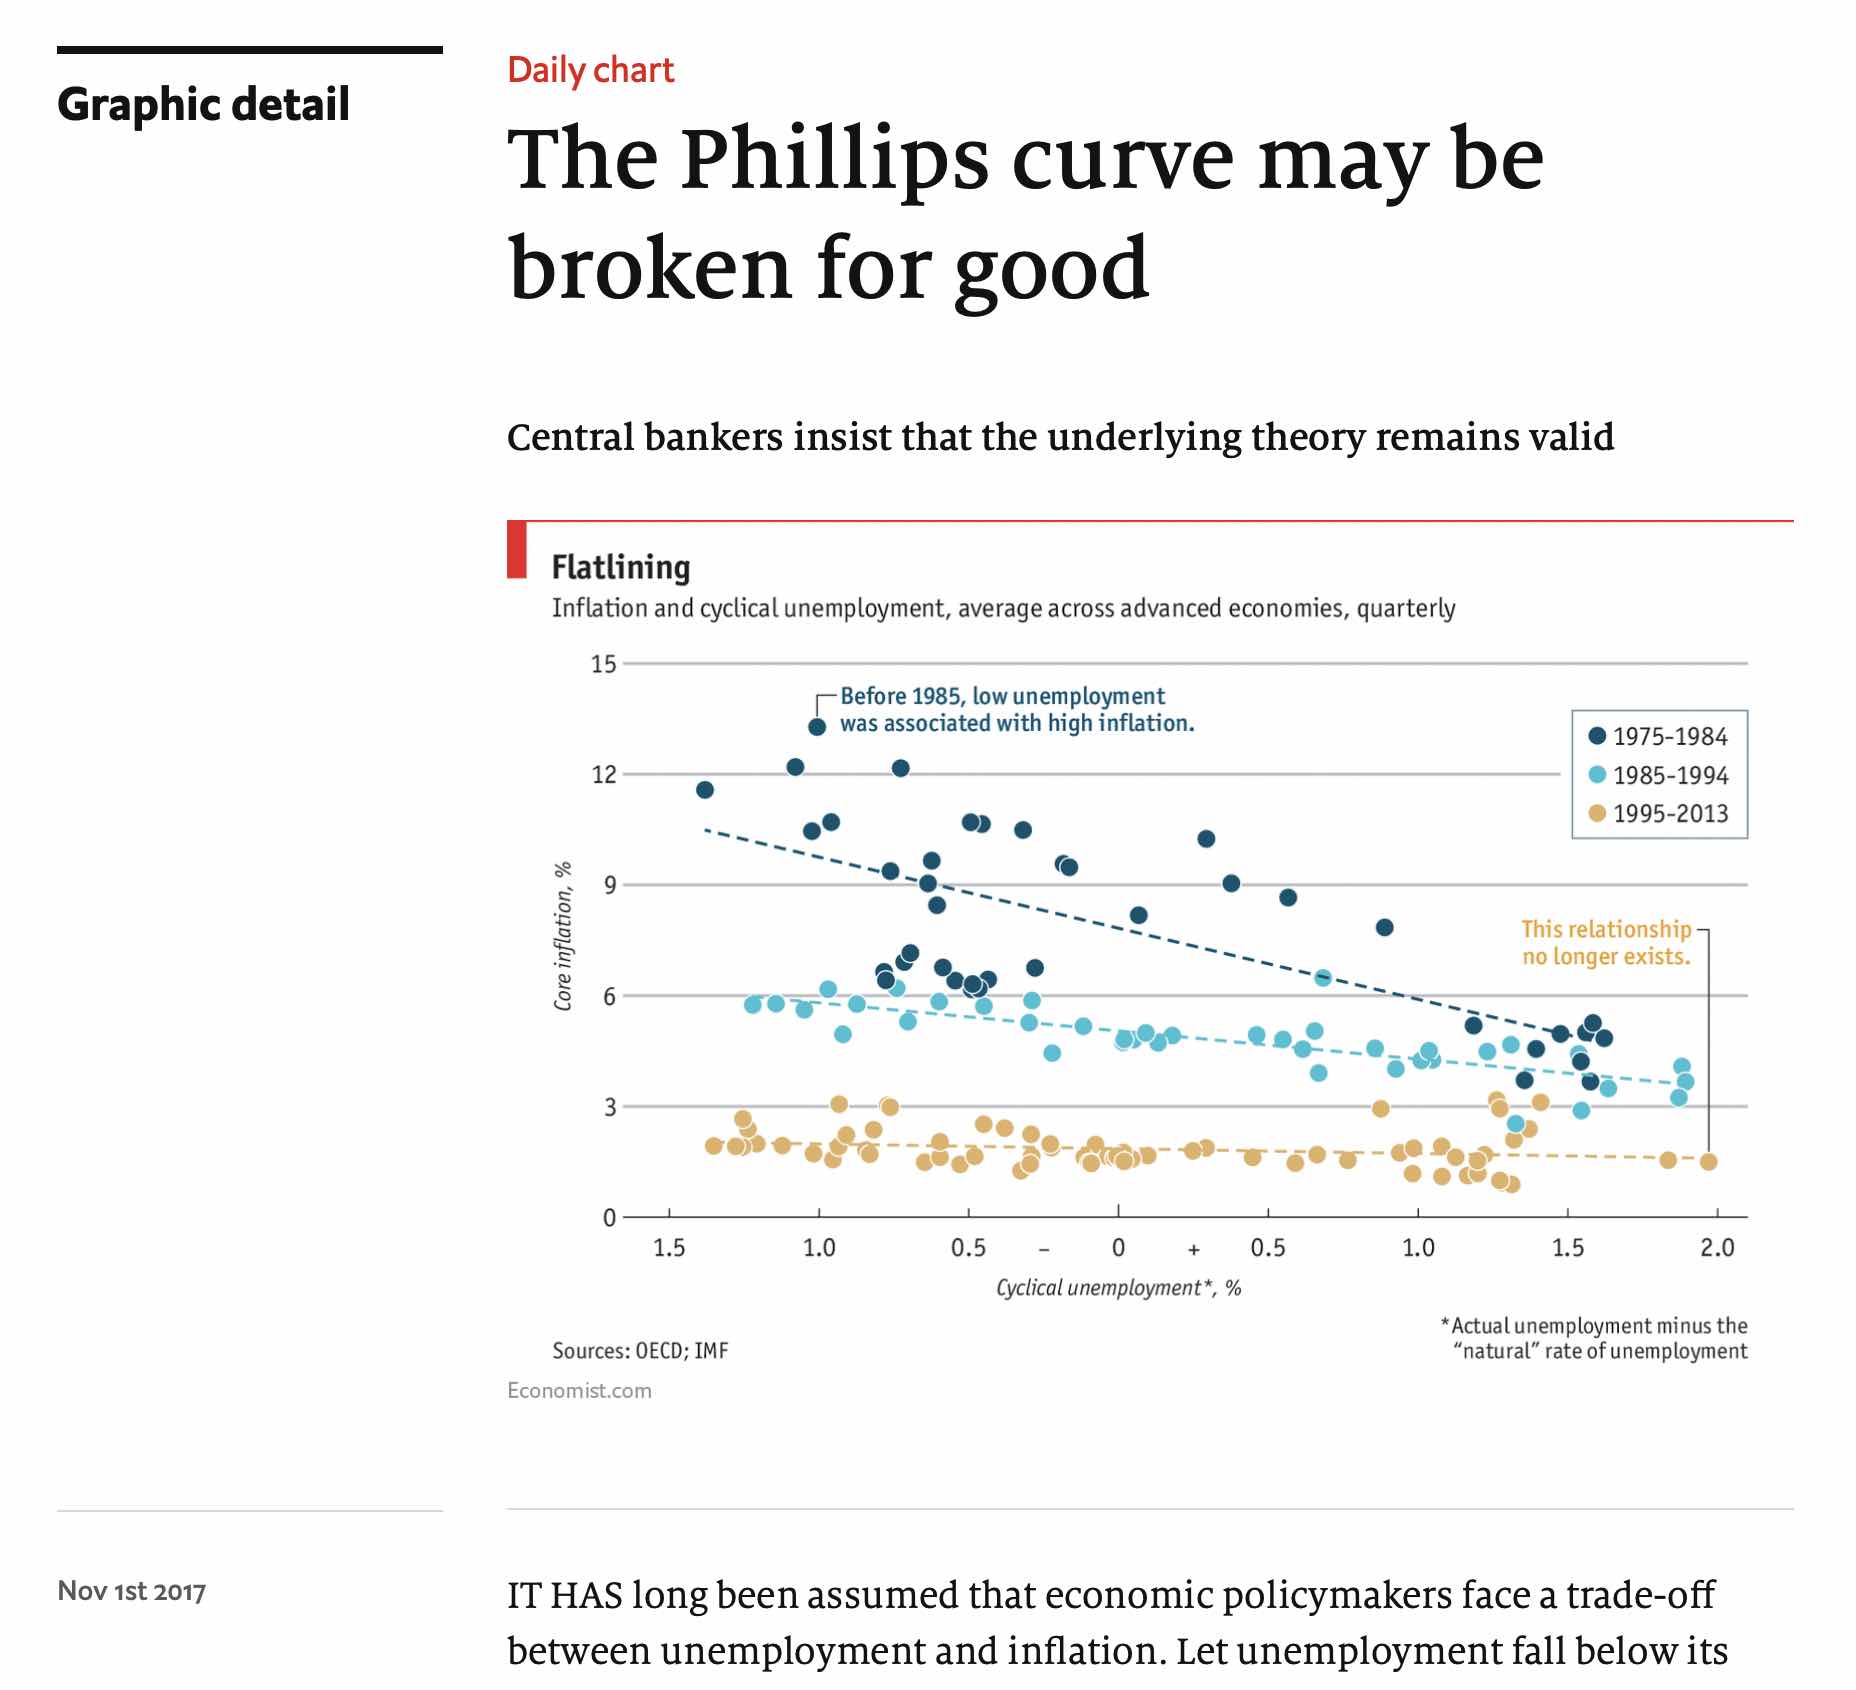
The Economist - Phillips Curve Broken for good?
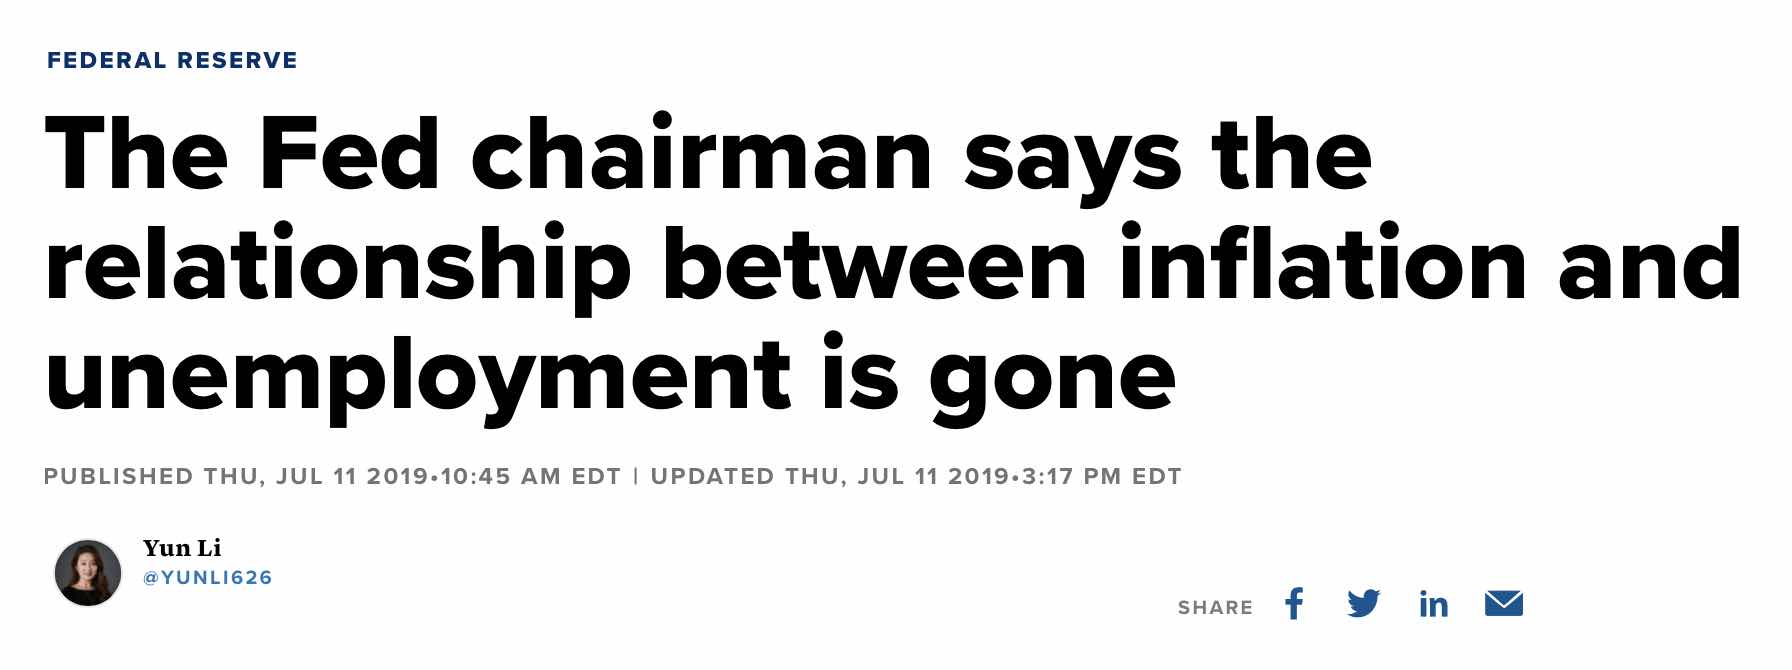
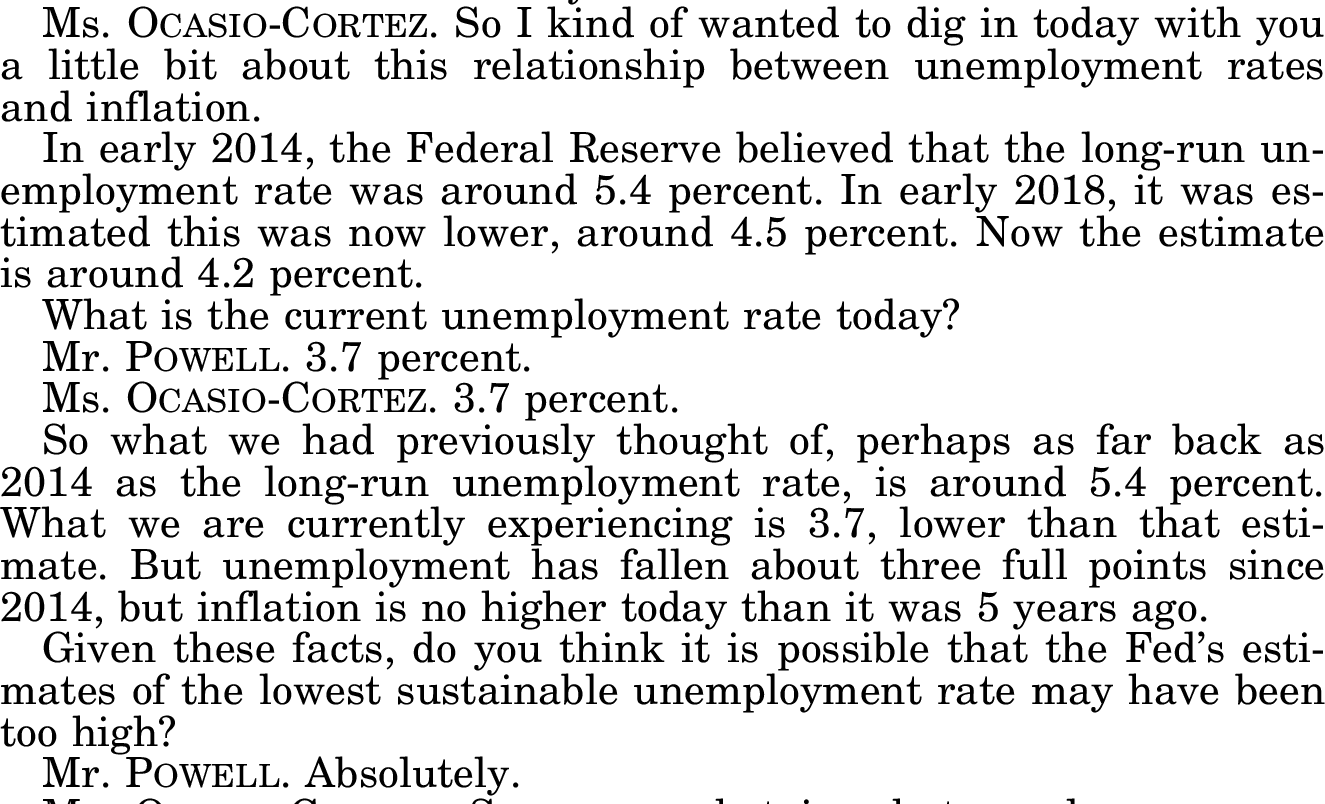
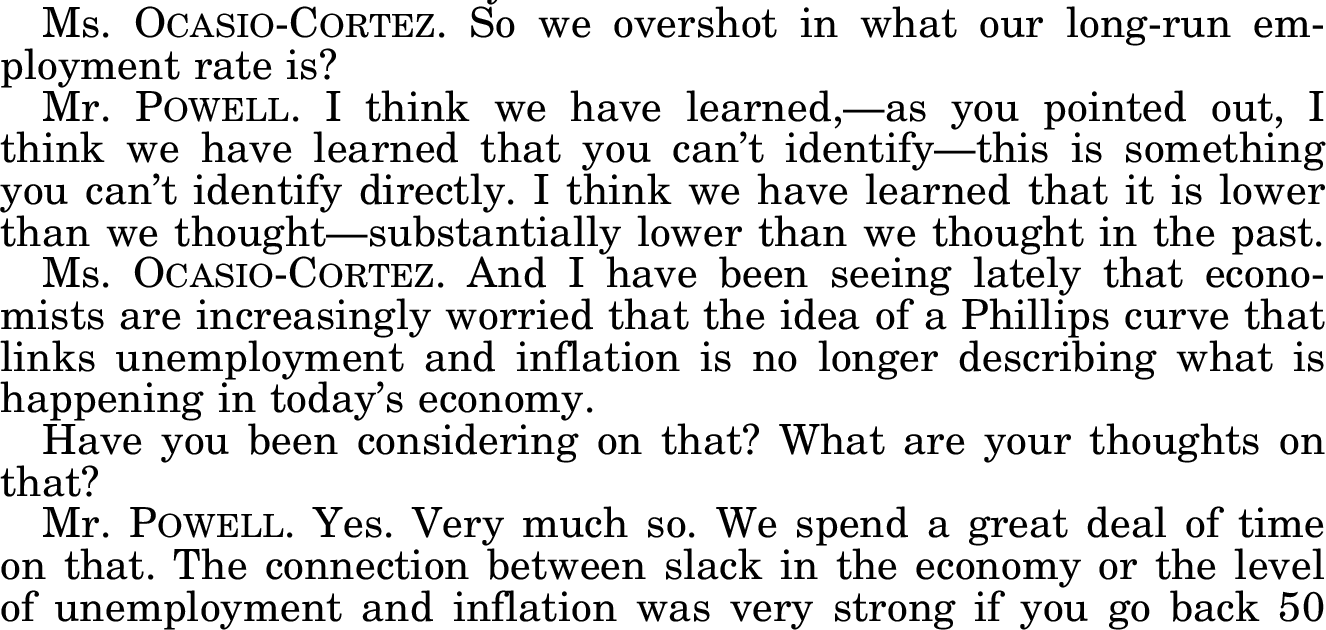
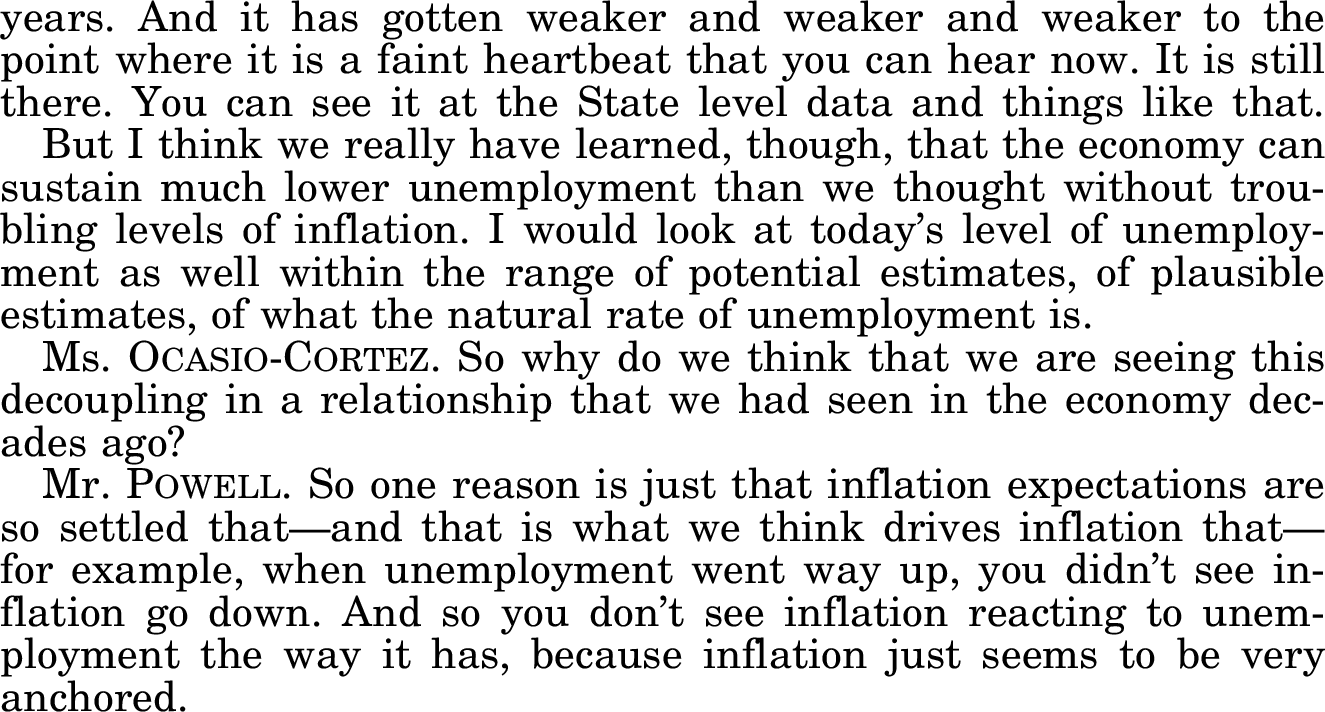
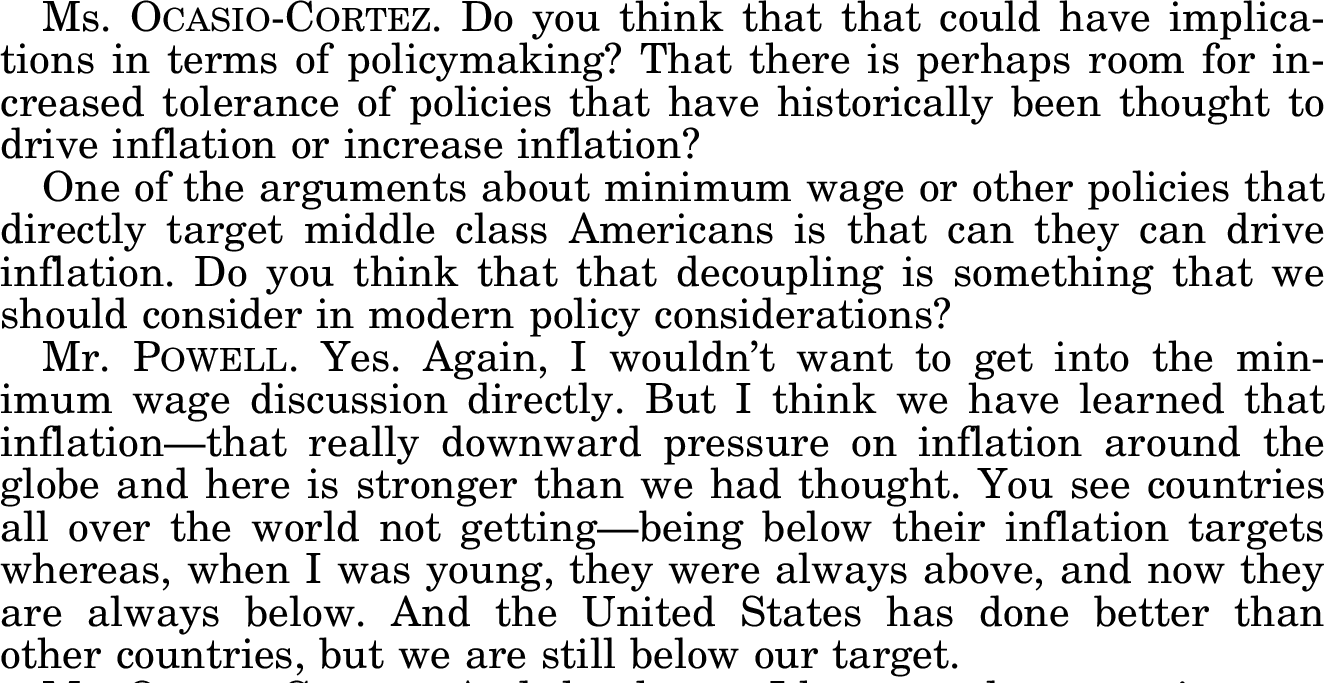
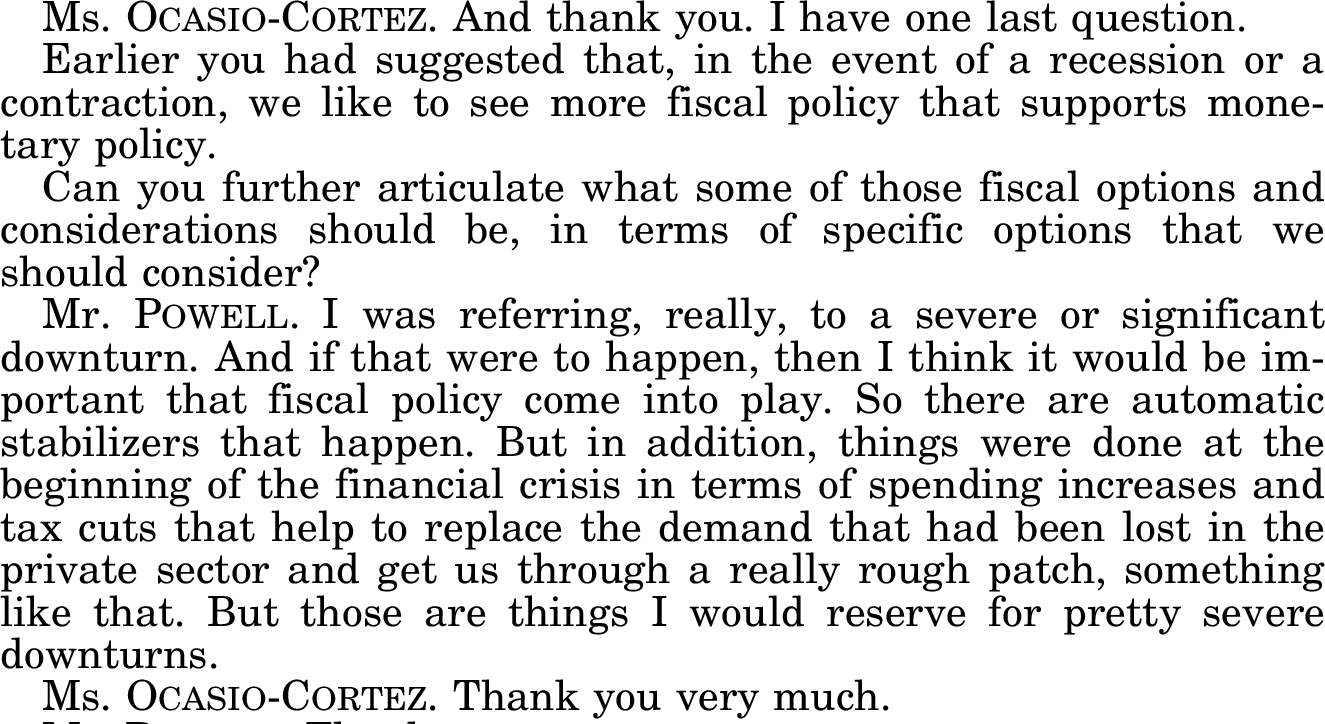
2019 - Powell
Fed Minutes, 1997
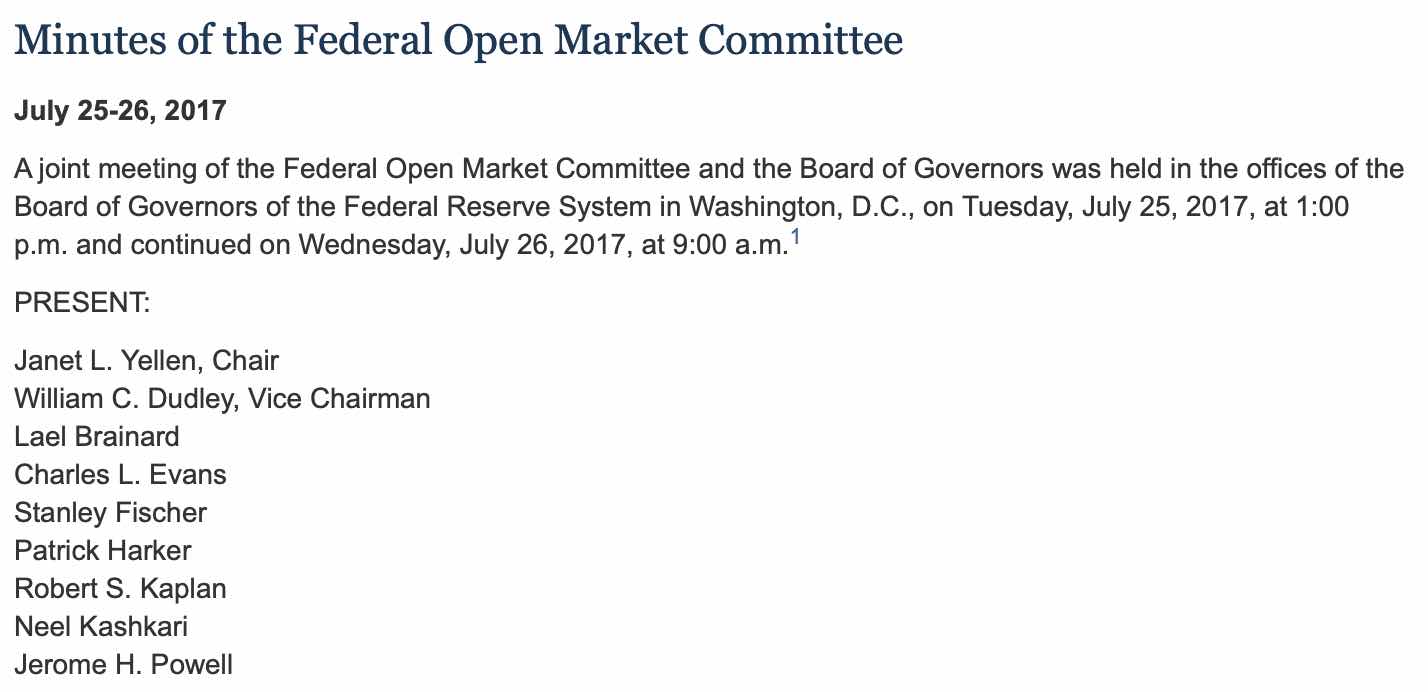
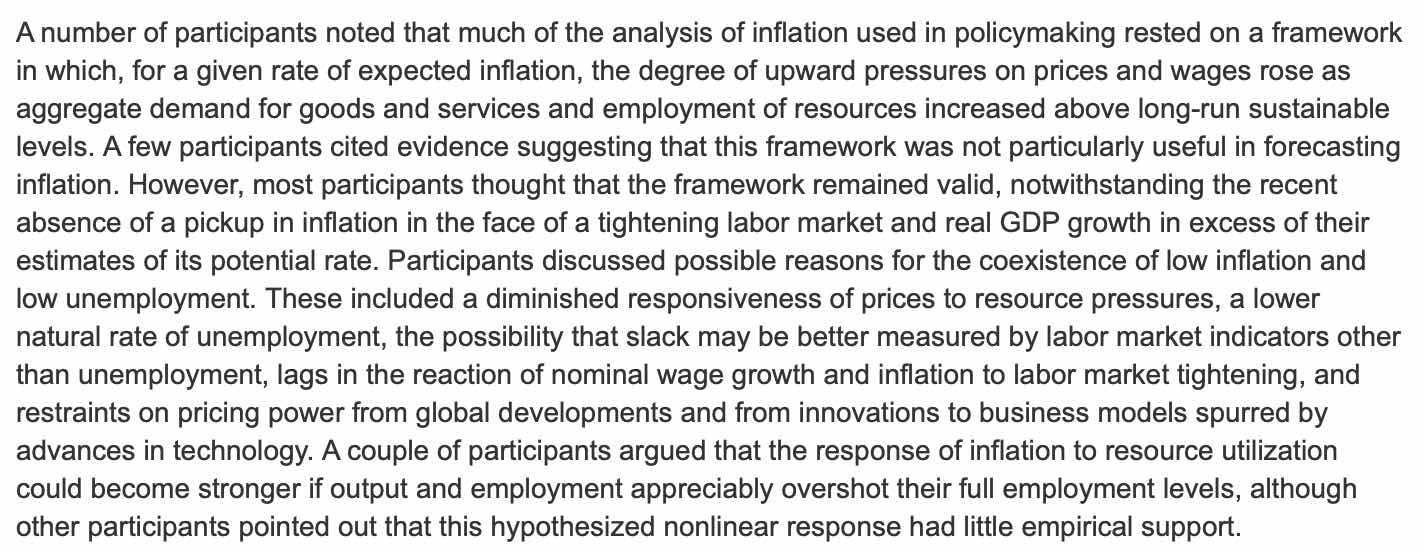
Fed Members have doubts
Summer 2019 - Phillips Curve “Wars”
Many discussions in 2019
However, even this does not really work.
Read: “The world economy’s strange new rules.” The Economist, October 10, 2019.
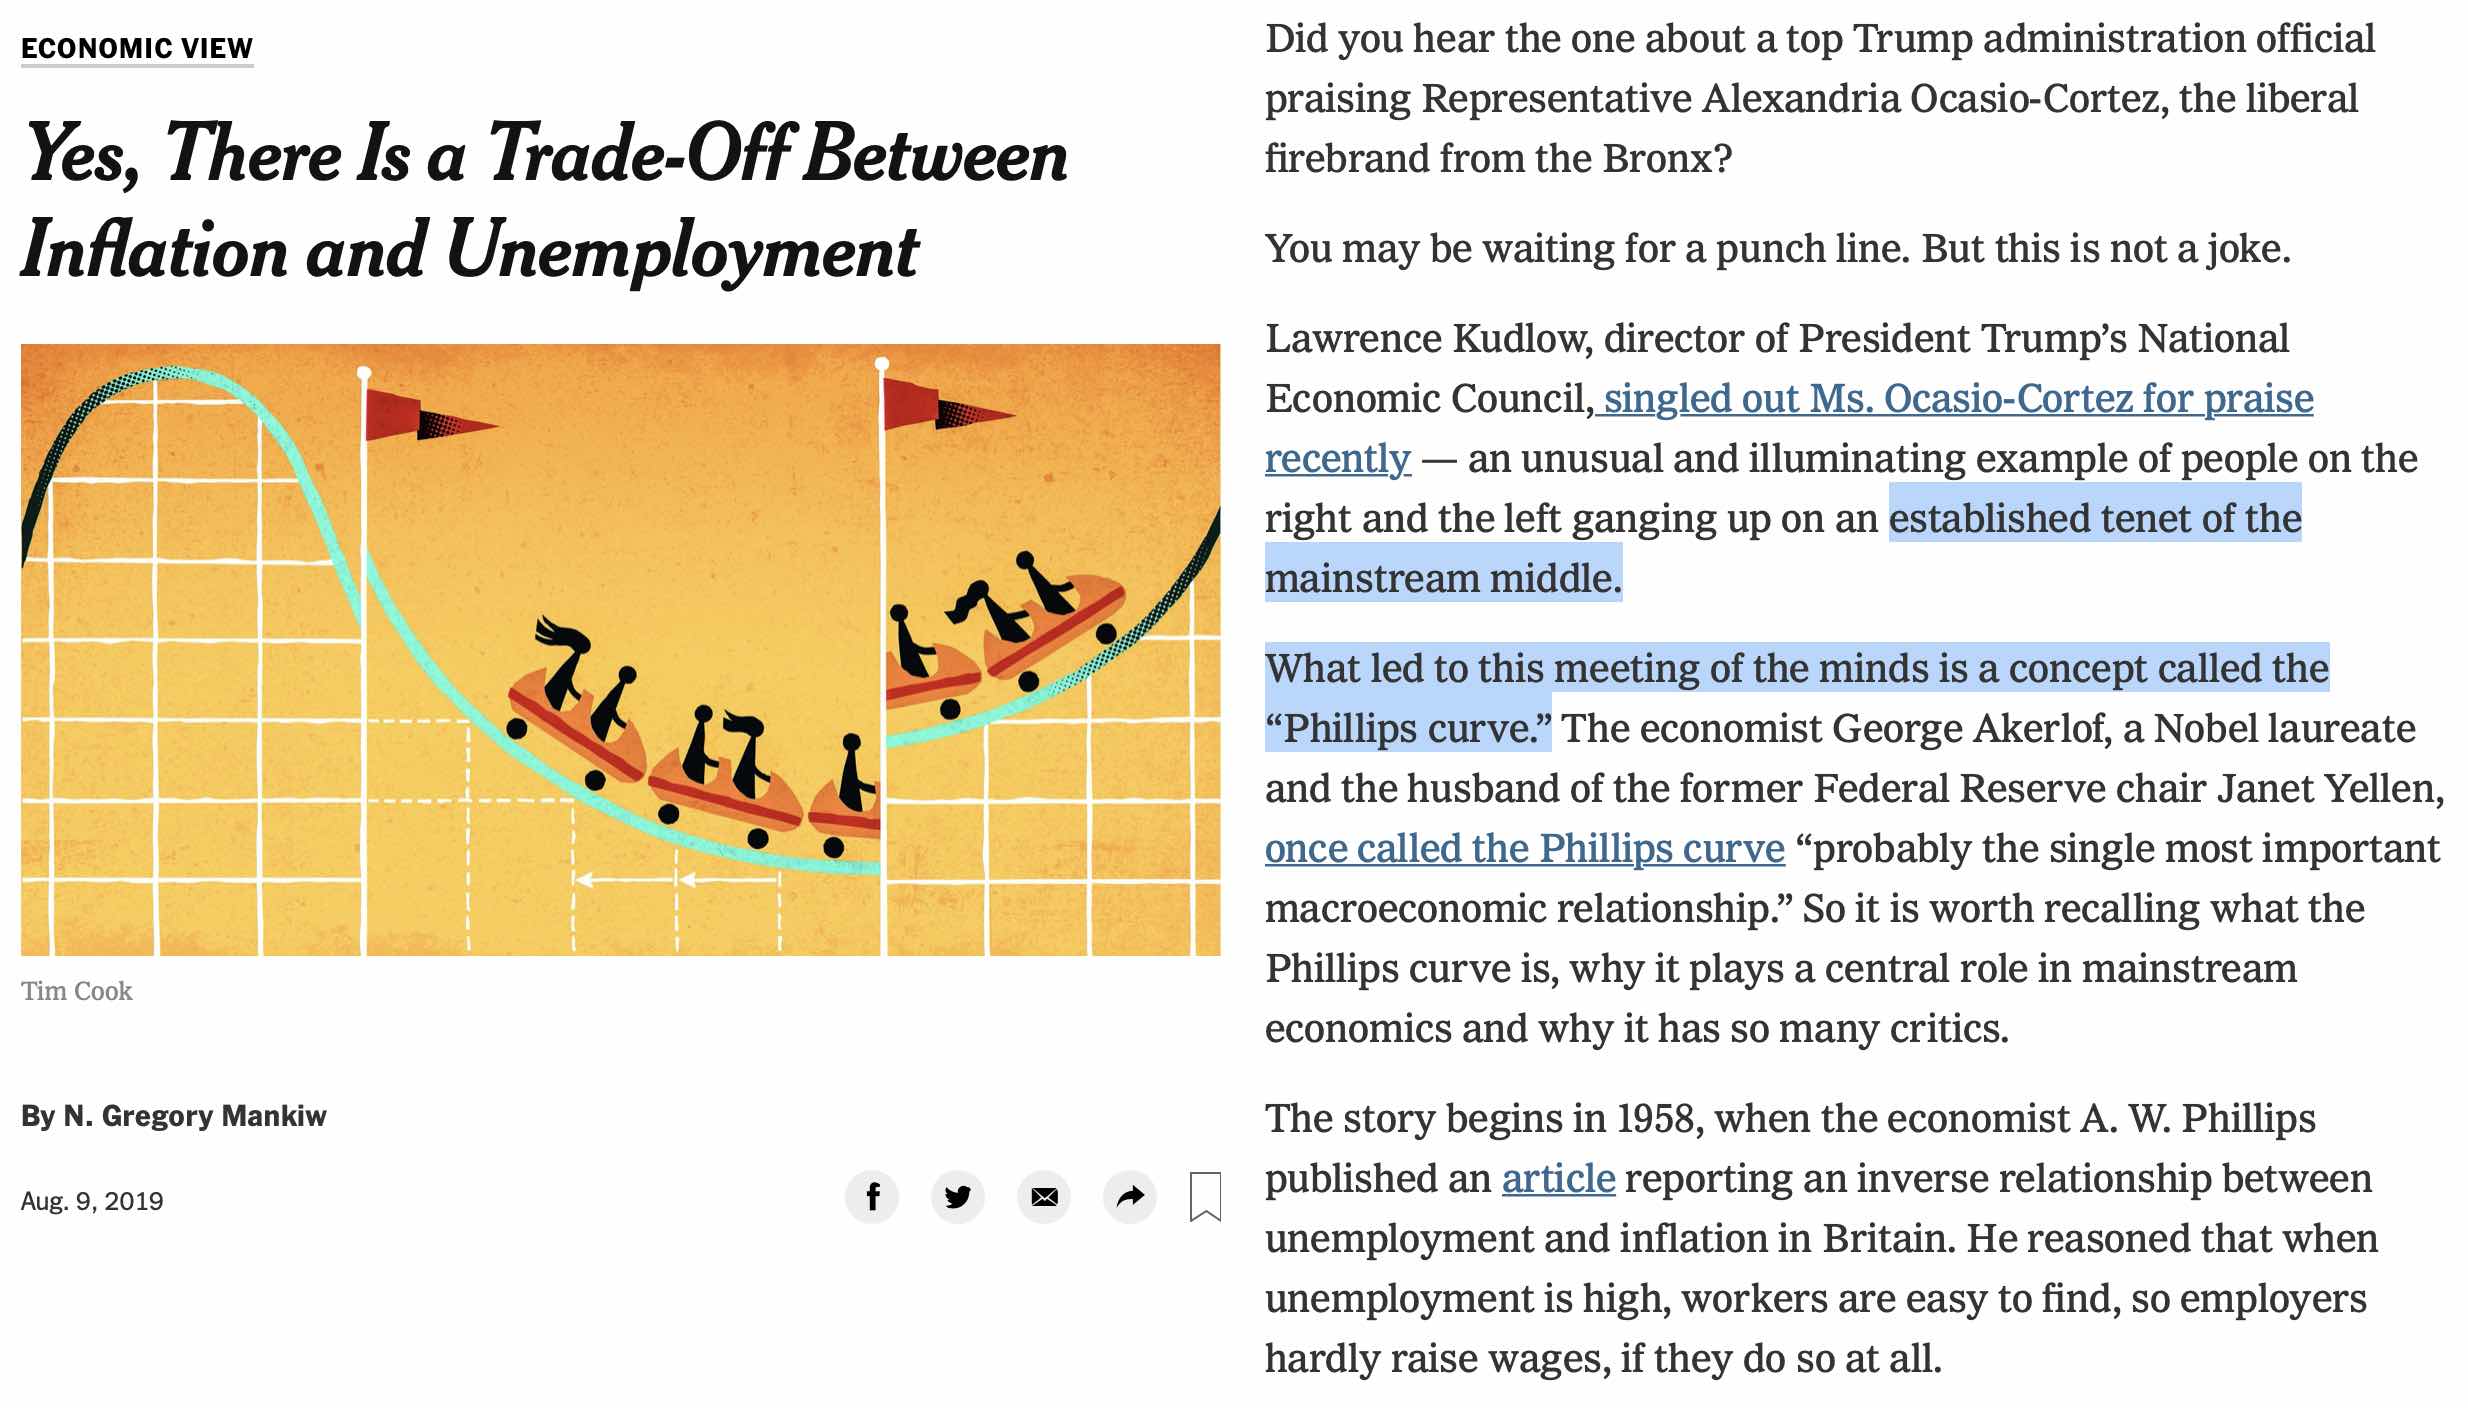
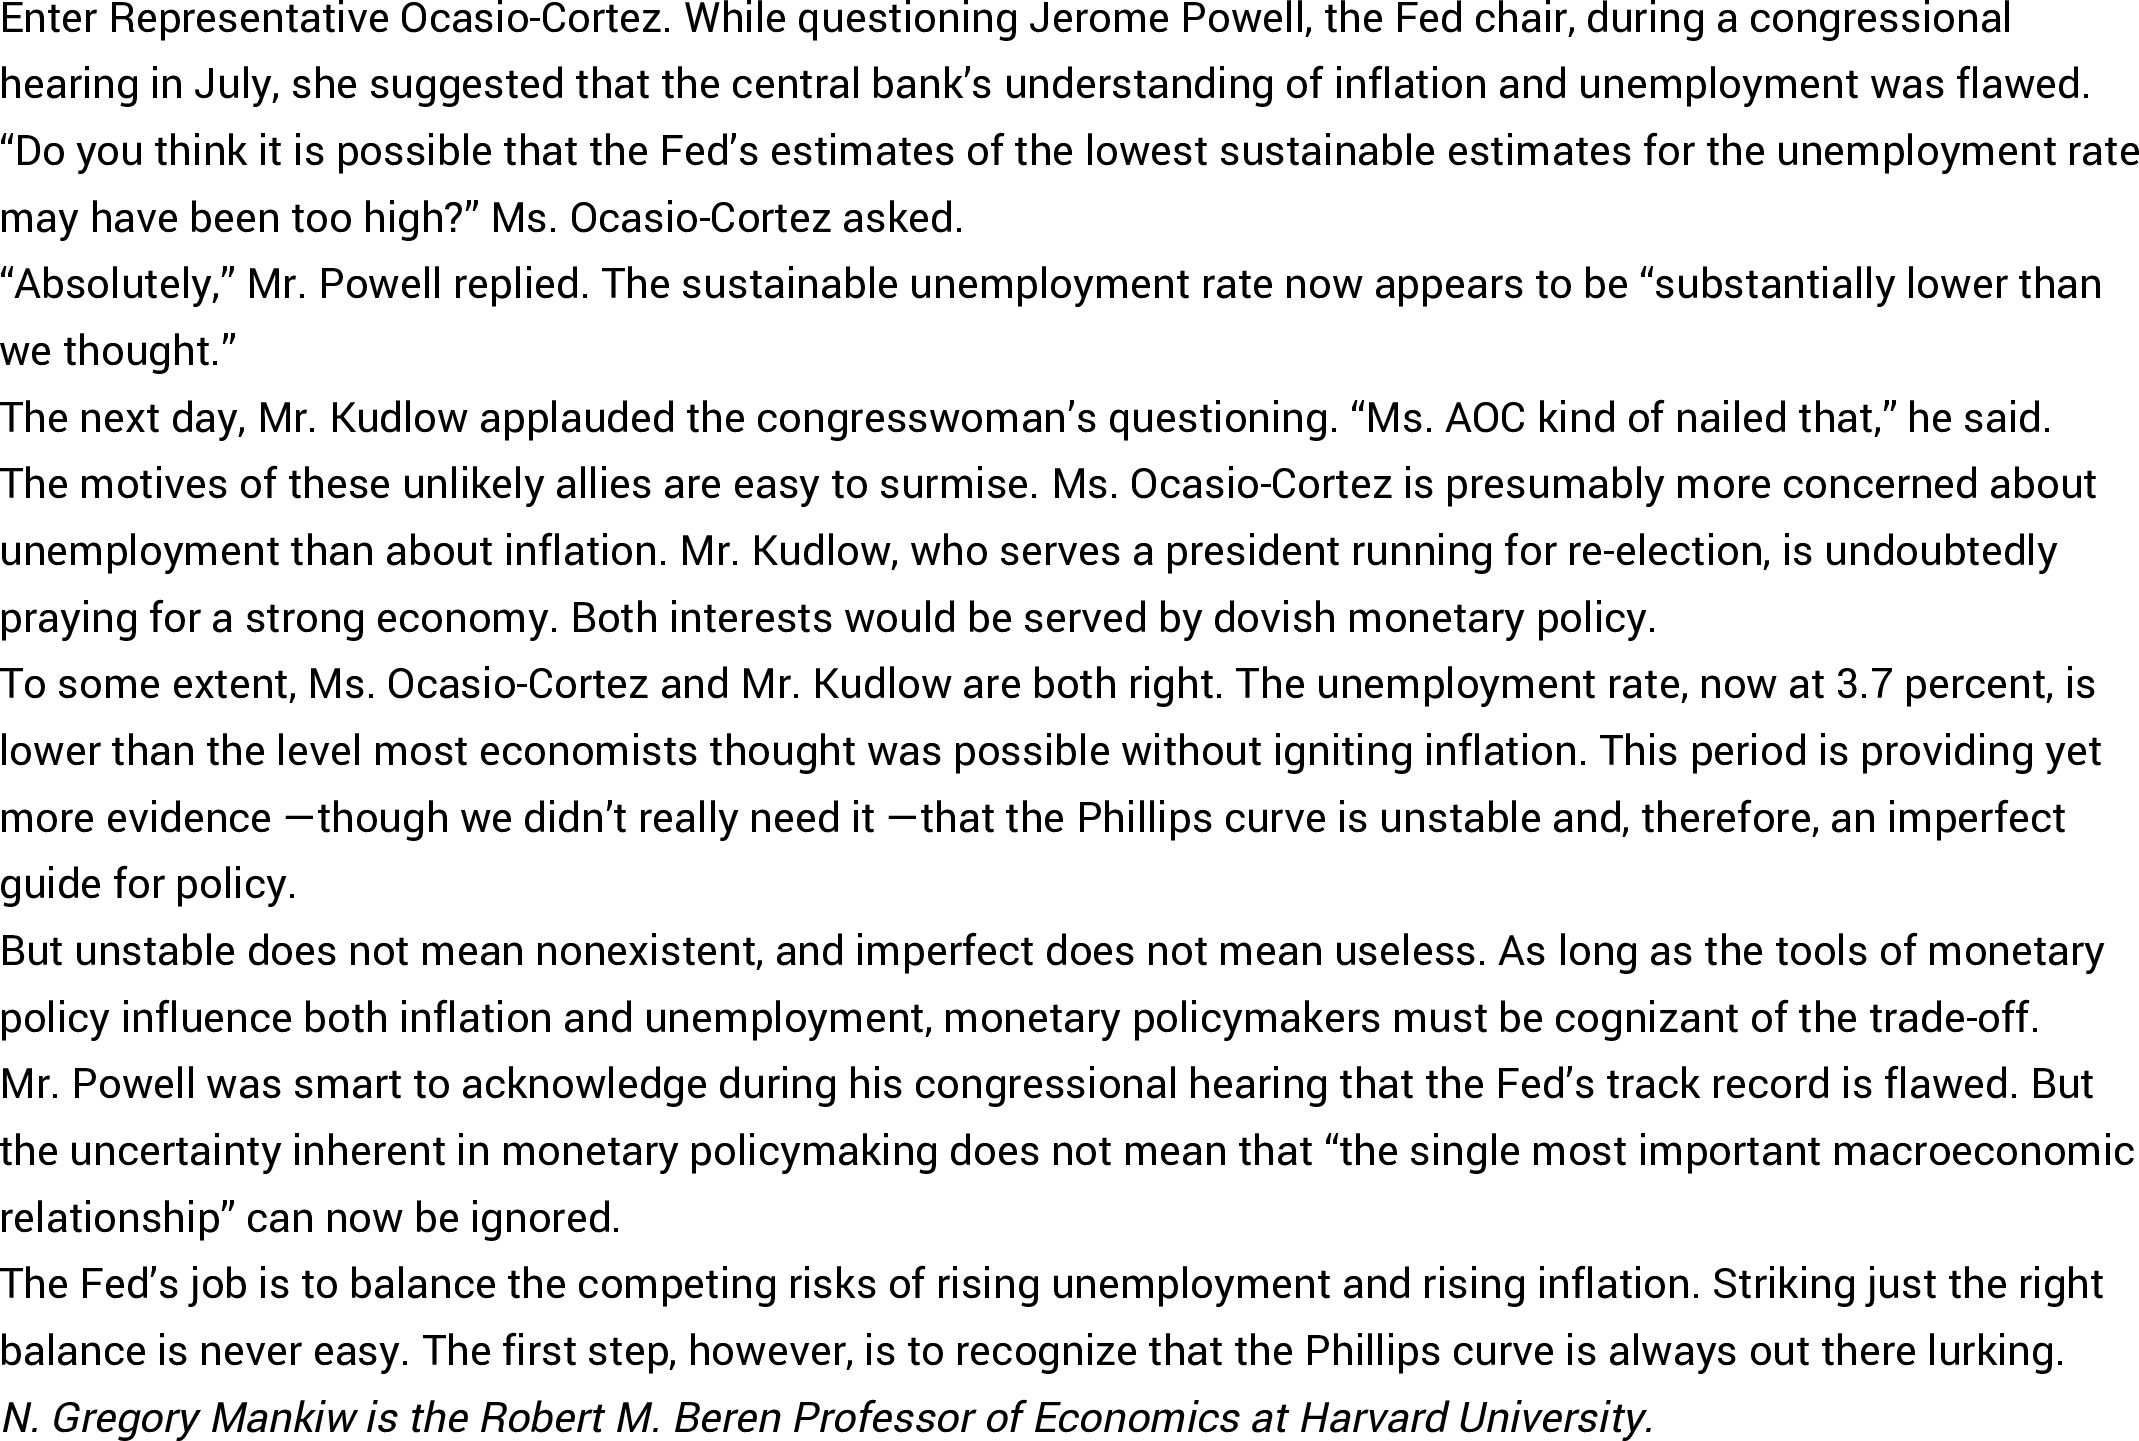
AOC and Jay Powell are talking about this
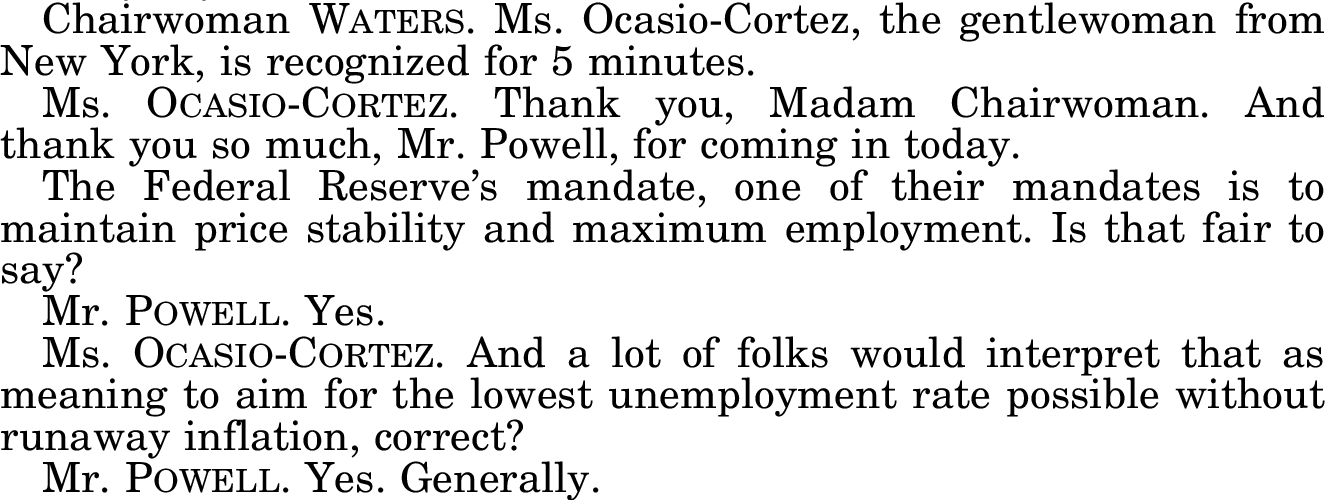
“Established tenet of the mainstream middle”
Response
Is there a “natural rate of unemployment?”
My own thoughts
Phillips (1958)’s evidence
Phillips Curve: Sticky Prices or Wages?
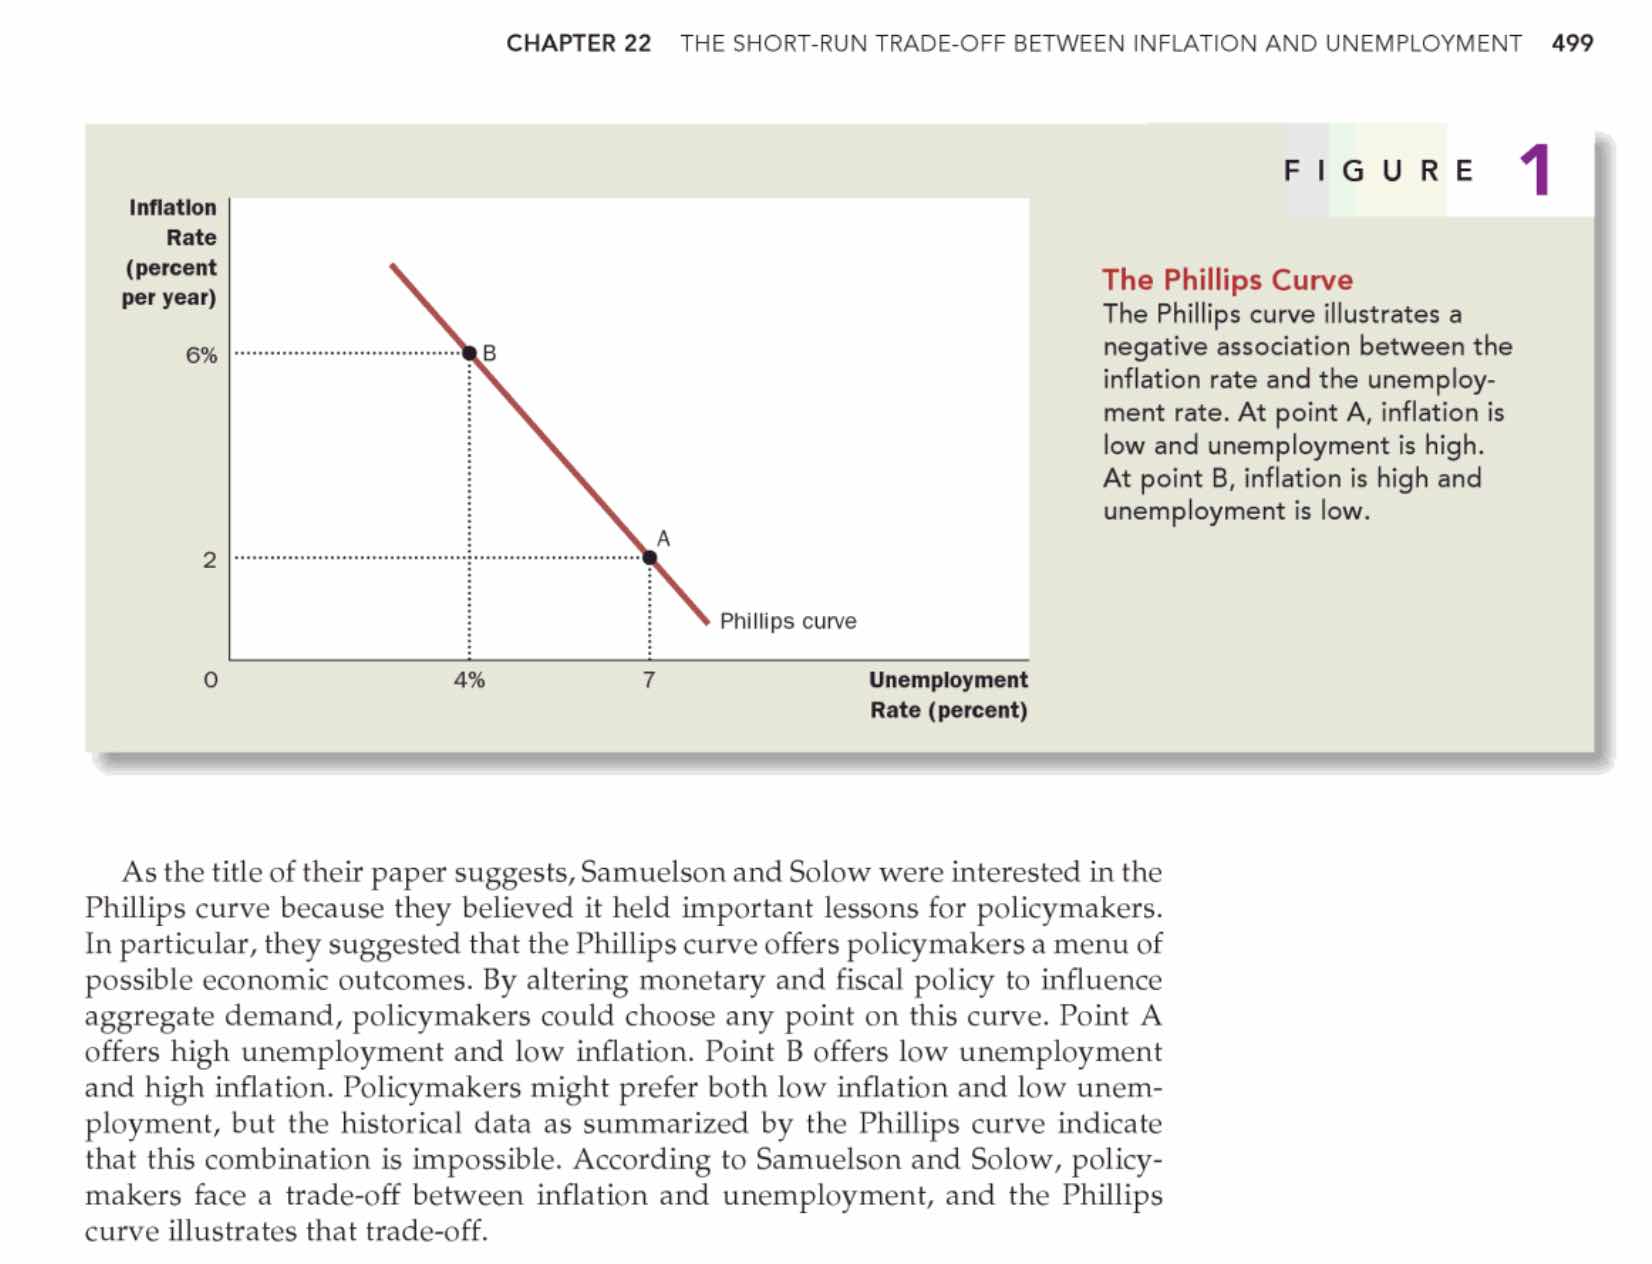
Neoclassical synthesis \(=\) negative correlation is a trade-off:
High aggregate demand \(\Rightarrow\) Low unemployment.
High aggregate demand \(\Rightarrow\) High inflation (or Accelerating inflation, in the Rational Expectations version).
Then, the Phillips curve came to be relation between price inflation and unemployment.
Phillips curve = Aggregate Supply curve:
Central bank’s mandate and policy.
Undergraduate textbooks: Blanchard’s, Mankiw’s, etc.
Macroeconomic research.
Neoclassical Synthesis
Neoclassical Synthesis: Since Paul Samuelson and Robert Solow, the long-run is assumed to be the domain of neoclassical forces, while only the short-run is Keynesian (because of sticky prices).
Defined by Paul Samuelson in the 3rd edition of his Economics textbook (1955, p. 212):
In recent years 90 percent of American economists have stopped being ‘Keynesian economists’ or ‘anti-Keynesian economists.’ Instead they have worked towards a synthesis of whatever is valuable in older economics and in modern theories of income determination. The result might be called neo-classical synthesis and is accepted in its broad outlines by all but about 5 per cent of extreme left wing and right wing writers.
- According to the neoclassical synthesis, the reason why output is determined by aggregate demand in the long run is not overaccumulation of capital, or oversaving but sticky prices.
Issues with the Phillips curve
The Phillips Curve is subject to repeating controversies:
1970s: high inflation and high unemployment in the U.S. (“stagflation.”) \(\Rightarrow\) “accelerationist” Phillips curve.
Late 1990s: missing inflation, despite low unemployment.
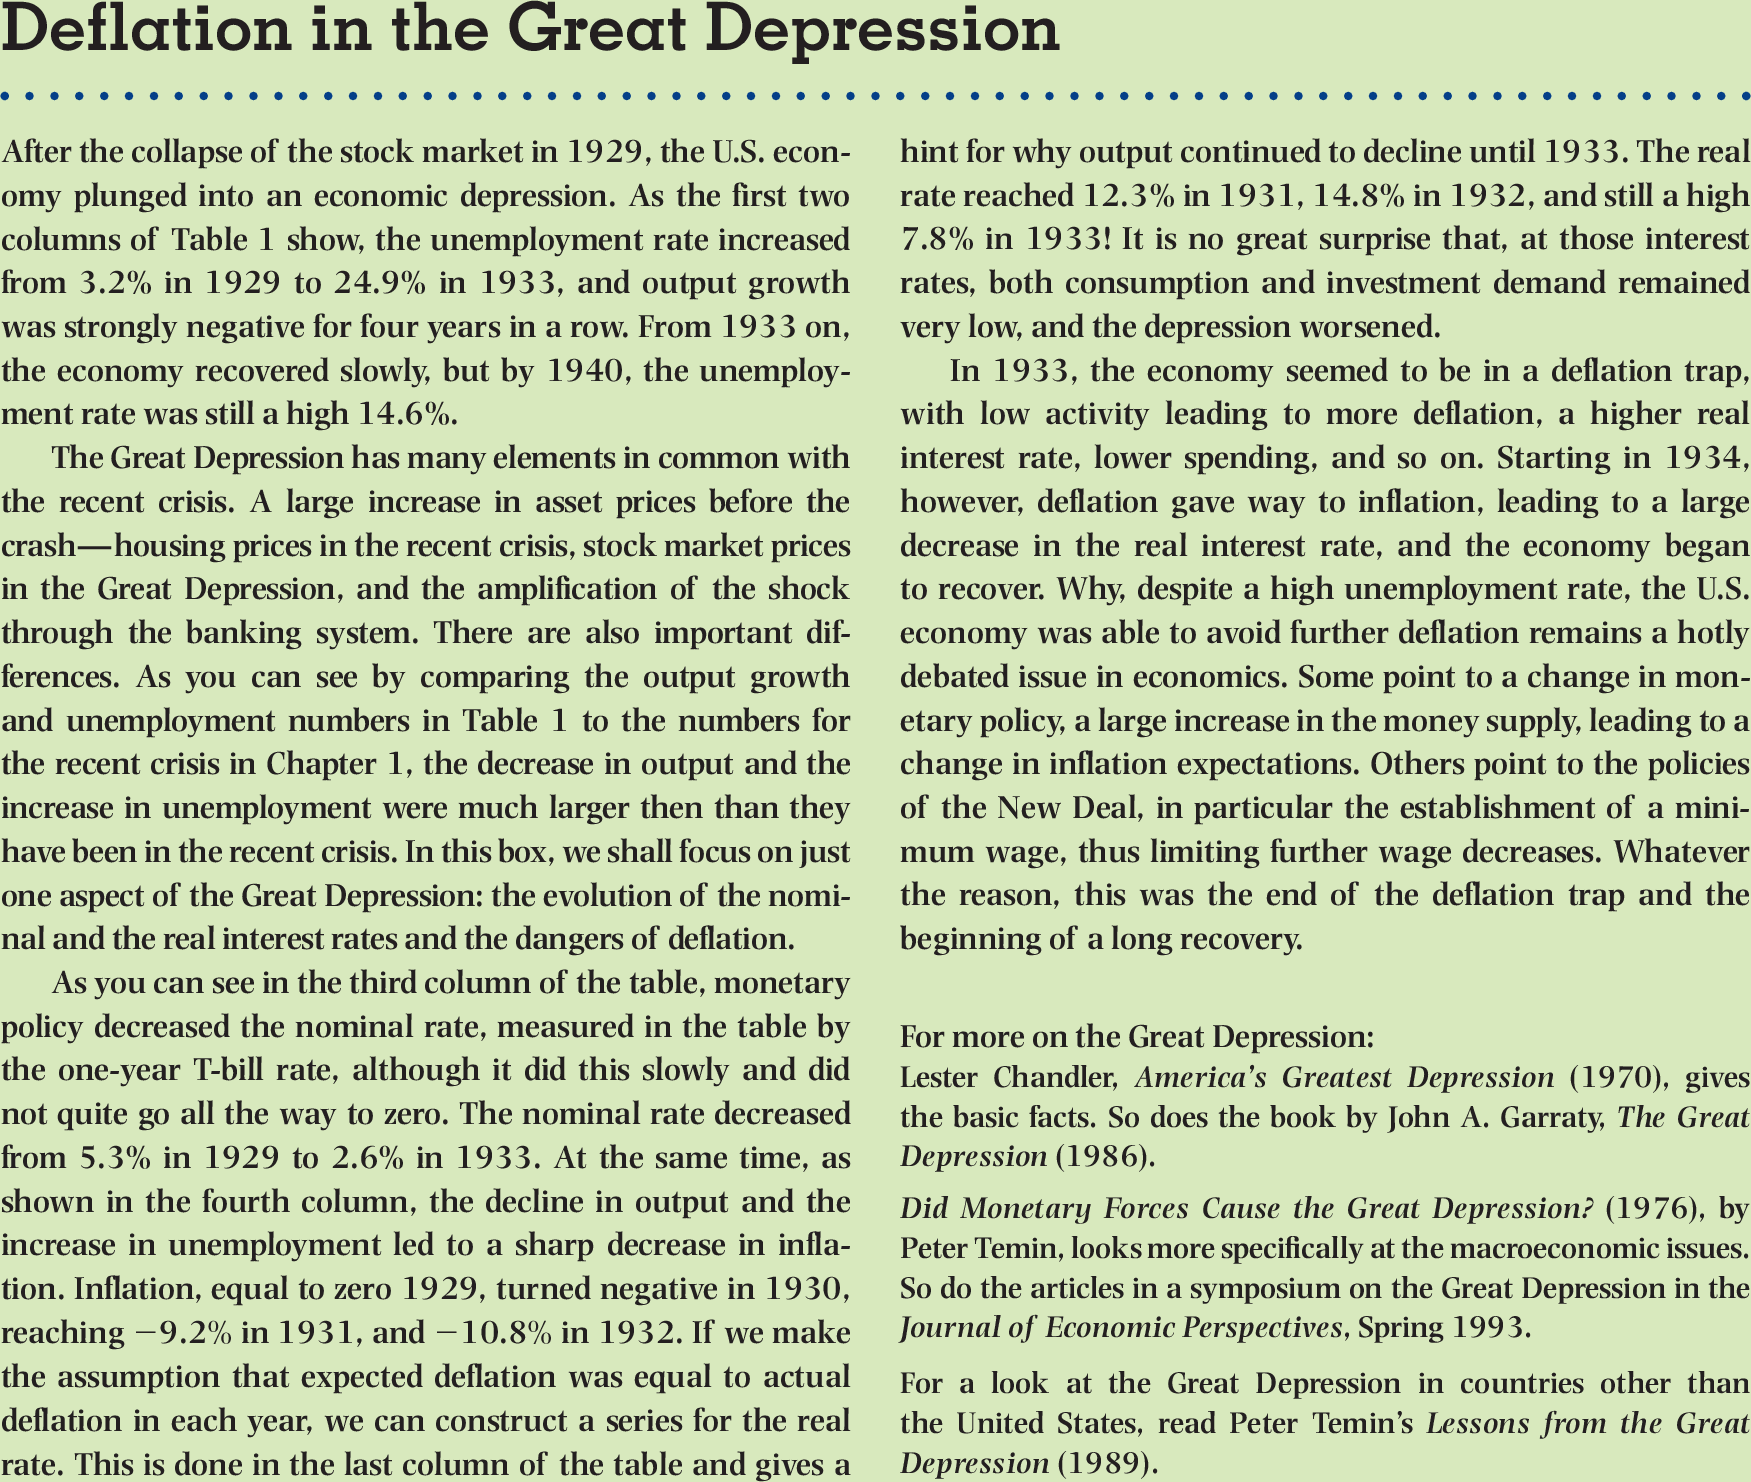
2007-2009: missing deflation, despite worst crisis since the Great Depression.
- Krugman (2018): “a big failure in our understanding of price dynamics.”
2013-2019: missing inflation, despite unprecedented stimulus since 2016.
- Yellen (2017): “the biggest surprise in the U.S. economy.”
Problems with the Phillips Curve
Because of these empirical problems with the Phillips curve, I do not believe in the sticky-price view of Keynesian economcis / the Phillips curve.
I am not alone: for example, Larry H. Summers, former Treasury secretary, winner of the John Bates Clark medal (the most prestigious award for economists below 40), also does not believe in the Phillips curve, and said so in 1991. See Summers (1991): “Should Keynesian Economics Dispense with the Phillips Curve?”
Note: I have done research suggesting the Phillips curve is actually only present in fixed exchange rate regimes, not flexible. To me, it’s a correlation between real exchange rates and unemployment.
In this class, we took a more agnostic view on the “Aggregate Supply curve.”
Conclusion
Taking Stock
It is important to recognize that most mainstream Keynesian economics is based on the Phillips curve.
At least all teaching at the undergraduate level is based on that.
Usually, people who criticize the Phillips curve think that all business cycle movements are driven by supply.
In contrast, I believe that most business cycles are actually driven by aggregate demand.
Why do I teach it if I don’t believe it ?
It is extremely important for the history of economic thought, and even for the history of economic policies. 1960s - 1970s: Attacks on Keynesianism were largely based on the failure of the Phillips Curve.
Interpretation of stagflation. The so-called stagflation was seen as a blow to Keynesianism, and aggregate demand policies. Led to all sorts of theoretical attacks against Keynesianism. It took a lot of time for mainstream Keynesian economists to come up with a response, and some would argue it never was fully convincing.
Hugely influential for policy. Idea of a “natural rate of unemployment”: some unemployment could actually be tolerated. It is extremely influential in policy circles, central banks, and Treasury departments around the world.
If you want to know a bit more about the Phillips curve - or at least what my thoughts are on the Phillips curve, see my 2nd year Ph.D. class here: https://fgeerolf.com/econ221/handouts/phillips.html. Note: this is absolutely not exam material.