
Last observation: 19 oct. 2026 (N = 12)
First observation: 2 janv. 1980 (N = 2)
Last data update: 20 oct. 2026, 01:55
Last compile: 20 oct. 2026, 01:59
| symbol | Symbol | Nobs |
|---|---|---|
| AAPL | Apple | 11555 |
| AMD | Advanced Micro Devices, Inc. | 11743 |
| AMZN | Amazon | 7403 |
| GOOG | Alphabet | 5577 |
| INTC | Intel Corporation | 11743 |
| KO | The Coca-Cola Company | 11795 |
| META | Meta | 3625 |
| MSFT | Microsoft | 10229 |
| NVDA | NVIDIA Corporation | 6978 |
| PEP | PepsiCo, Inc. | 11795 |
| TSLA | Tesla | 4102 |
| TSM | Taiwan Semiconductor Manufacturing Company Limited | 7301 |
plot_linear <- stocks |>
  filter(symbol %in% c("META", "TSLA", "NVDA", "AMZN", "GOOG", "MSFT", "AAPL")) |>
  filter(date >= as.Date("1990-01-01")) |>
  left_join(symbol, by = "symbol") |>
  group_by(symbol) |>
  arrange(date) |>
  mutate(close = 100*close/close[1]) |>
  ggplot() + geom_line(aes(x = date, y = close, color = Symbol)) +
  theme_minimal() + xlab("") + ylab("") +
  theme(legend.title = element_blank(),
        legend.position = c(0.5, 0.9)) +
  scale_y_continuous(breaks = seq(0, 1000000, 20000)) +
  scale_x_date(breaks = as.Date(paste0(seq(1945, 2100, 5), "-01-01")),
               labels = date_format("%Y"))

plot_linear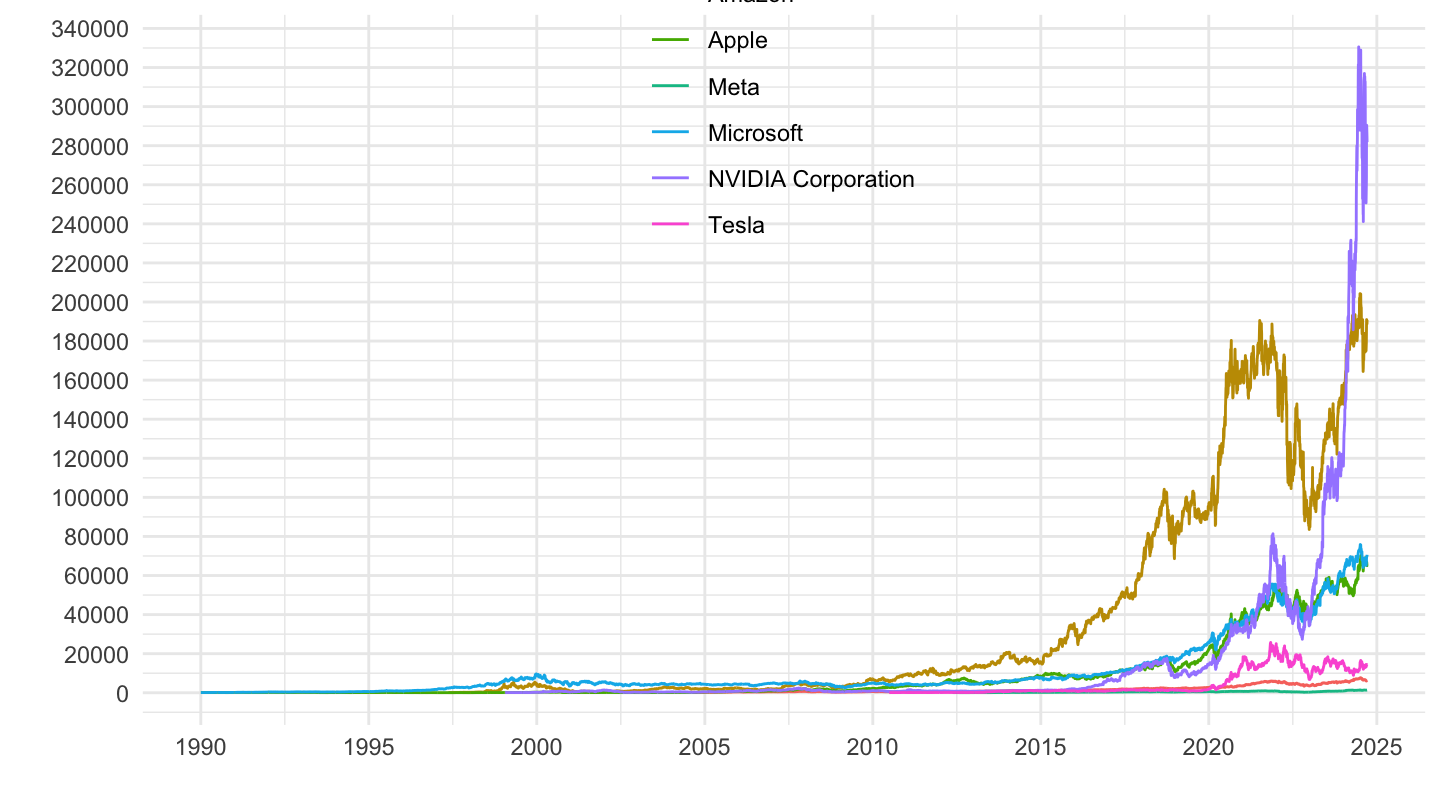
plot_log <- plot_linear +
  scale_y_log10(breaks = 10^seq(2, 100, 1))

plot_log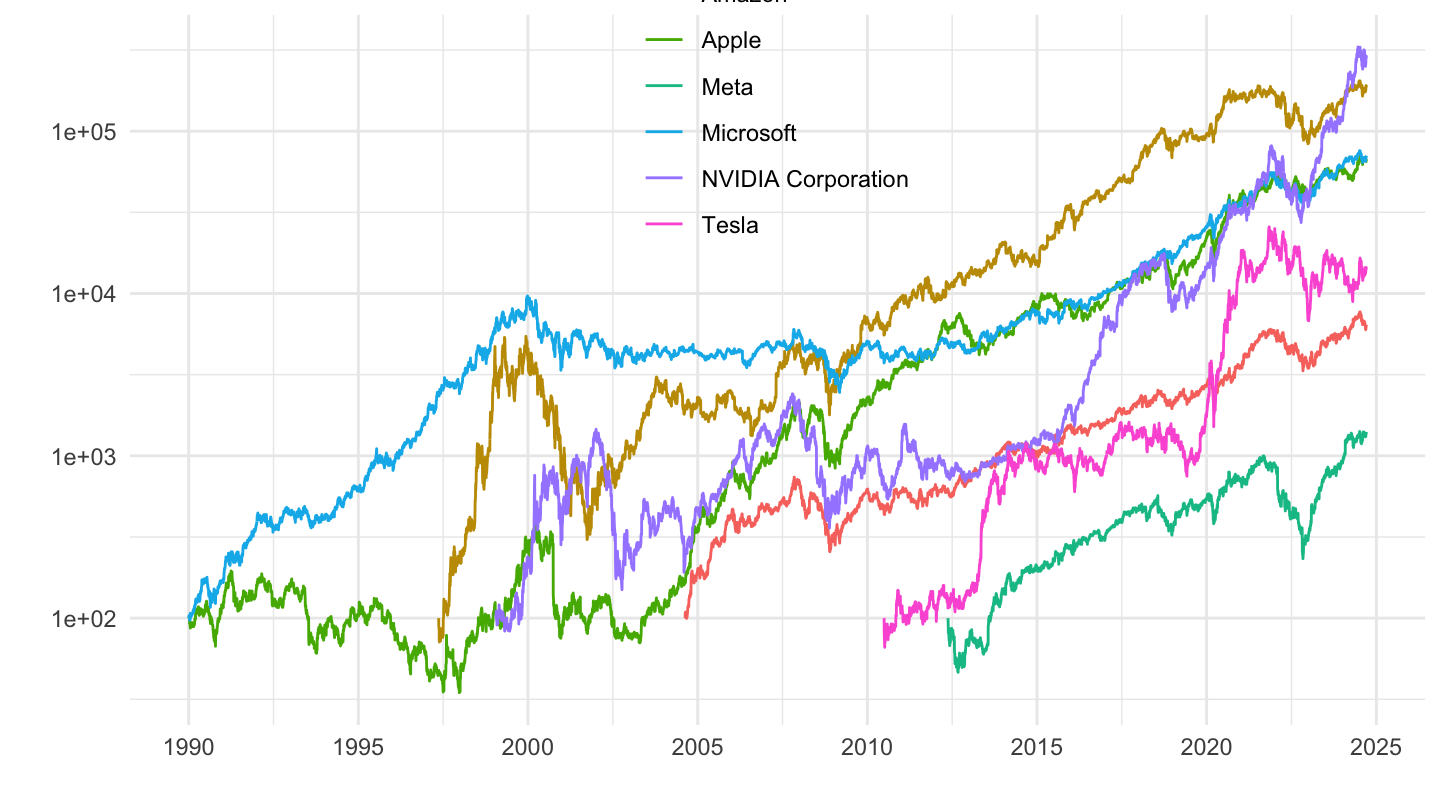
ggpubr::ggarrange(plot_linear + ggtitle("Linear scale"), plot_log + ggtitle("Log scale"), common.legend = T)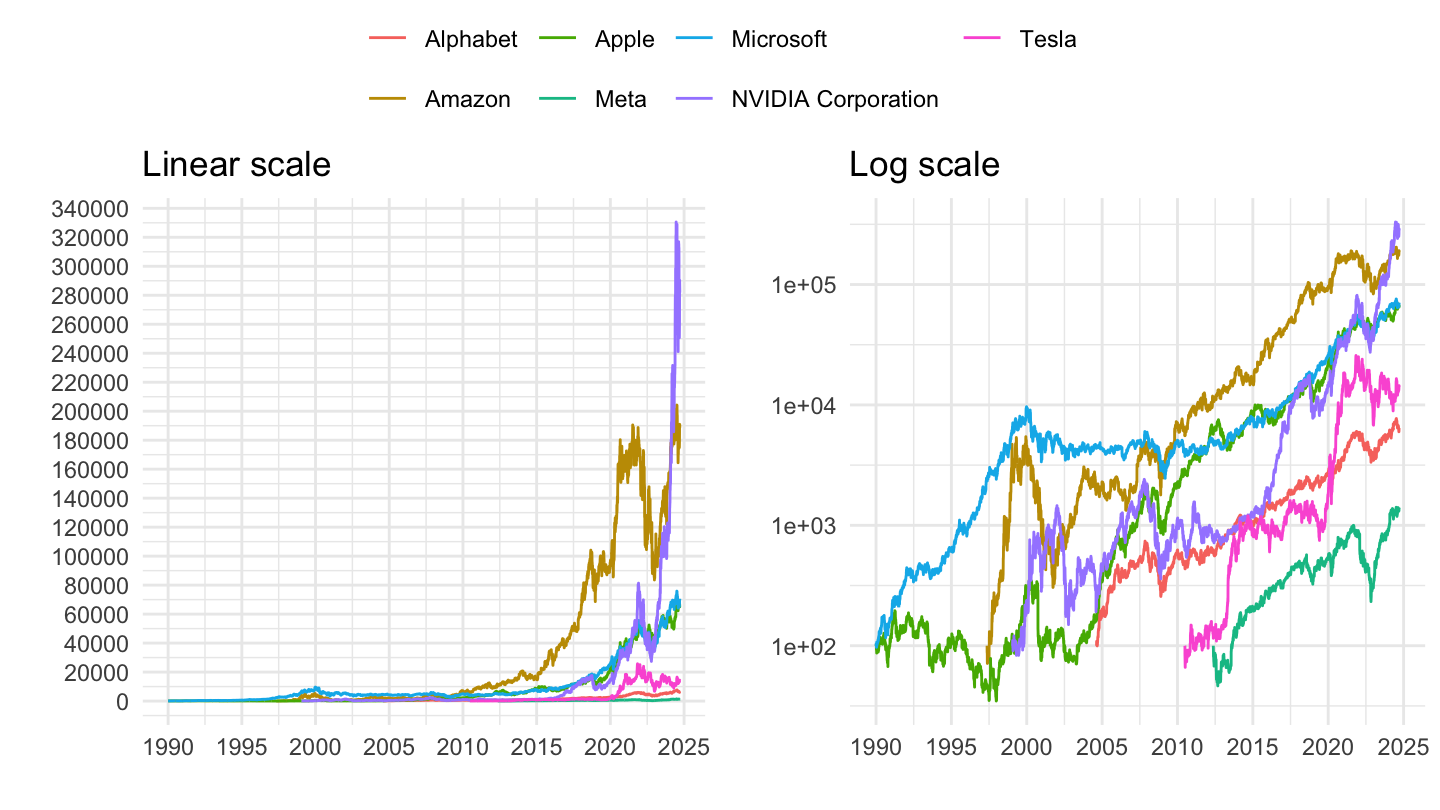
plot_linear <- stocks |>
  filter(symbol %in% c("META", "TSLA", "NVDA", "AMZN", "GOOG", "MSFT", "AAPL")) |>
  filter(date >= as.Date("2010-01-01")) |>
  left_join(symbol, by = "symbol") |>
  group_by(symbol) |>
  arrange(date) |>
  mutate(close = 100*close/close[1]) |>
  ggplot() + geom_line(aes(x = date, y = close, color = Symbol)) +
  theme_minimal() + xlab("") + ylab("") +
  theme(legend.title = element_blank(),
        legend.position = c(0.2, 0.7),
        axis.text.x = element_text(angle = 45, vjust = 0.5, hjust=1)) +
  scale_y_continuous(breaks = seq(0, 1000000, 5000),
                     labels = dollar_format(pre = "", acc = 1)) +
  scale_x_date(breaks = as.Date(paste0(seq(1940, 2100, 1), "-01-01")),
               labels = date_format("%Y"))

plot_linear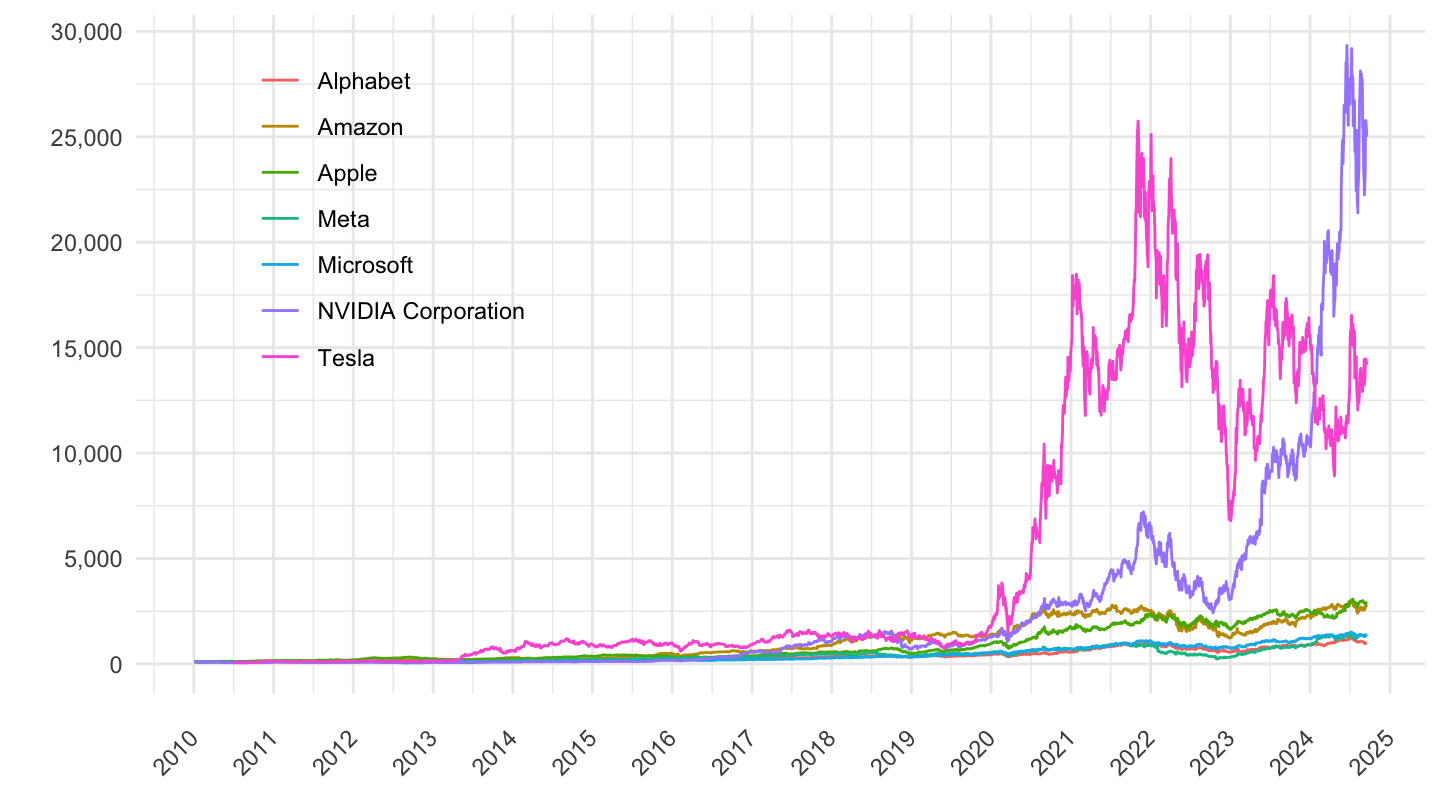
plot_log <- plot_linear +
  scale_y_log10(breaks = c(10^seq(1, 100, 1), 10^seq(1, 100, 1)*2, 10^seq(1, 100, 1)*5),
                     labels = dollar_format(pre = "", acc = 1))

plot_log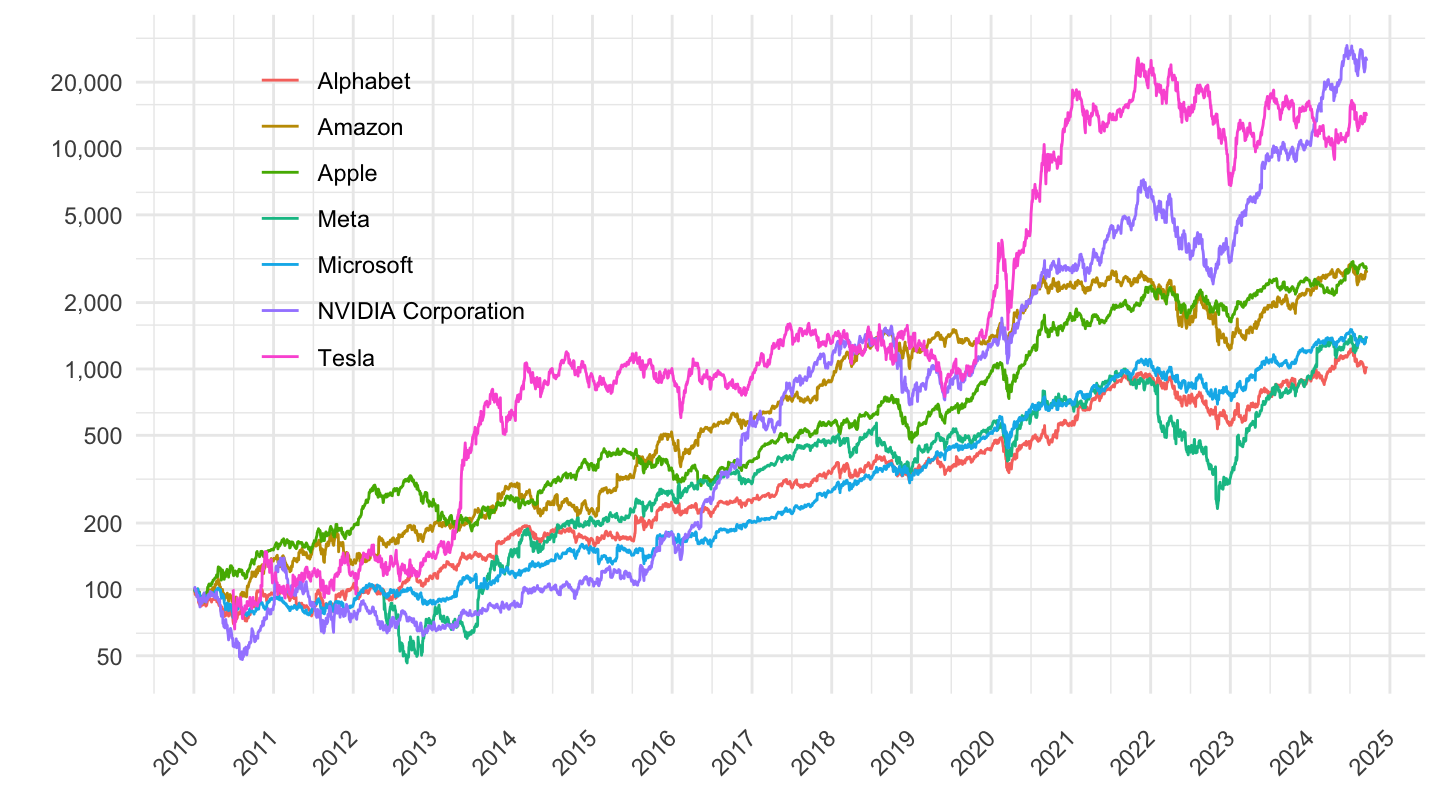
ggpubr::ggarrange(plot_linear + ggtitle("Linear scale"),
                  plot_log + ggtitle("Log scale"),
                  common.legend = T)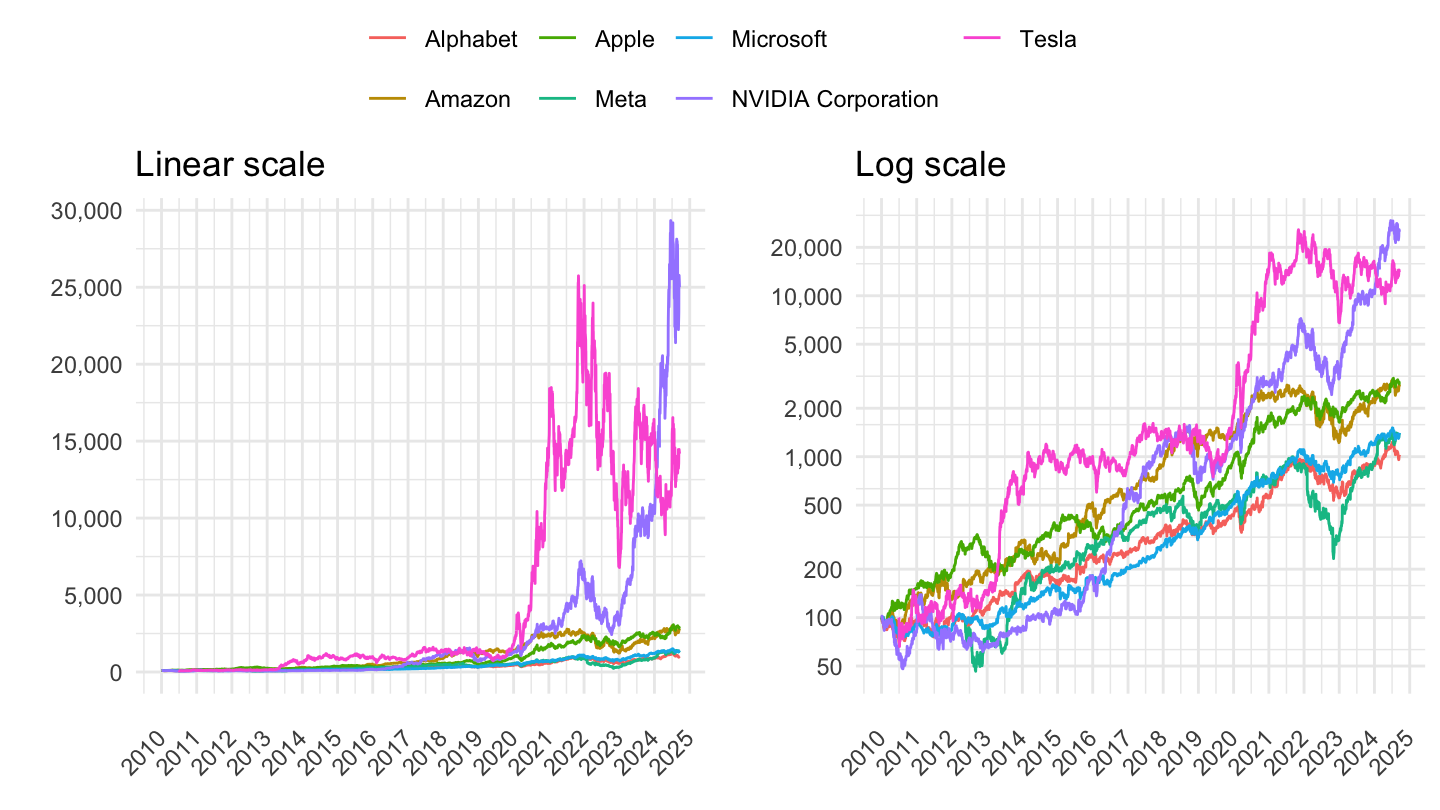
plot_linear <- stocks |>
  filter(symbol %in% c("META", "TSLA", "NVDA", "AMZN", "GOOG", "MSFT", "AAPL")) |>
  filter(date >= as.Date("2014-01-01")) |>
  left_join(symbol, by = "symbol") |>
  group_by(symbol) |>
  arrange(date) |>
  mutate(close = 100*close/close[1]) |>
  ggplot() + geom_line(aes(x = date, y = close, color = Symbol)) +
  theme_minimal() + xlab("") + ylab("") +
  theme(legend.title = element_blank(),
        legend.position = c(0.2, 0.7),
        axis.text.x = element_text(angle = 45, vjust = 0.5, hjust=1)) +
  scale_y_continuous(breaks = seq(0, 1000000, 5000),
                     labels = dollar_format(pre = "", acc = 1)) +
  scale_x_date(breaks = as.Date(paste0(seq(1940, 2100, 1), "-01-01")),
               labels = date_format("%Y"))

plot_linear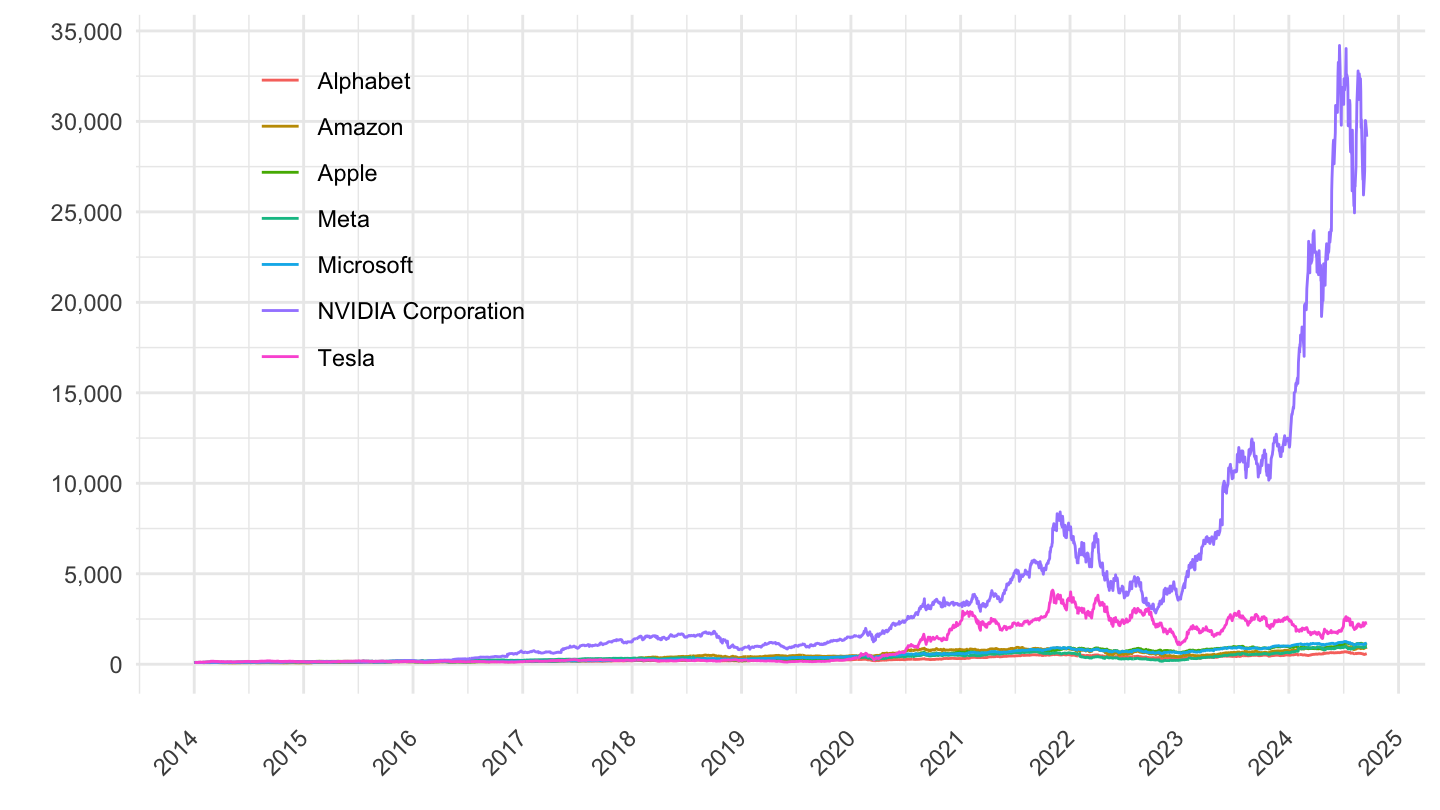
plot_log <- plot_linear +
  scale_y_log10(breaks = c(10^seq(1, 100, 1), 10^seq(1, 100, 1)*2, 10^seq(1, 100, 1)*5),
                     labels = dollar_format(pre = "", acc = 1))

plot_log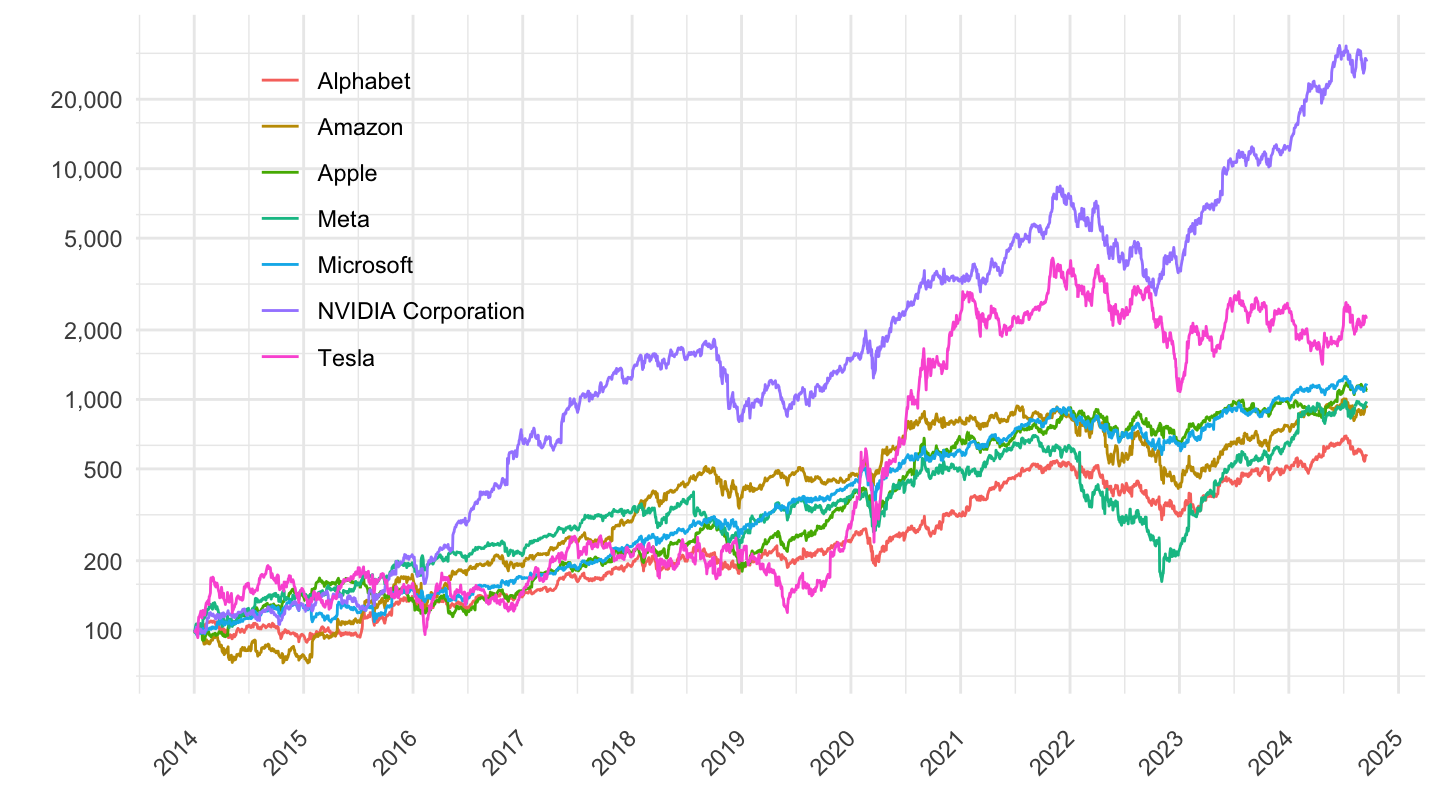
ggpubr::ggarrange(plot_linear + ggtitle("Linear scale"),
                  plot_log + ggtitle("Log scale"),
                  common.legend = T)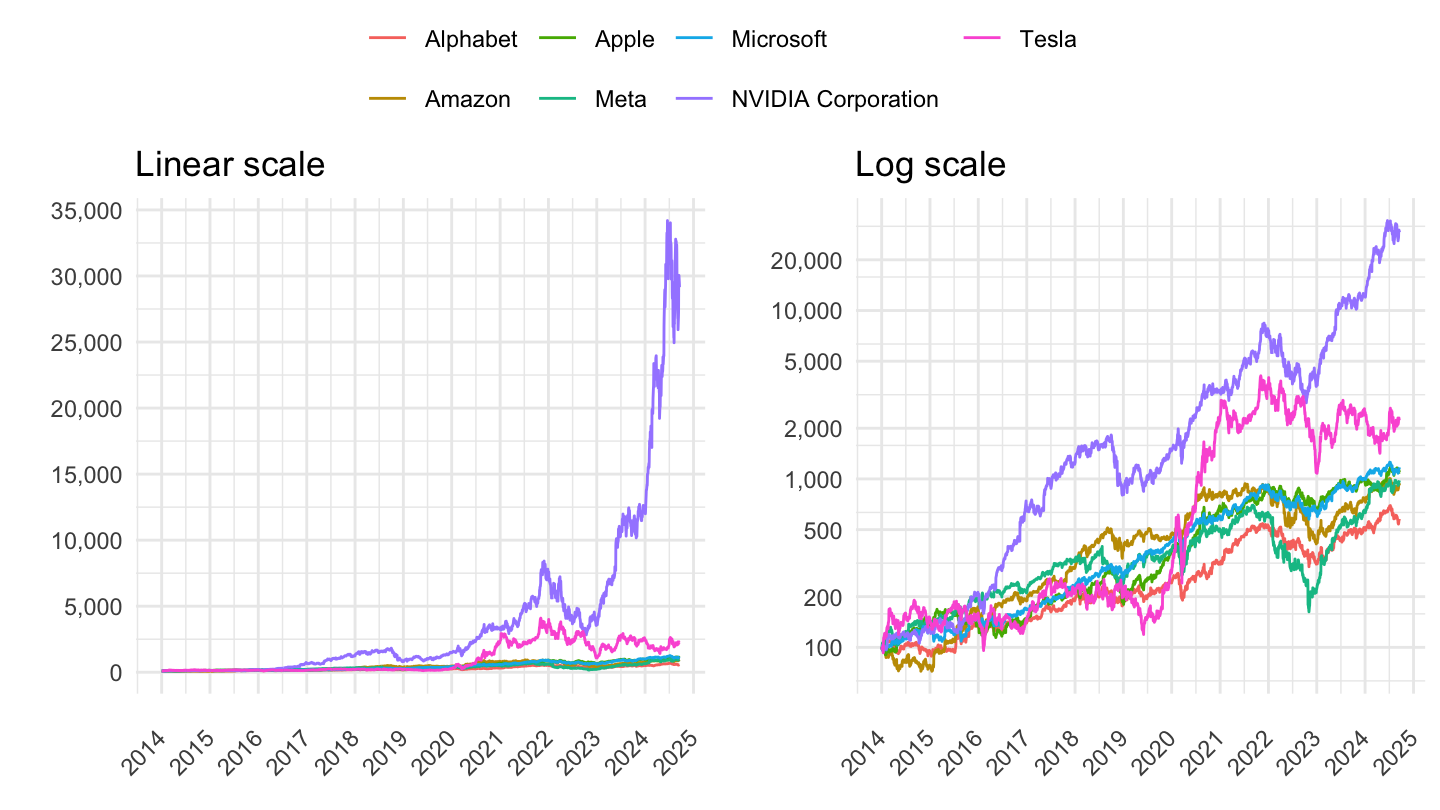
| source | dataset | Title | Updated |
|---|---|---|---|

