Indices
Data - Yahoo
Info
LAST_COMPILE
| LAST_COMPILE |
|---|
| 2026-07-26 |
Last
| date | Nobs |
|---|---|
| 2026-07-25 | 1 |
symbol
Flat
CAC40, TR
All
Linear
Code
plot_linear <- indices %>%
  filter(symbol %in% c("^FCHI")) %>%
  #filter(date >= as.Date("1990-01-01")) %>%
  left_join(symbol, by = "symbol") %>%
  bind_rows(cac40_GR_new) %>%
  group_by(symbol) %>%
  arrange(date) %>%
  mutate(close = 100*close/close[1]) %>%
  ggplot() + geom_line(aes(x = date, y = close, color = Symbol)) +
  theme_minimal() + xlab("") + ylab("") +
  theme(legend.title = element_blank(),
        legend.position = c(0.5, 0.9)) +
  scale_y_continuous(breaks = seq(0, 10000, 100)) +
  scale_x_date(breaks = as.Date(paste0(seq(1945, 2100, 5), "-01-01")),
               labels = date_format("%Y"))

plot_linear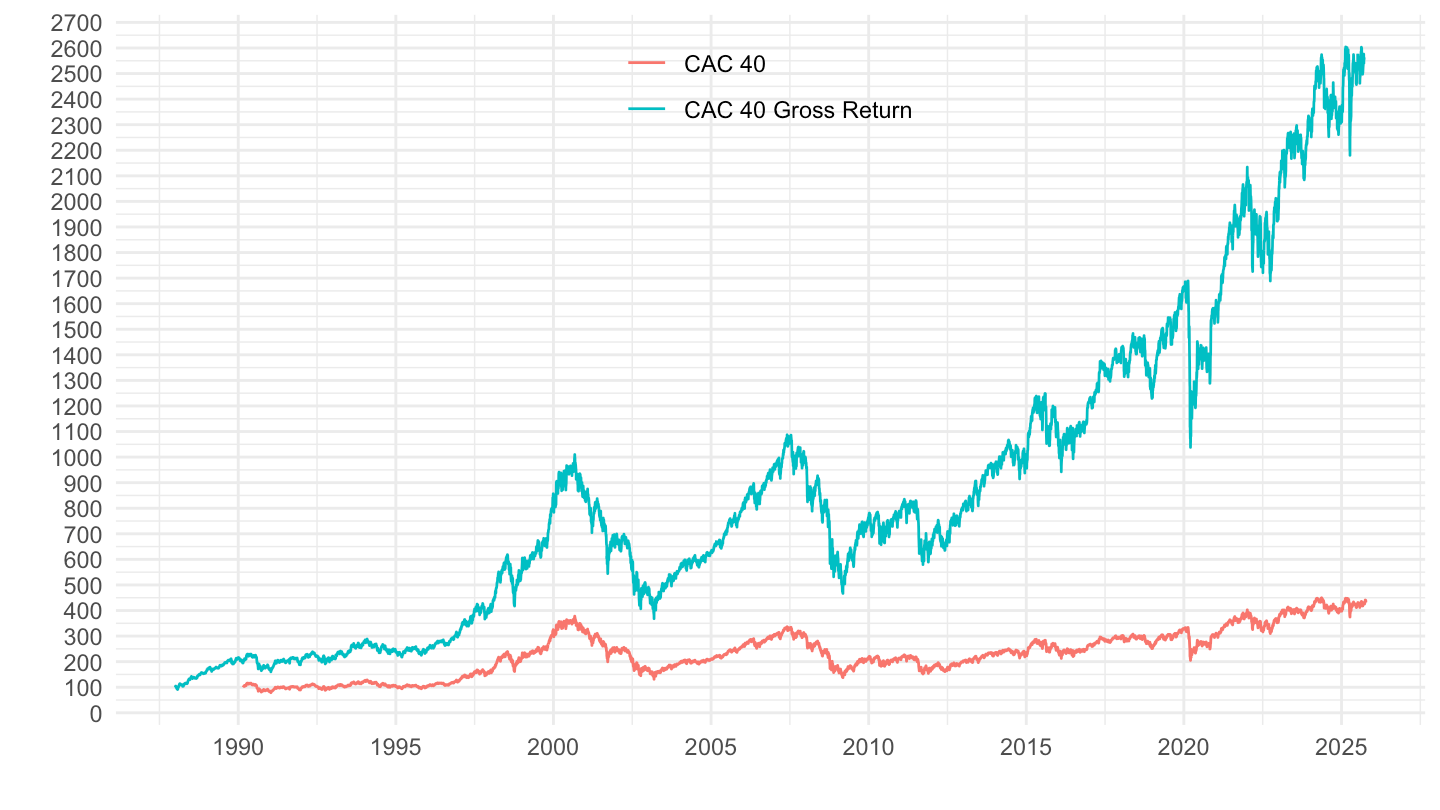
Log
Code
plot_log <- plot_linear +
  scale_y_log10(breaks = seq(0, 10000, 100))

plot_log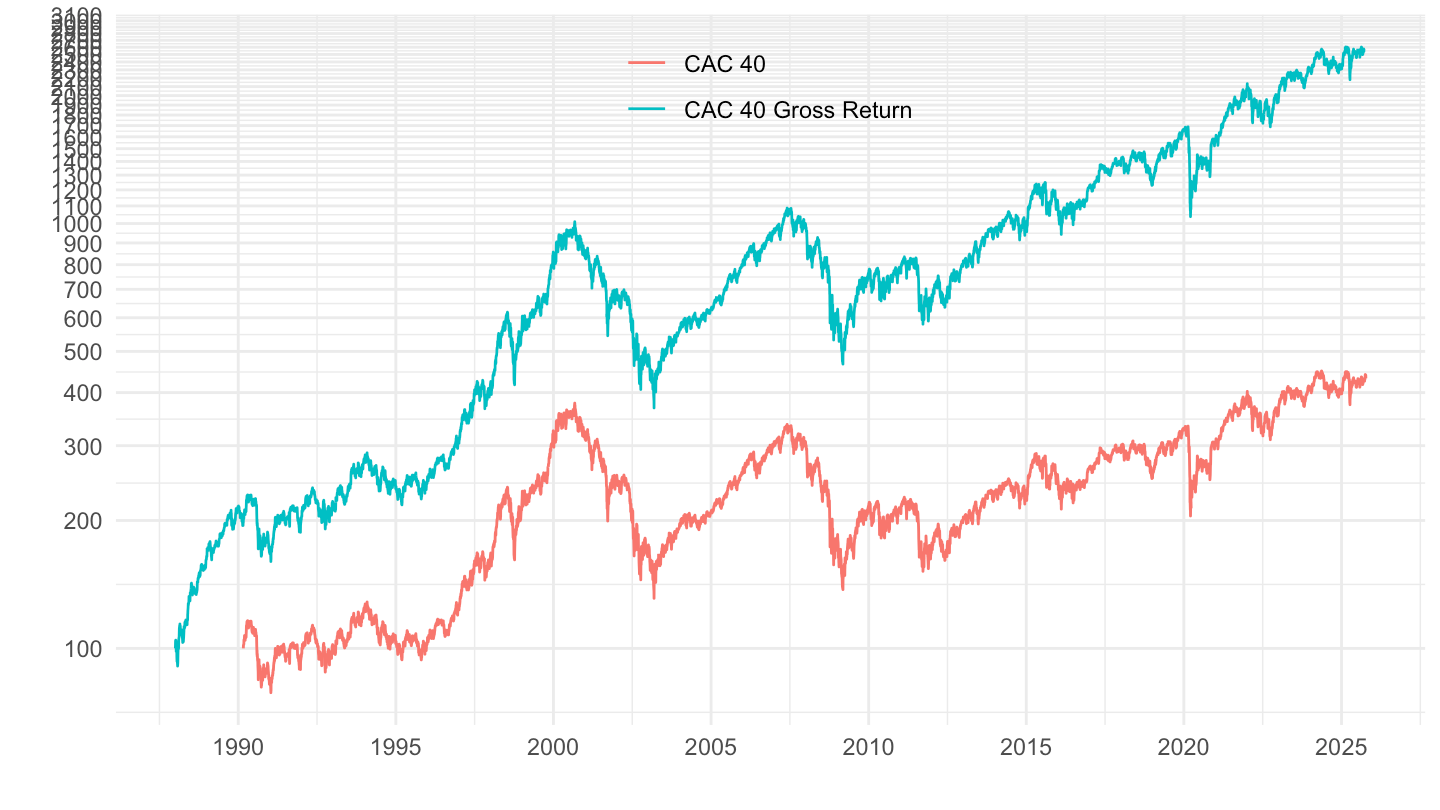
Bind
Code
ggpubr::ggarrange(plot_linear + ggtitle("Linear scale"), plot_log + ggtitle("Log scale"), common.legend = T)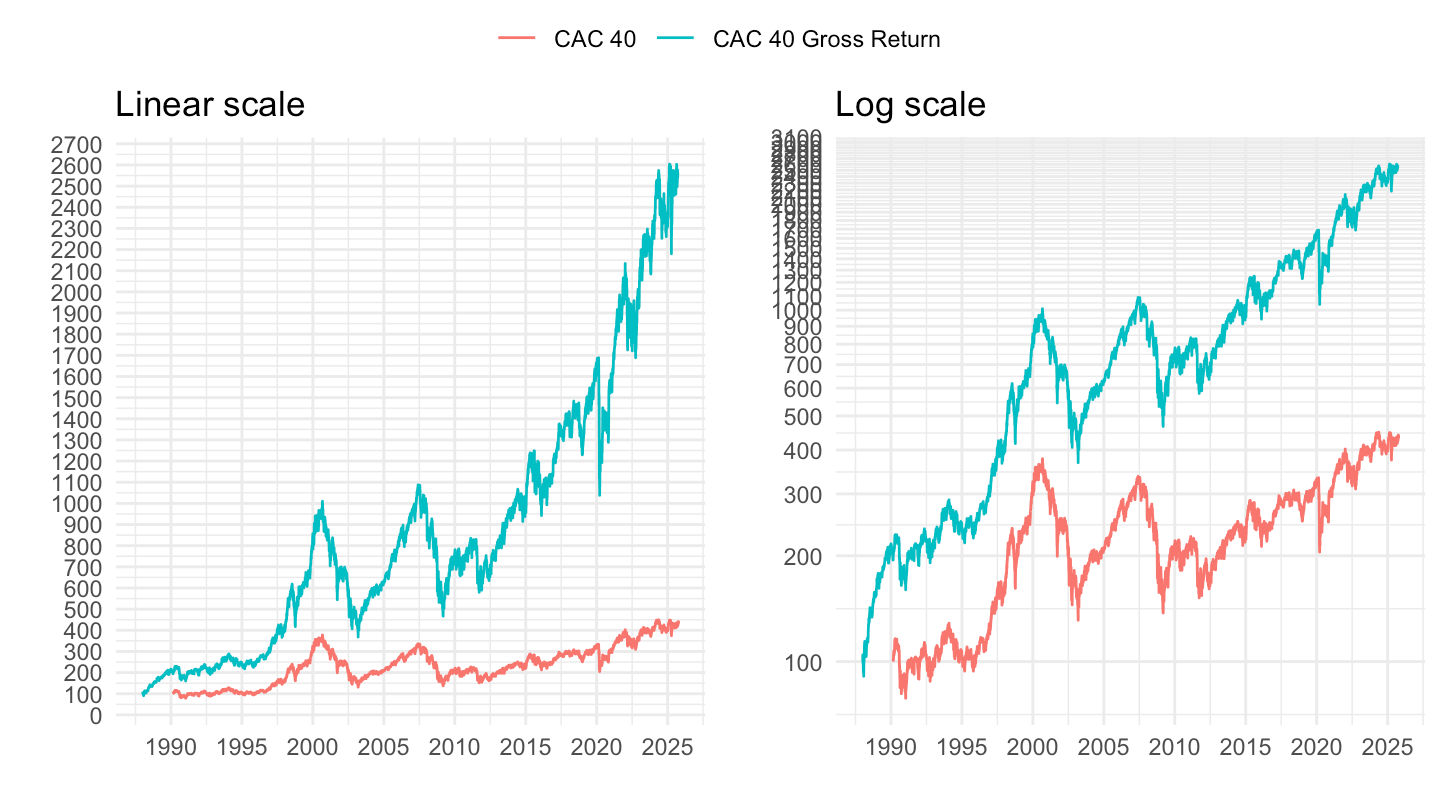
1990-
Linear
Code
plot_linear <- indices %>%
  filter(symbol %in% c("^FCHI")) %>%
  left_join(symbol, by = "symbol") %>%
  bind_rows(cac40_GR_new) %>%
  filter(date >= as.Date("1990-01-01")) %>%
  group_by(symbol) %>%
  arrange(date) %>%
  mutate(close = 100*close/close[1]) %>%
  ggplot() + geom_line(aes(x = date, y = close, color = Symbol)) +
  theme_minimal() + xlab("") + ylab("") +
  theme(legend.title = element_blank(),
        legend.position = c(0.5, 0.9)) +
  scale_y_continuous(breaks = seq(0, 10000, 100)) +
  scale_x_date(breaks = as.Date(paste0(seq(1945, 2100, 5), "-01-01")),
               labels = date_format("%Y"))

plot_linear
Log
Code
plot_log <- plot_linear +
  scale_y_log10(breaks = seq(0, 10000, 100))

plot_log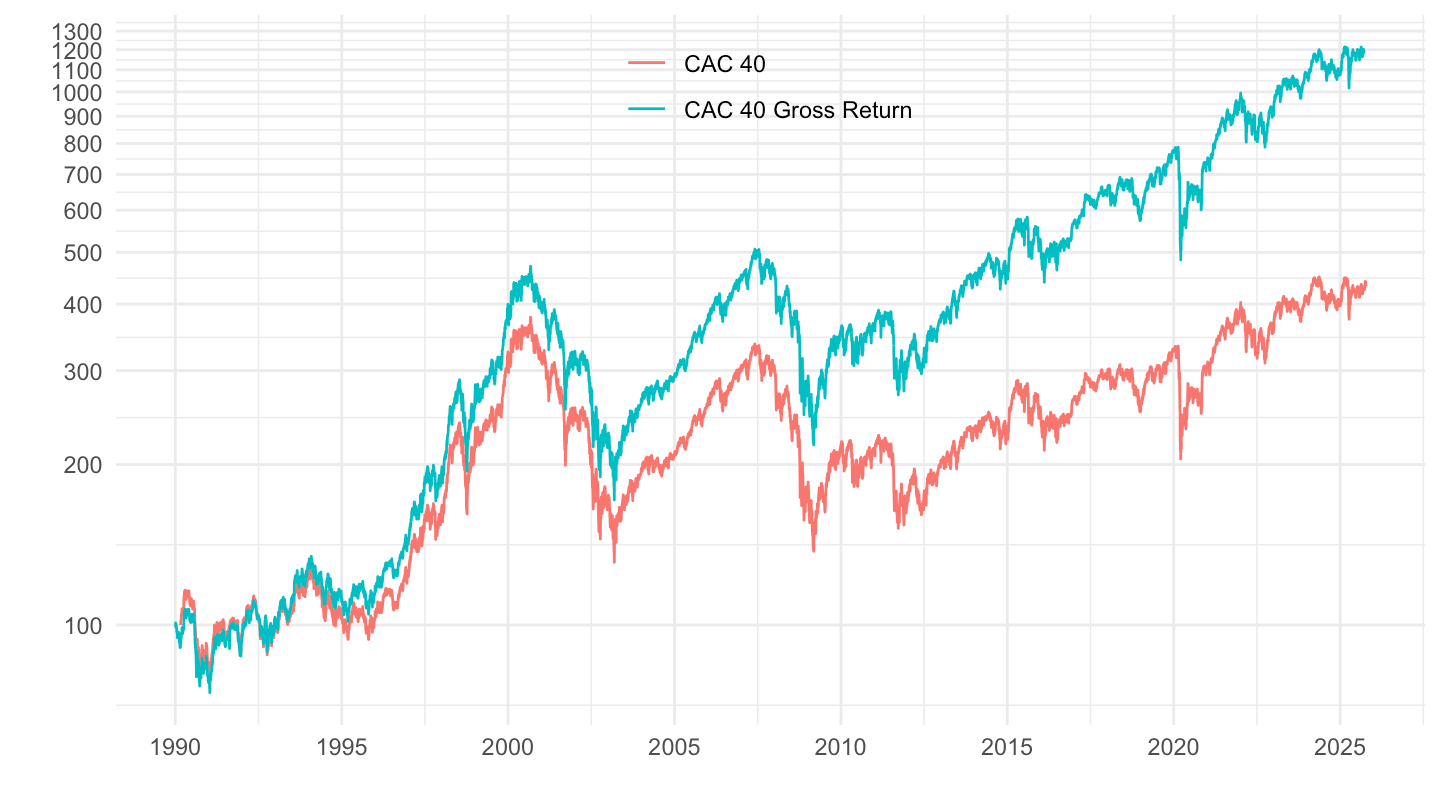
Bind
Code
ggpubr::ggarrange(plot_linear + ggtitle("Linear scale"), plot_log + ggtitle("Log scale"), common.legend = T)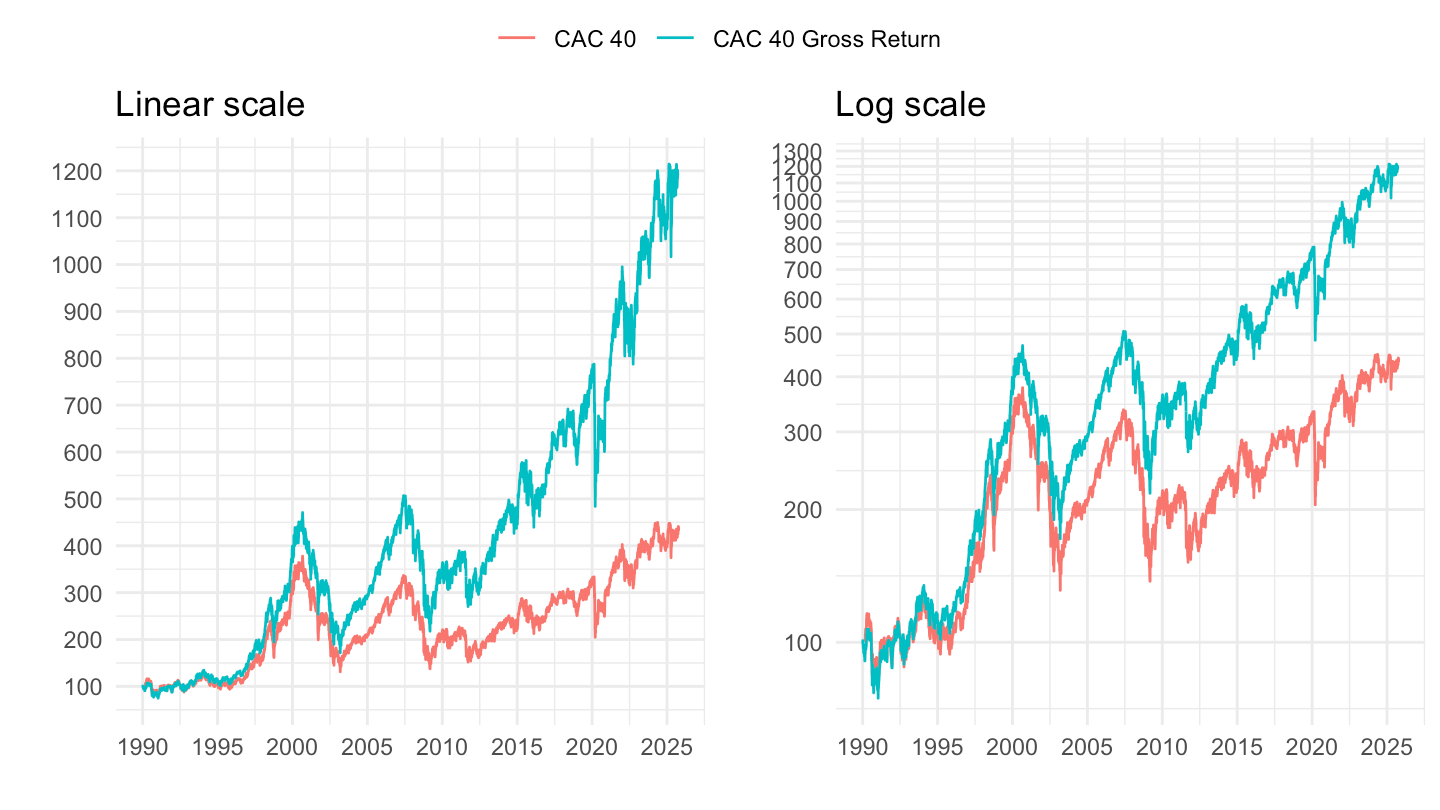
SP500TR, CAC40TR
1990-
Linear
Code
plot_linear <- indices %>%
  filter(symbol %in% c("^SP500TR")) %>%
  left_join(symbol, by = "symbol") %>%
  bind_rows(cac40_GR_new) %>%
  filter(date >= as.Date("1990-01-01")) %>%
  group_by(symbol) %>%
  arrange(date) %>%
  mutate(close = 100*close/close[1]) %>%
  ggplot() + geom_line(aes(x = date, y = close, color = Symbol)) +
  theme_minimal() + xlab("") + ylab("") +
  theme(legend.title = element_blank(),
        legend.position = c(0.5, 0.9)) +
  scale_y_continuous(breaks = seq(0, 10000, 100)) +
  scale_x_date(breaks = as.Date(paste0(seq(1945, 2100, 5), "-01-01")),
               labels = date_format("%Y"))

plot_linear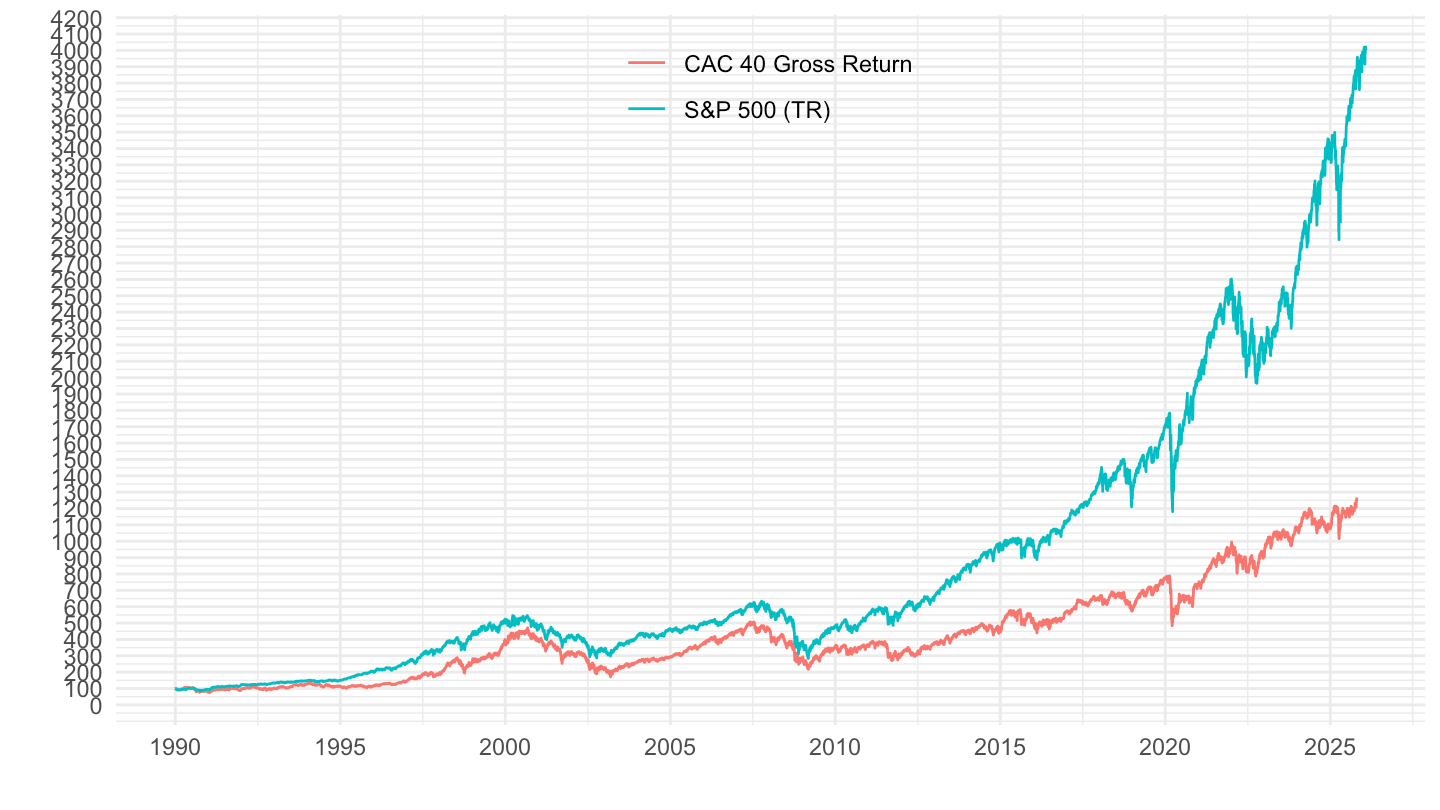
Log
No label
Code
plot_log <- plot_linear +
  scale_y_log10(breaks = c(100, 200, 400, 800, 1000, 1900, 1600))

plot_log
Bind
Code
ggpubr::ggarrange(plot_linear + ggtitle("Linear scale"), plot_log + ggtitle("Log scale"), common.legend = T)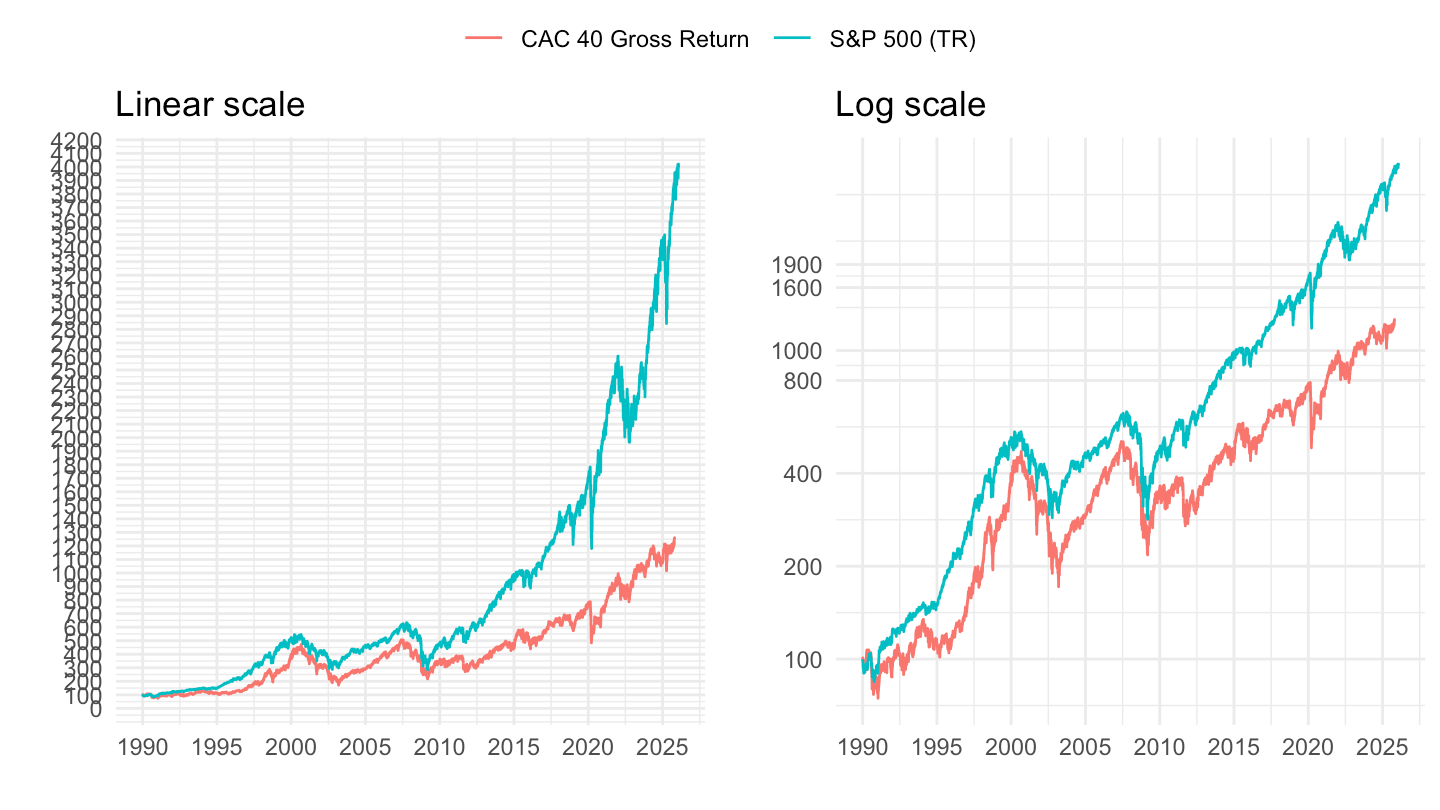
1996-
Linear
Code
plot_linear <- indices %>%
  filter(symbol %in% c("^SP500TR")) %>%
  left_join(symbol, by = "symbol") %>%
  bind_rows(cac40_GR_new) %>%
  filter(date >= as.Date("1996-01-01")) %>%
  group_by(symbol) %>%
  arrange(date) %>%
  mutate(close = 100*close/close[1]) %>%
  ggplot() + geom_line(aes(x = date, y = close, color = Symbol)) +
  theme_minimal() + xlab("") + ylab("") +
  theme(legend.title = element_blank(),
        legend.position = c(0.5, 0.9)) +
  scale_y_continuous(breaks = seq(0, 10000, 100)) +
  scale_x_date(breaks = as.Date(paste0(seq(1945, 2100, 5), "-01-01")),
               labels = date_format("%Y"))

plot_linear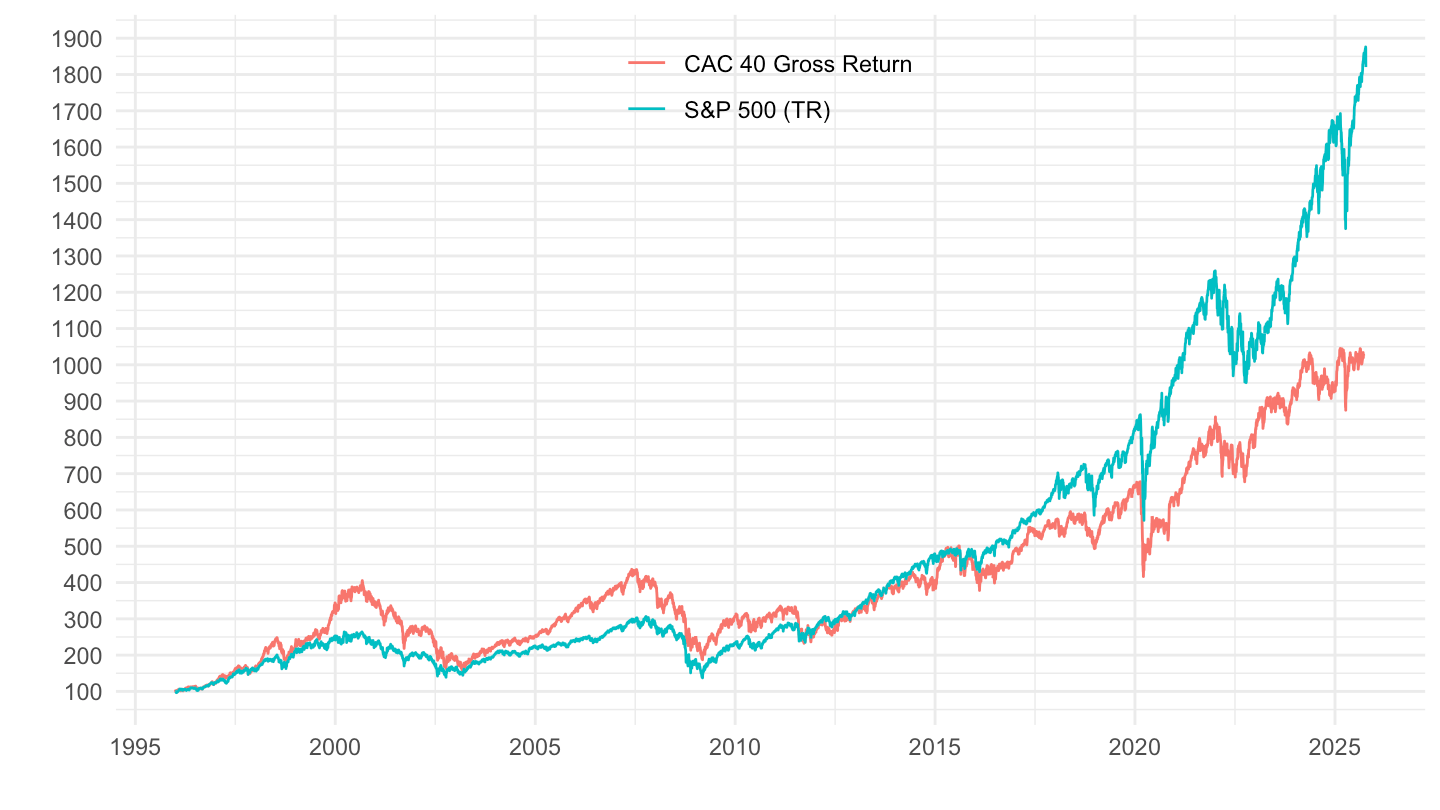
Log
No label
Code
plot_log <- plot_linear +
  scale_y_log10(breaks = c(100, 200, 400, 800, 1000, 1900, 1600))

plot_log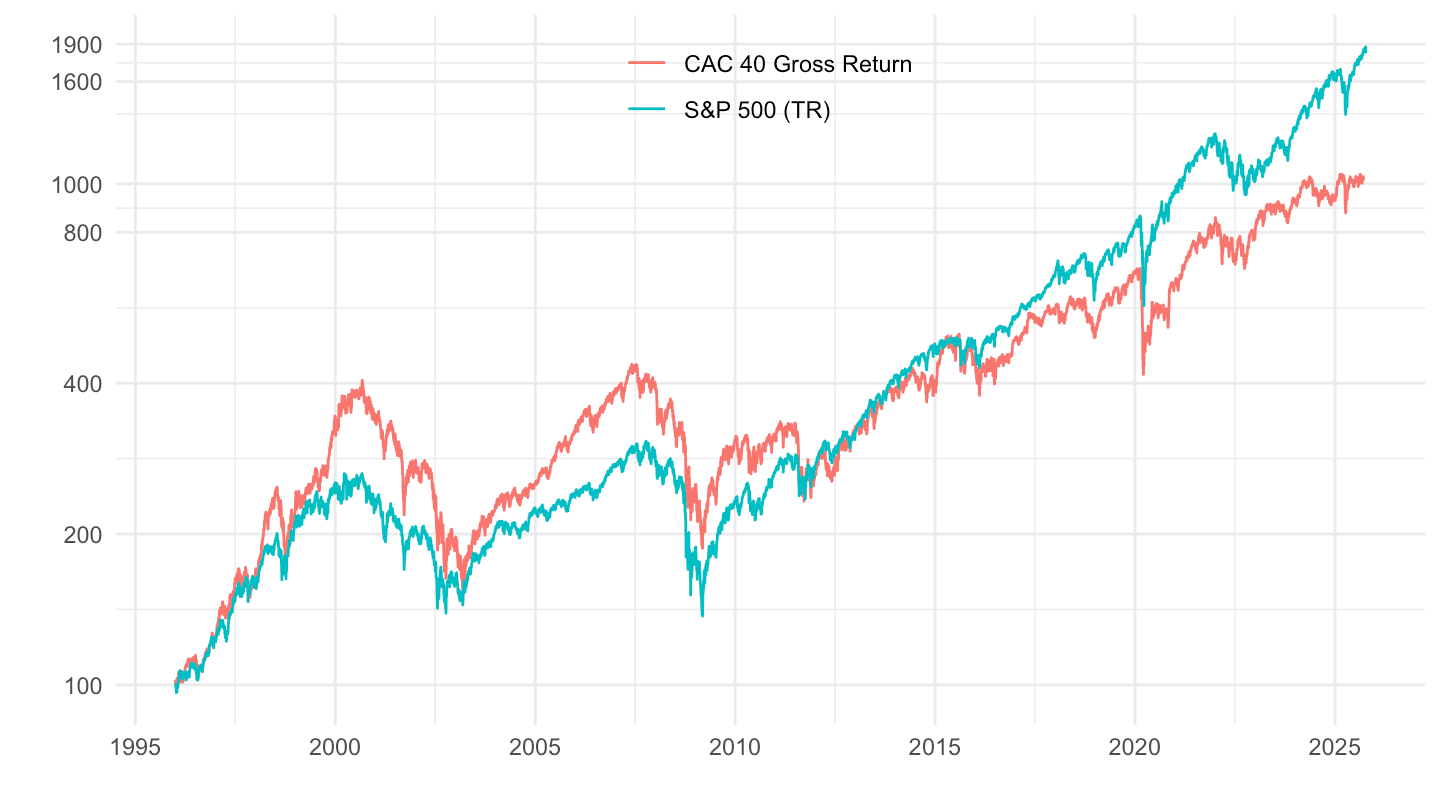
Francais
Code
indices %>%
  filter(symbol %in% c("^SP500TR")) %>%
  left_join(symbol, by = "symbol") %>%
  bind_rows(cac40_GR_new) %>%
  filter(date >= as.Date("1996-01-01")) %>%
  group_by(symbol) %>%
  arrange(date) %>%
  mutate(close = 100*close/close[1]) %>%
  ggplot() + geom_line(aes(x = date, y = close, color = Symbol)) +
  theme_minimal() + xlab("") + ylab("Base 100 = 1er janvier 1996") +
  theme(legend.title = element_blank(),
        legend.position = c(0.2, 0.9)) +
  scale_x_date(breaks = as.Date(paste0(seq(1996, 2100, 5), "-01-01")),
               labels = date_format("%Y")) +
  scale_y_log10(breaks = c(100, 200, 400, 800, 1000, 1900, 1600)) +
  geom_label(data = . %>% filter(max(date) == date),
             aes(x = date, y = close, label = round(close), color = Symbol)) +
  labs(title = "Rendements sur les marchés actions\nFrance (CAC 40) et Etats-Unis (S&P 500)",
       subtitle = "",
       caption = "Source: yahoo! Finance, investing.com") +
  scale_color_manual(values = viridis(3)[1:2])
Bind
Code
ggpubr::ggarrange(plot_linear + ggtitle("Linear scale"), plot_log + ggtitle("Log scale"), common.legend = T)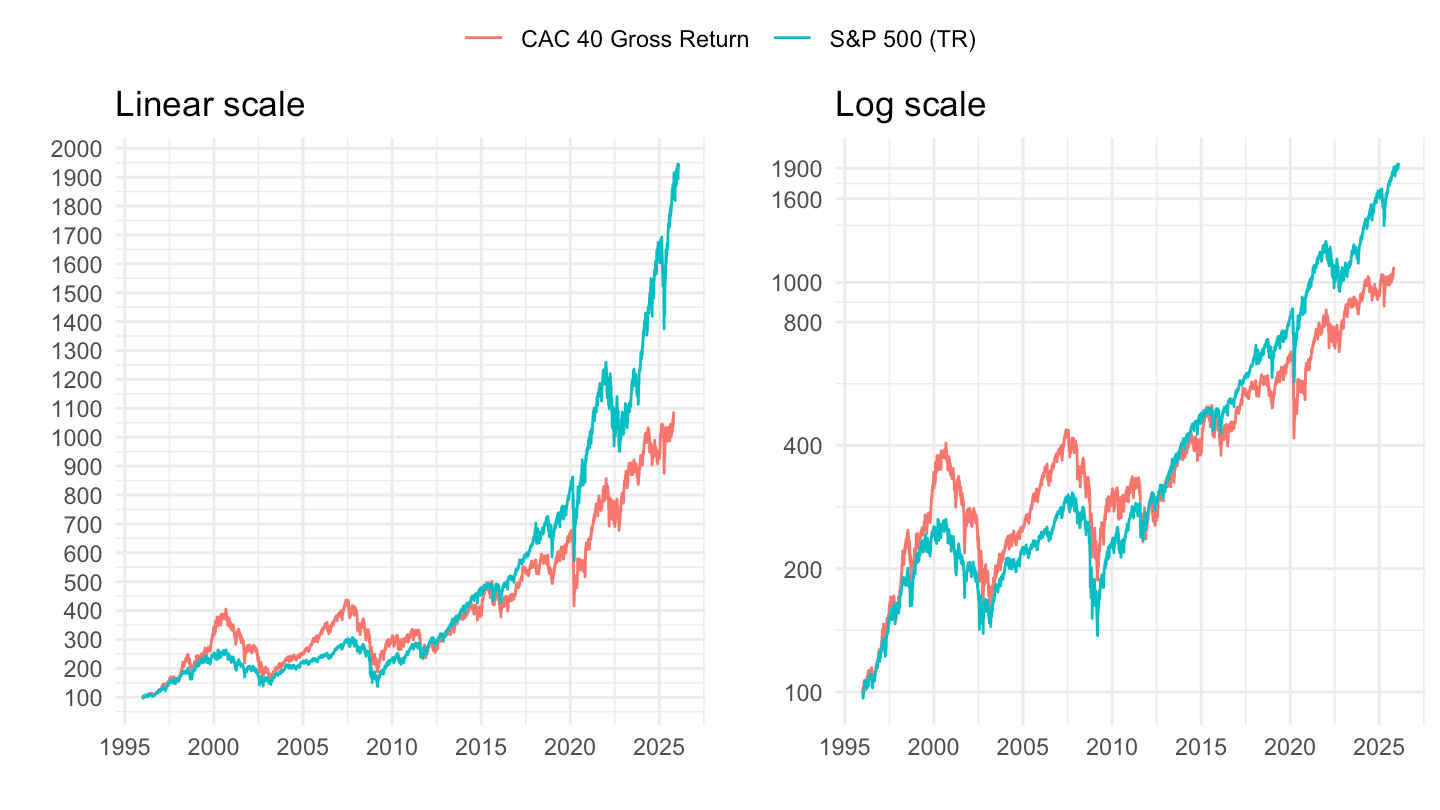
2008-
Francais
Code
indices %>%
  filter(symbol %in% c("^SP500TR")) %>%
  left_join(symbol, by = "symbol") %>%
  bind_rows(cac40_GR_new) %>%
  filter(date >= as.Date("2008-01-01")) %>%
  group_by(symbol) %>%
  arrange(date) %>%
  mutate(close = 100*close/close[1]) %>%
  ggplot() + geom_line(aes(x = date, y = close, color = Symbol)) +
  theme_minimal() + xlab("") + ylab("Base 100 = 1er janvier 2008") +
  theme(legend.title = element_blank(),
        legend.position = c(0.5, 0.9)) +
  scale_x_date(breaks = as.Date(paste0(seq(1996, 2100, 2), "-01-01")),
               labels = date_format("%Y")) +
  scale_y_log10(breaks = c(100, 200, 400, 800, 1000, 1900, 1600)) +
  geom_label(data = . %>% filter(max(date) == date),
             aes(x = date, y = close, label = round(close), color = Symbol)) +
  labs(title = "Rendements sur les marchés actions Français et états-uniens",
       subtitle = "Indices TR = Dividendes réinvestis (sans fiscalité)",
       caption = "Source: yahoo! Finance, investing.com") +
  scale_color_manual(values = viridis(3)[1:2])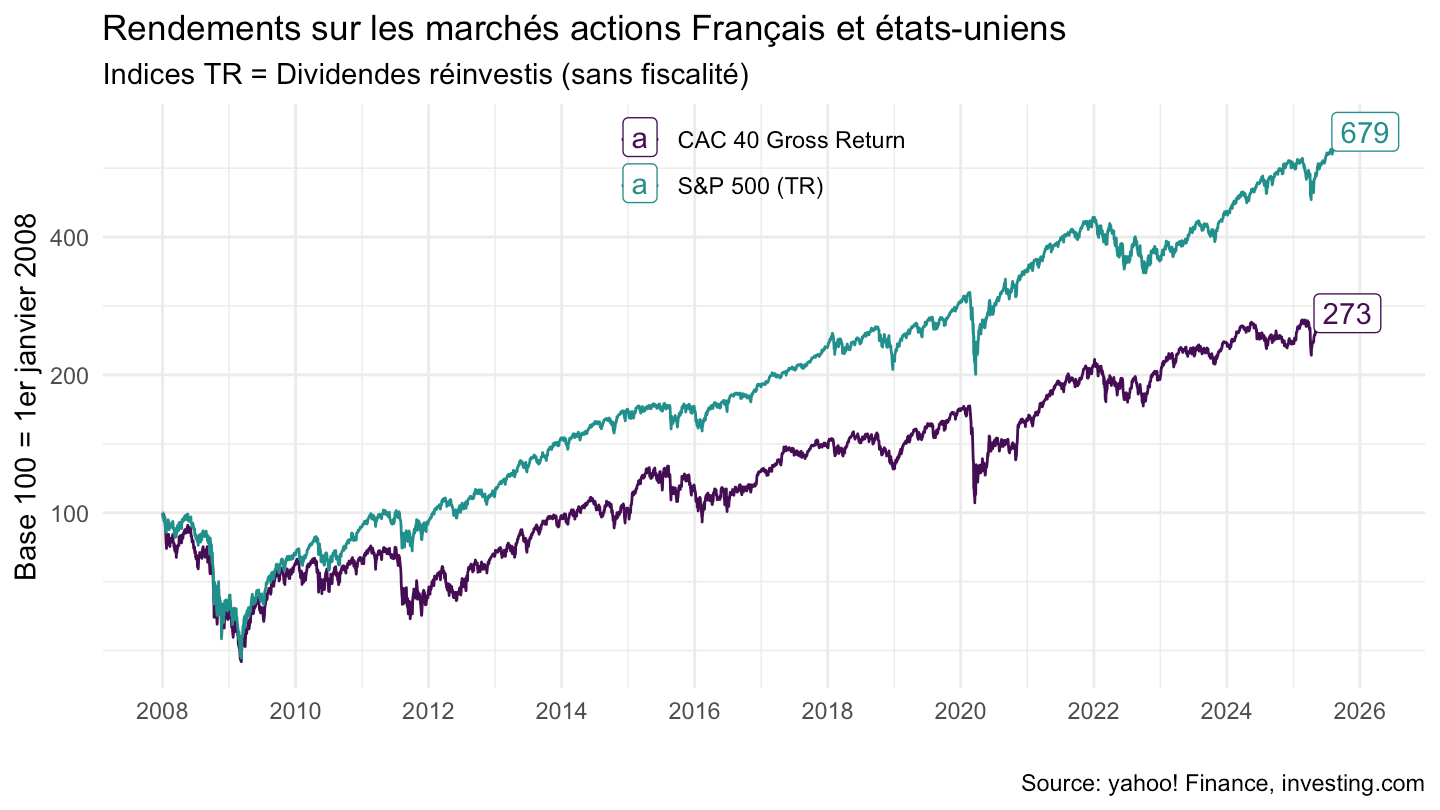
2010-
Francais
Code
indices %>%
  filter(symbol %in% c("^SP500TR")) %>%
  left_join(symbol, by = "symbol") %>%
  bind_rows(cac40_GR_new) %>%
  filter(date >= as.Date("2010-01-01")) %>%
  group_by(symbol) %>%
  arrange(date) %>%
  mutate(close = 100*close/close[1]) %>%
  ggplot() + geom_line(aes(x = date, y = close, color = Symbol)) +
  theme_minimal() + xlab("") + ylab("Base 100 = 1er janvier 2010") +
  theme(legend.title = element_blank(),
        legend.position = c(0.5, 0.9)) +
  scale_x_date(breaks = as.Date(paste0(seq(1996, 2100, 2), "-01-01")),
               labels = date_format("%Y")) +
  scale_y_log10(breaks = c(100, 200, 400, 800, 1000, 1900, 1600)) +
  geom_label(data = . %>% filter(max(date) == date),
             aes(x = date, y = close, label = round(close), color = Symbol)) +
  labs(title = "Rendements sur les marchés actions Français et états-uniens",
       subtitle = "Indices TR = Dividendes réinvestis (sans fiscalité)",
       caption = "Source: yahoo! Finance, investing.com") +
  scale_color_manual(values = viridis(3)[1:2])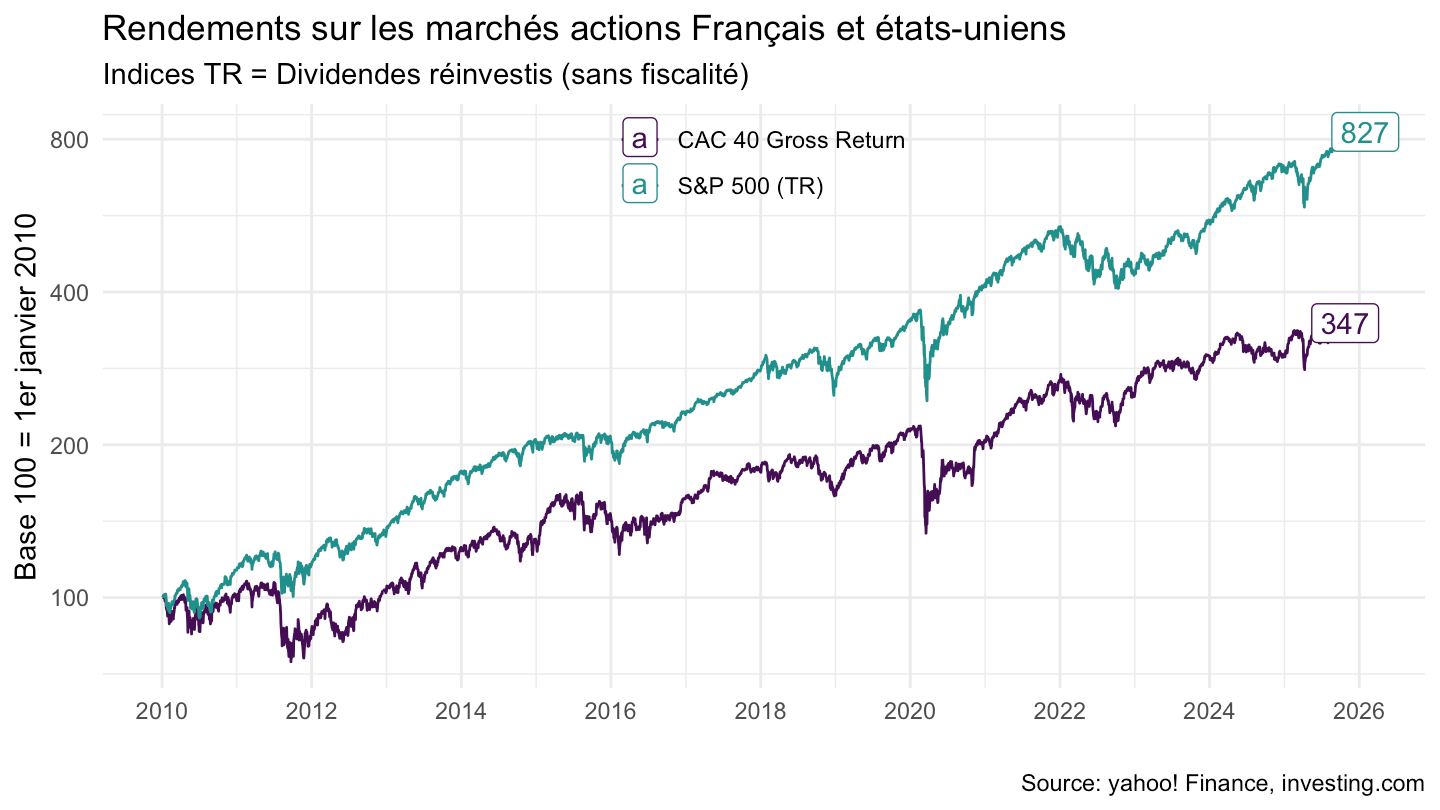
CAC40, CAC40TR
Tous
Linear
Code
plot_linear <- indices %>%
  filter(symbol %in% c("^FCHI")) %>%
  left_join(symbol, by = "symbol") %>%
  bind_rows(cac40_GR_new) %>%
  #filter(date >= as.Date("1996-01-01")) %>%
  group_by(symbol) %>%
  arrange(date) %>%
  mutate(close = 100*close/close[1]) %>%
  ggplot() + geom_line(aes(x = date, y = close, color = Symbol)) +
  theme_minimal() + xlab("") + ylab("") +
  theme(legend.title = element_blank(),
        legend.position = c(0.5, 0.9)) +
  scale_y_continuous(breaks = seq(0, 10000, 100)) +
  scale_x_date(breaks = as.Date(paste0(seq(1945, 2100, 5), "-01-01")),
               labels = date_format("%Y"))

plot_linear
Log
Code
plot_log <- plot_linear +
  scale_y_log10(breaks = seq(0, 10000, 100))

plot_log
Bind
Code
ggpubr::ggarrange(plot_linear + ggtitle("Linear scale"), plot_log + ggtitle("Log scale"), common.legend = T)
1990-
Linear
Code
plot_linear <- indices %>%
  filter(symbol %in% c("^FCHI")) %>%
  left_join(symbol, by = "symbol") %>%
  bind_rows(cac40_GR_new) %>%
  filter(date >= as.Date("1990-01-01")) %>%
  group_by(symbol) %>%
  arrange(date) %>%
  mutate(close = 100*close/close[1]) %>%
  ggplot() + geom_line(aes(x = date, y = close, color = Symbol)) +
  theme_minimal() + xlab("") + ylab("") +
  theme(legend.title = element_blank(),
        legend.position = c(0.5, 0.9)) +
  scale_y_continuous(breaks = seq(0, 10000, 100)) +
  scale_x_date(breaks = as.Date(paste0(seq(1940, 2100, 10), "-01-01")),
               labels = date_format("%Y"))

plot_linear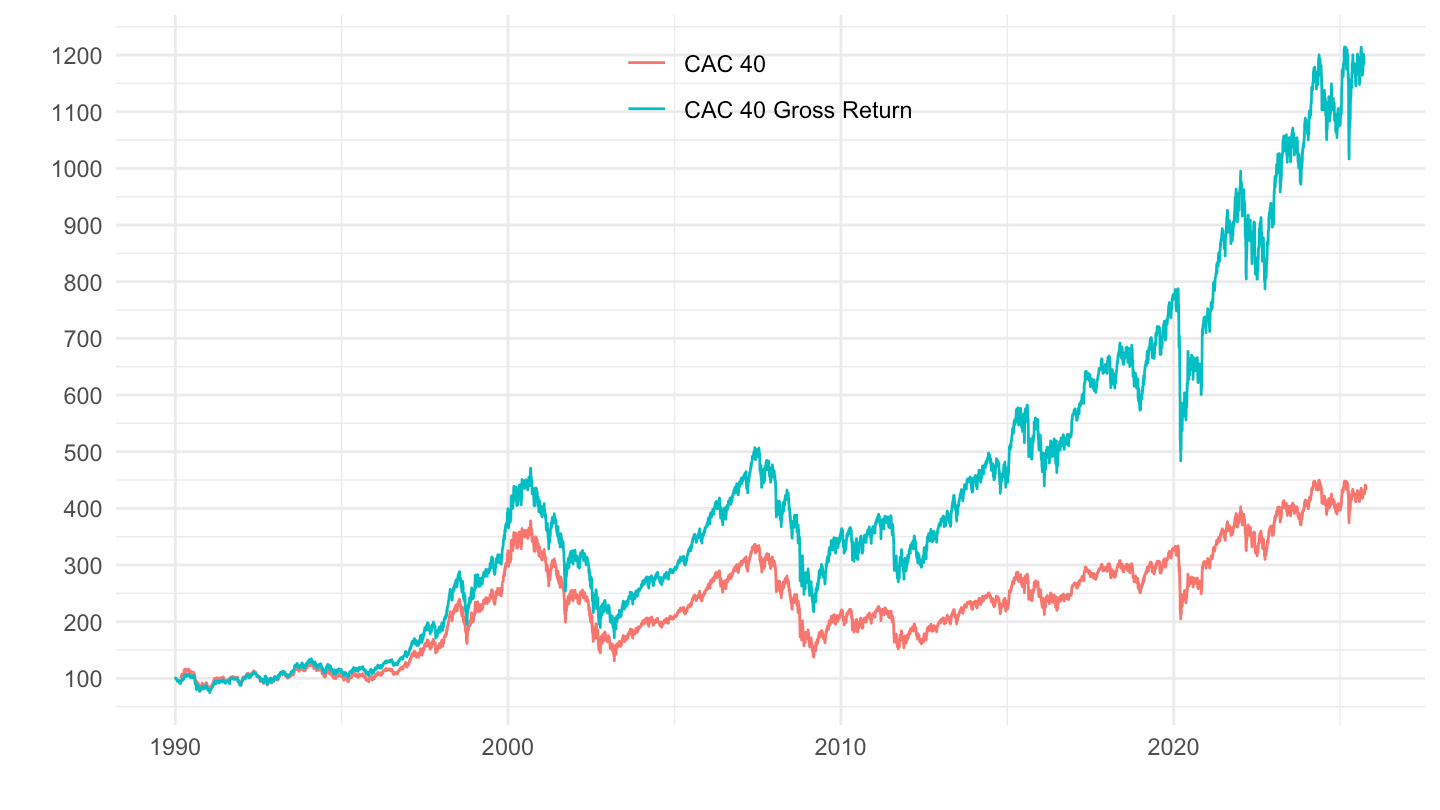
Log
Code
plot_log <- plot_linear +
  scale_y_log10(breaks = seq(0, 10000, 100))

plot_log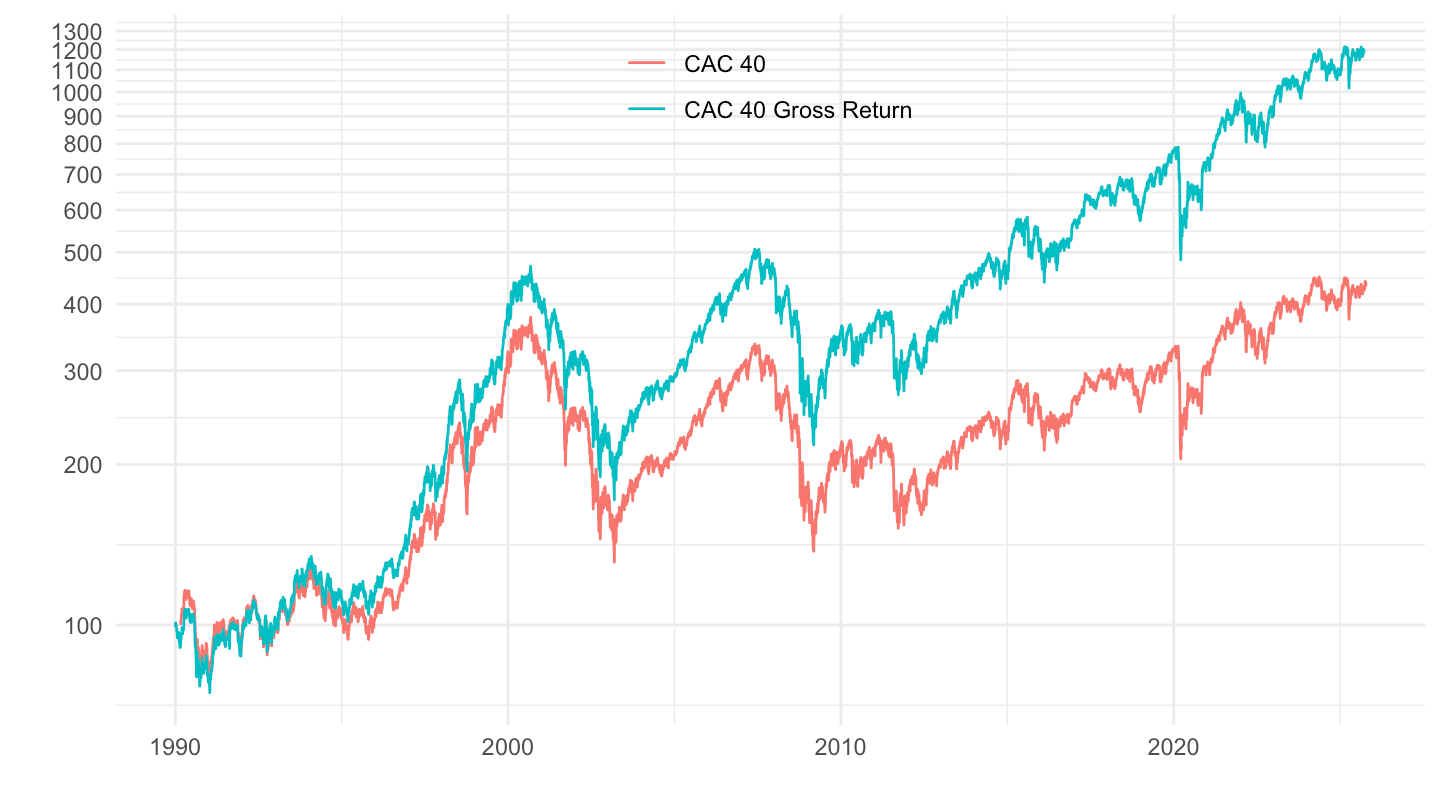
Bind
Code
ggpubr::ggarrange(plot_linear + ggtitle("Linear scale"), plot_log + ggtitle("Log scale"), common.legend = T)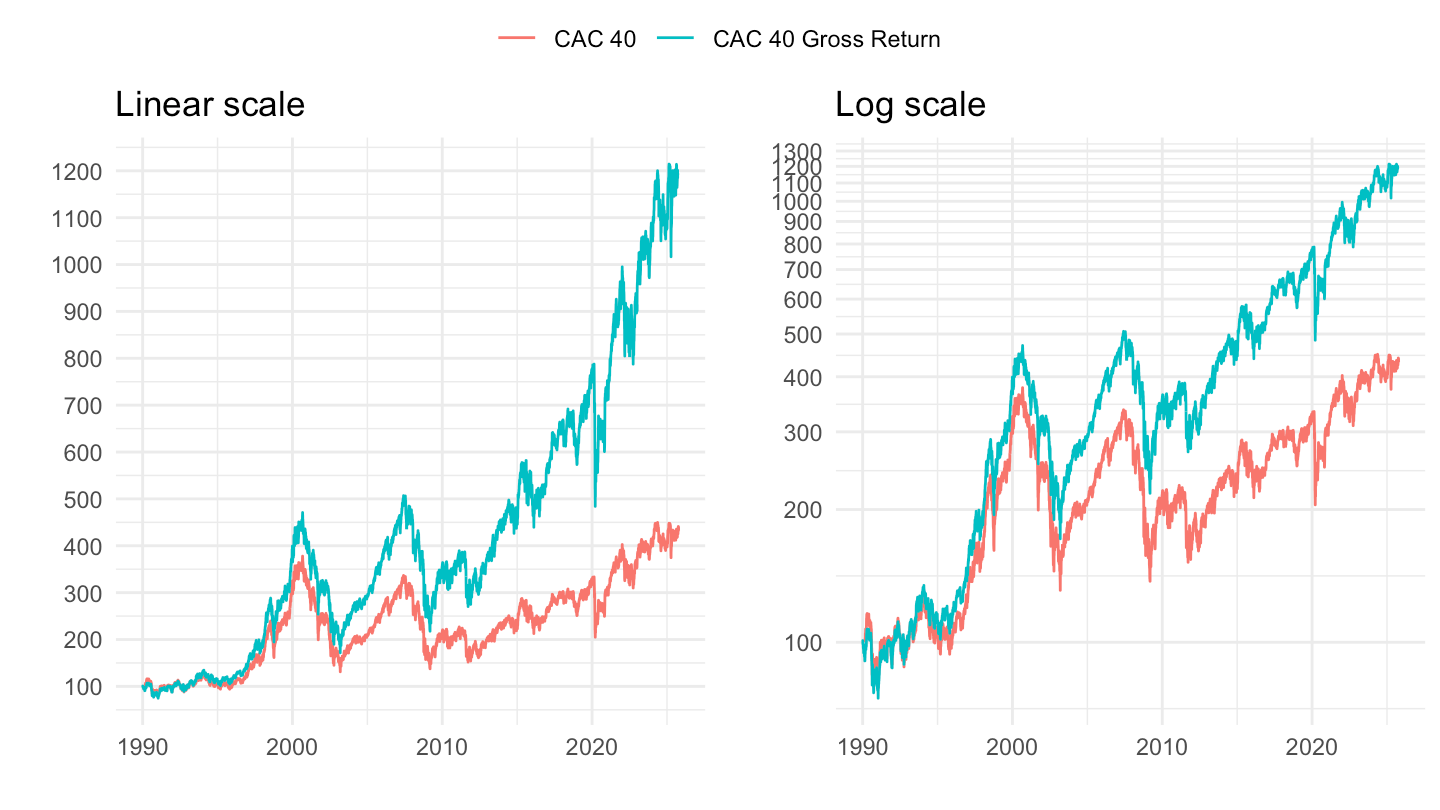
1996-
Linear
Code
plot_linear <- indices %>%
  filter(symbol %in% c("^FCHI")) %>%
  left_join(symbol, by = "symbol") %>%
  bind_rows(cac40_GR_new) %>%
  filter(date >= as.Date("1996-01-01")) %>%
  group_by(symbol) %>%
  arrange(date) %>%
  mutate(close = 100*close/close[1]) %>%
  ggplot() + geom_line(aes(x = date, y = close, color = Symbol)) +
  theme_minimal() + xlab("") + ylab("") +
  theme(legend.title = element_blank(),
        legend.position = c(0.5, 0.9)) +
  scale_y_continuous(breaks = seq(0, 10000, 100)) +
  scale_x_date(breaks = as.Date(paste0(seq(1945, 2100, 5), "-01-01")),
               labels = date_format("%Y"))

plot_linear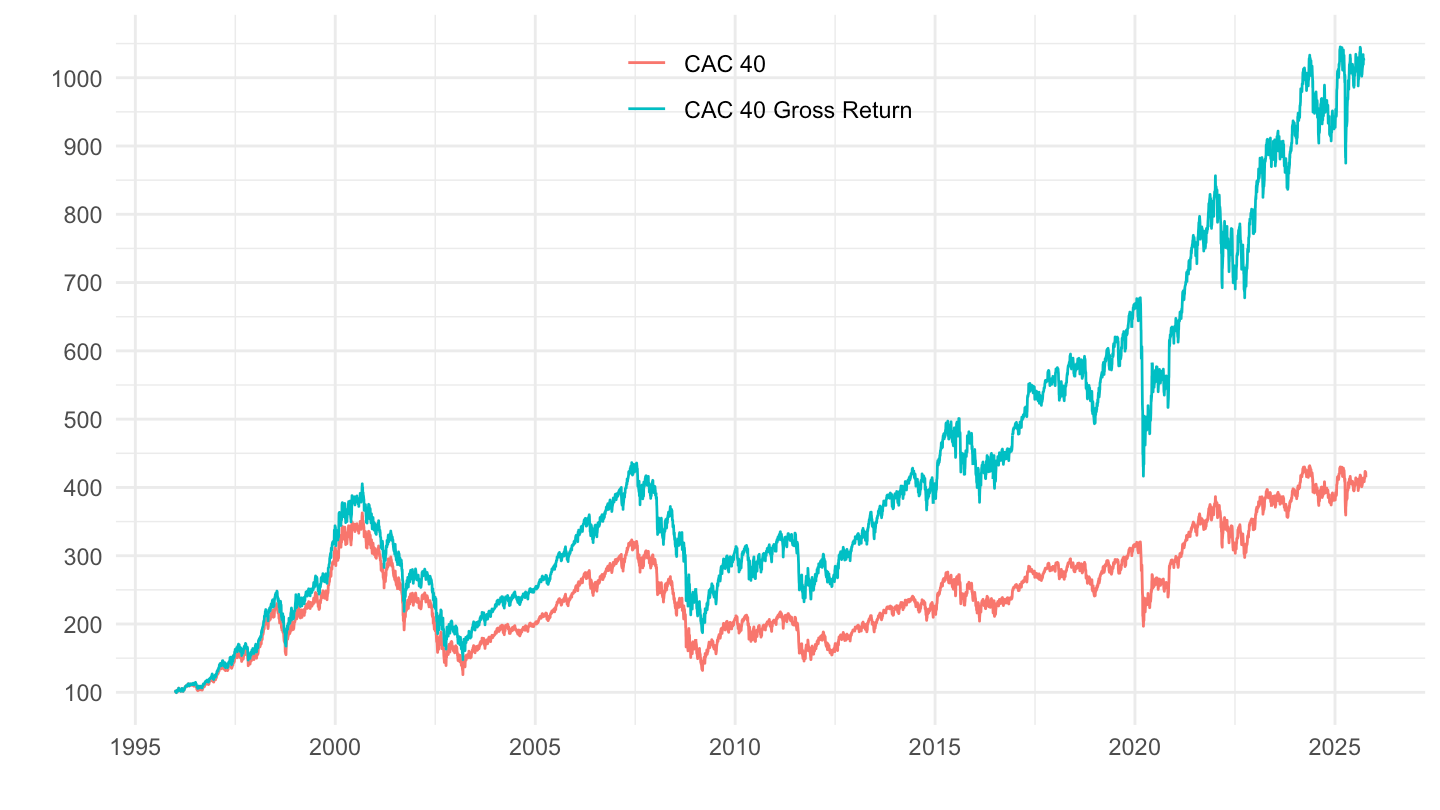
Log
Code
plot_log <- plot_linear +
  scale_y_log10(breaks = seq(0, 10000, 100))

plot_log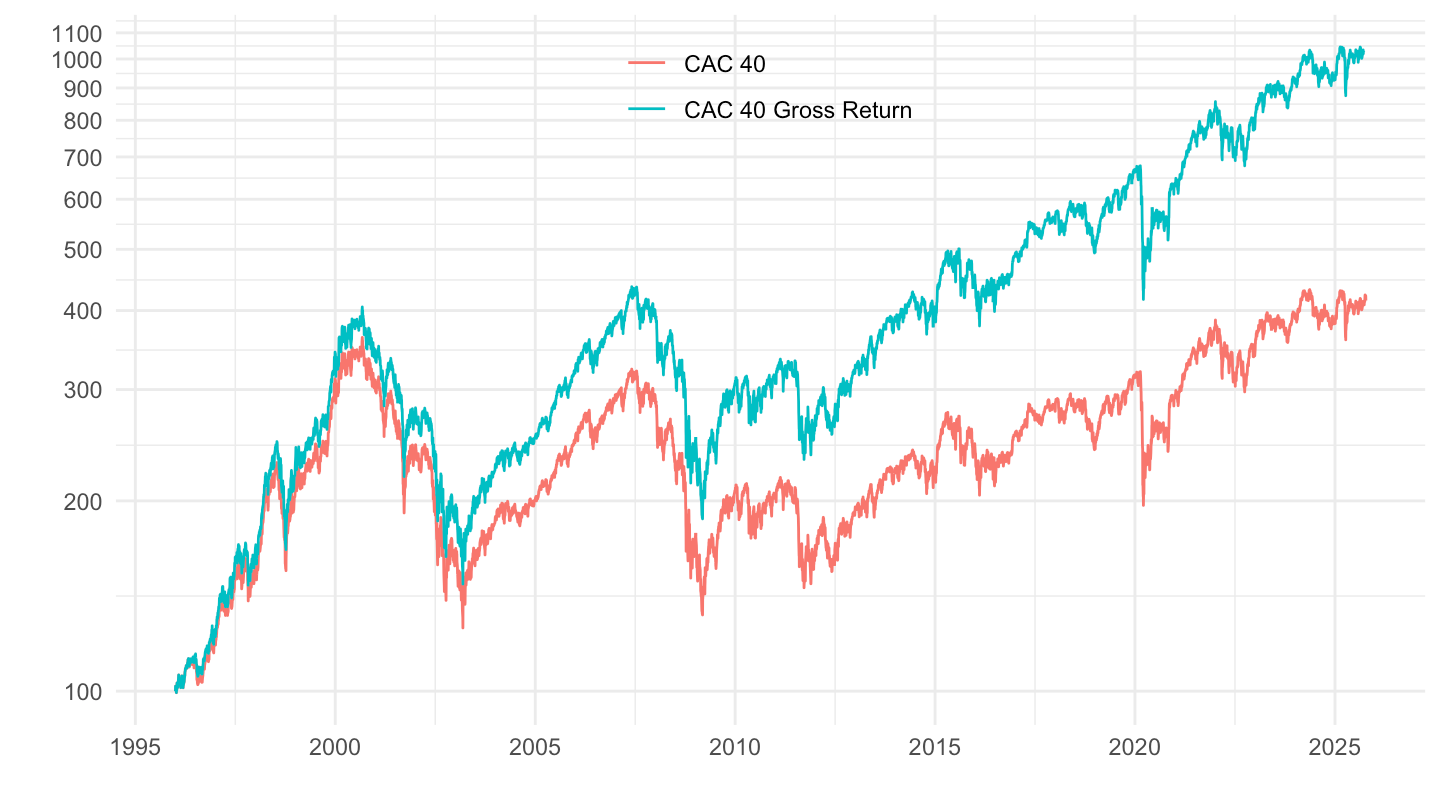
Bind
Code
ggpubr::ggarrange(plot_linear + ggtitle("Linear scale"), plot_log + ggtitle("Log scale"), common.legend = T)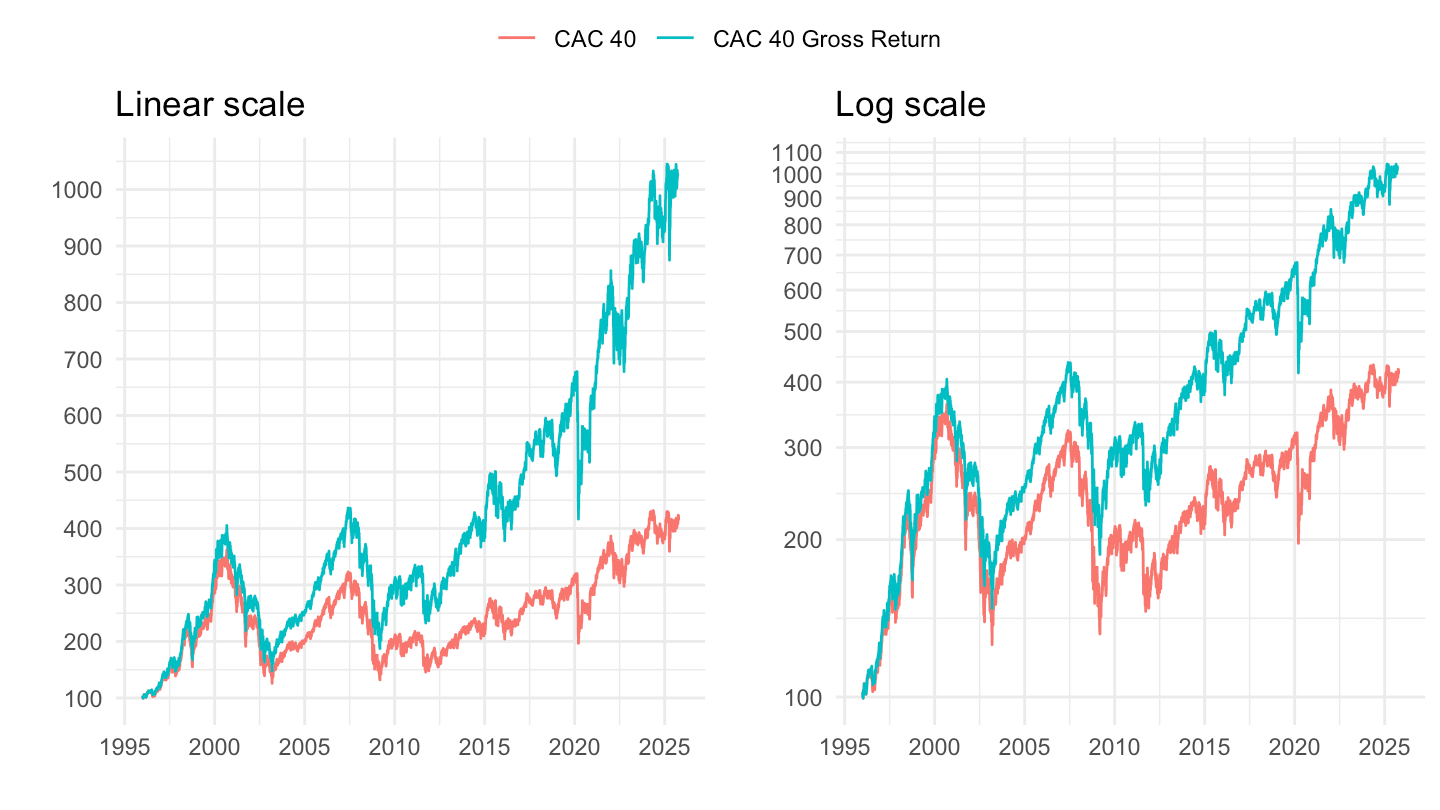
Nasdaq, S&P 500
1995-
Linear
Code
plot_linear <- indices %>%
  filter(symbol %in% c("^GSPC", "^IXIC")) %>%
  filter(date >= as.Date("1995-01-01")) %>%
  left_join(symbol, by = "symbol") %>%
  group_by(symbol) %>%
  arrange(date) %>%
  mutate(close = 100*close/close[1]) %>%
  ggplot() + geom_line(aes(x = date, y = close, color = Symbol)) +
  theme_minimal() + xlab("") + ylab("") +
  theme(legend.title = element_blank(),
        legend.position = c(0.5, 0.9)) +
  scale_y_continuous(breaks = seq(0, 10000, 100)) +
  scale_x_date(breaks = as.Date(paste0(seq(1945, 2100, 5), "-01-01")),
               labels = date_format("%Y"))

plot_linear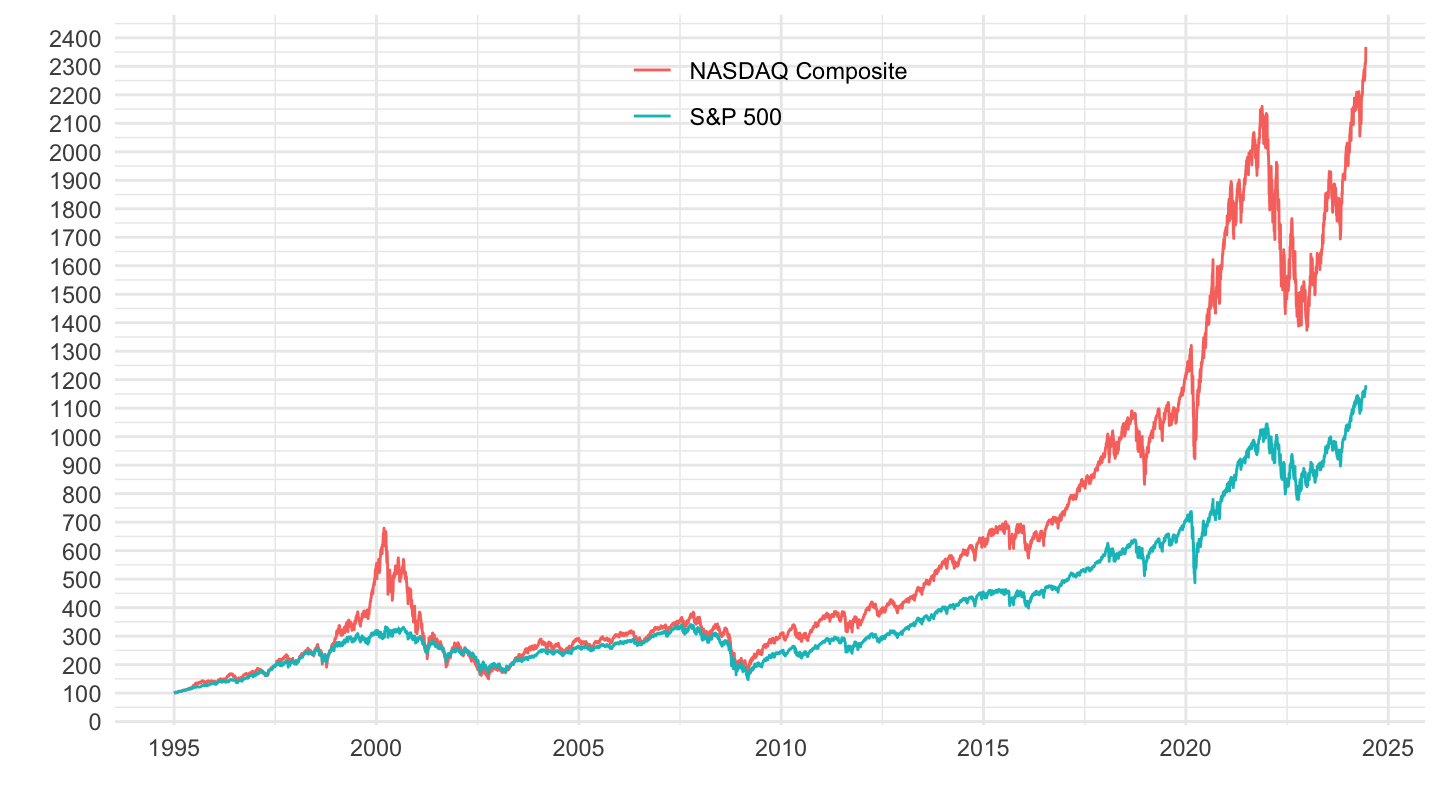
Log
Code
plot_log <- plot_linear +
  scale_y_log10(breaks = seq(0, 10000, 100))

plot_log
Bind
Code
ggpubr::ggarrange(plot_linear + ggtitle("Linear scale"), plot_log + ggtitle("Log scale"), common.legend = T)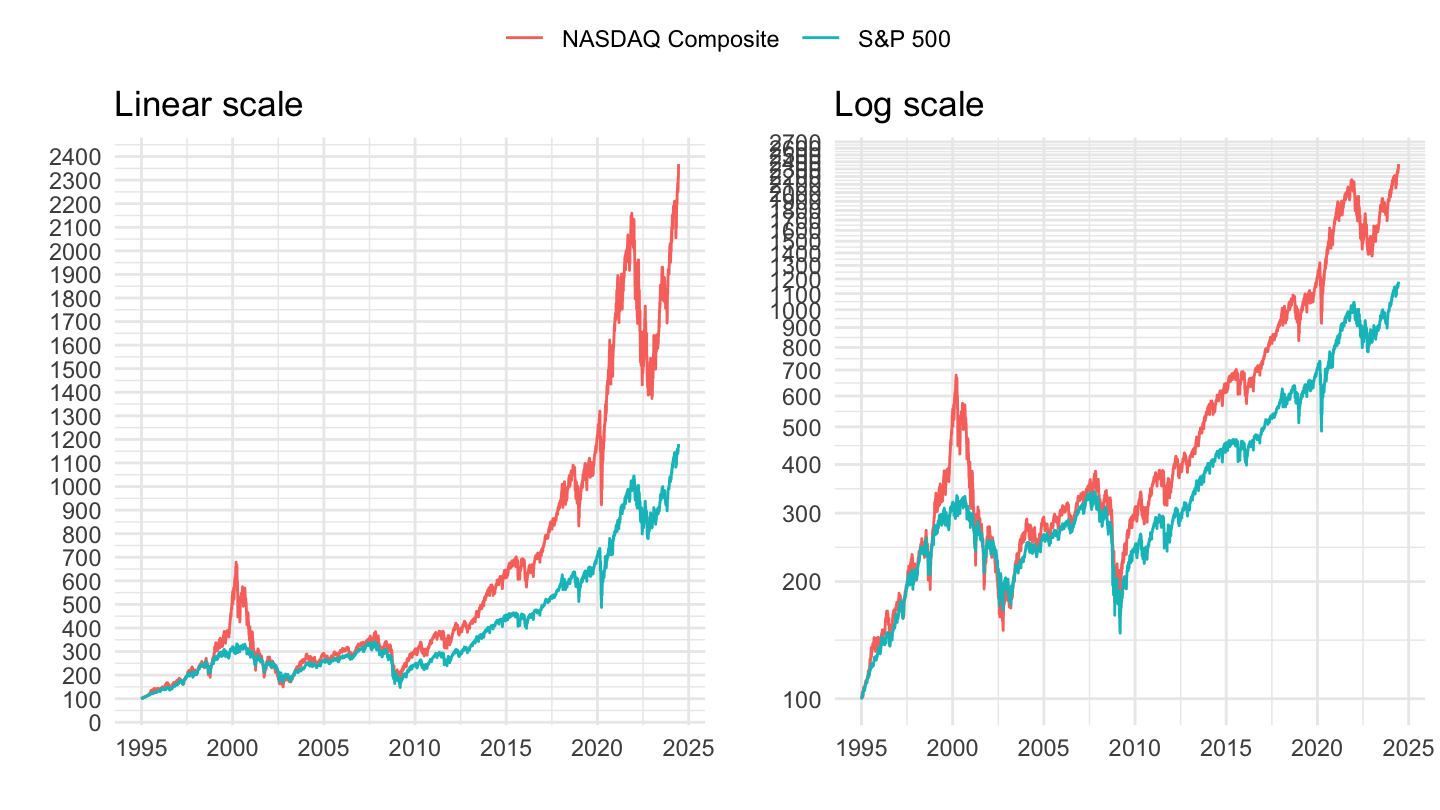
2002-
Linear
Code
plot_linear <- indices %>%
  filter(symbol %in% c("^GSPC", "^IXIC")) %>%
  filter(date >= as.Date("2002-01-01")) %>%
  left_join(symbol, by = "symbol") %>%
  group_by(symbol) %>%
  arrange(date) %>%
  mutate(close = 100*close/close[1]) %>%
  ggplot() + geom_line(aes(x = date, y = close, color = Symbol)) +
  theme_minimal() + xlab("") + ylab("") +
  theme(legend.title = element_blank(),
        legend.position = c(0.5, 0.9)) +
  scale_y_continuous(breaks = seq(0, 10000, 100)) +
  scale_x_date(breaks = as.Date(paste0(seq(1945, 2100, 5), "-01-01")),
               labels = date_format("%Y"))

plot_linear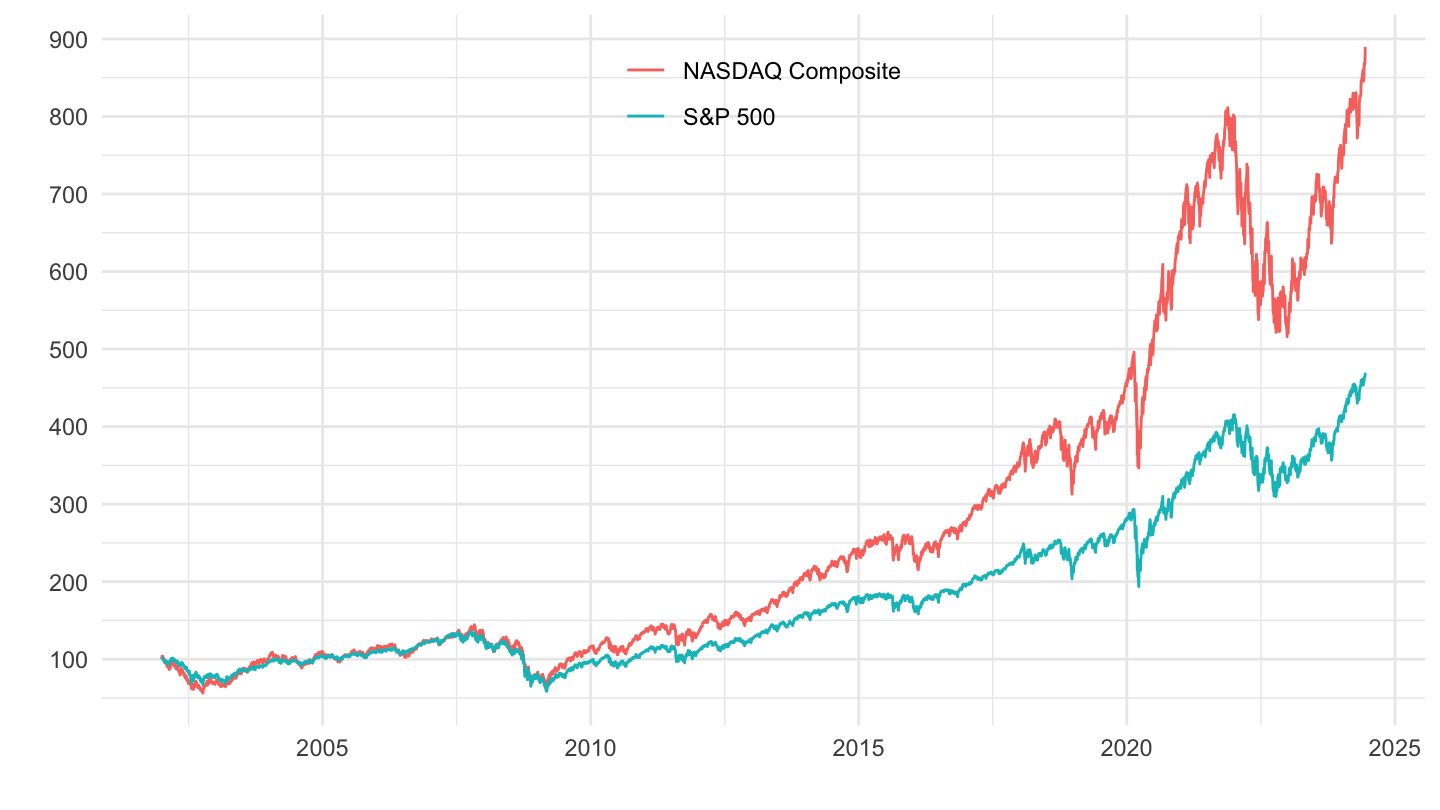
Log
Code
plot_log <- plot_linear +
  scale_y_log10(breaks = seq(0, 10000, 100))

plot_log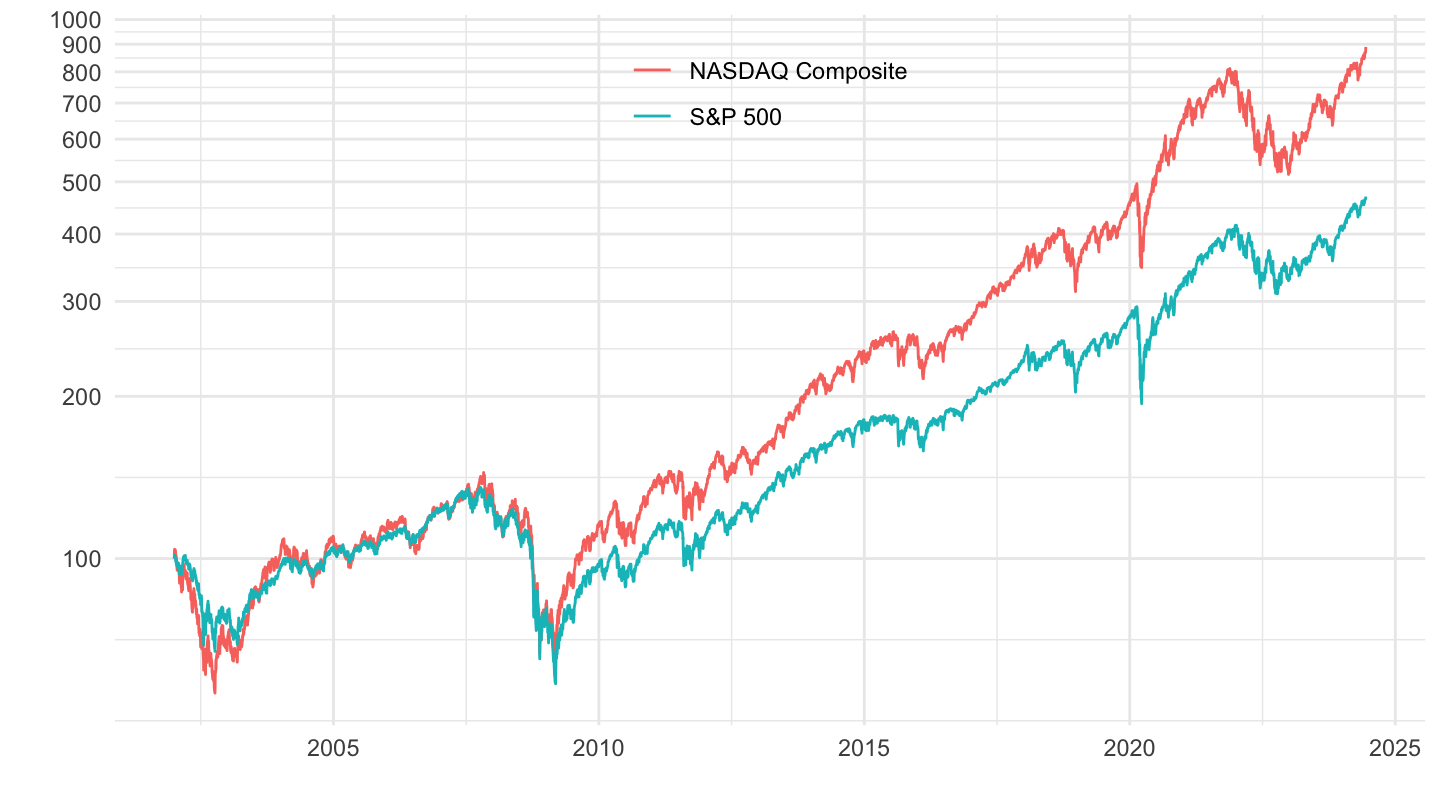
Bind
Code
ggpubr::ggarrange(plot_linear + ggtitle("Linear scale"), plot_log + ggtitle("Log scale"), common.legend = T)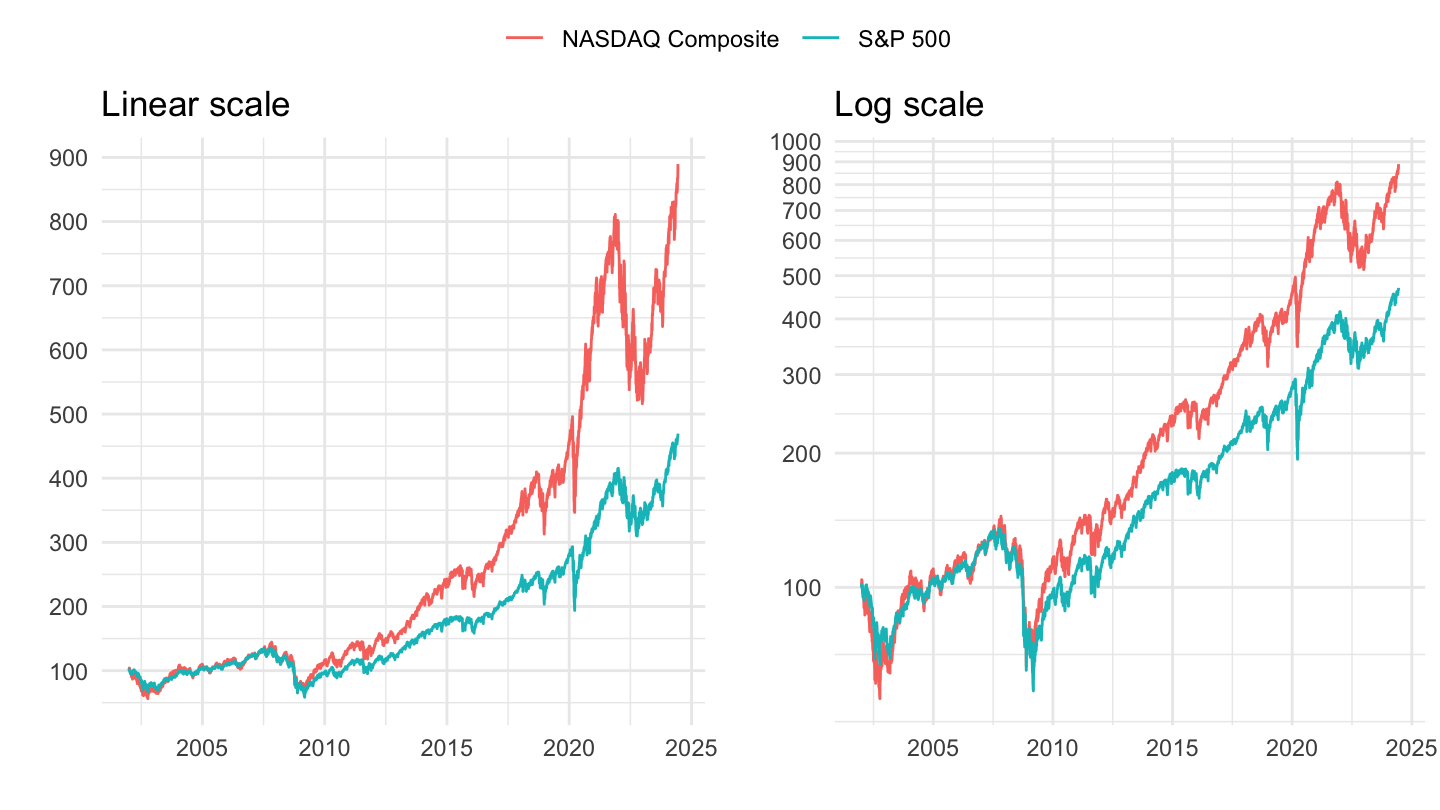
2010-
Linear
Code
plot_linear <- indices %>%
  filter(symbol %in% c("^GSPC", "^IXIC")) %>%
  filter(date >= as.Date("2010-01-01")) %>%
  left_join(symbol, by = "symbol") %>%
  group_by(symbol) %>%
  arrange(date) %>%
  mutate(close = 100*close/close[1]) %>%
  ggplot() + geom_line(aes(x = date, y = close, color = Symbol)) +
  theme_minimal() + xlab("") + ylab("") +
  theme(legend.title = element_blank(),
        legend.position = c(0.5, 0.9)) +
  scale_y_continuous(breaks = seq(0, 10000, 100)) +
  scale_x_date(breaks = as.Date(paste0(seq(1945, 2100, 5), "-01-01")),
               labels = date_format("%Y"))

plot_linear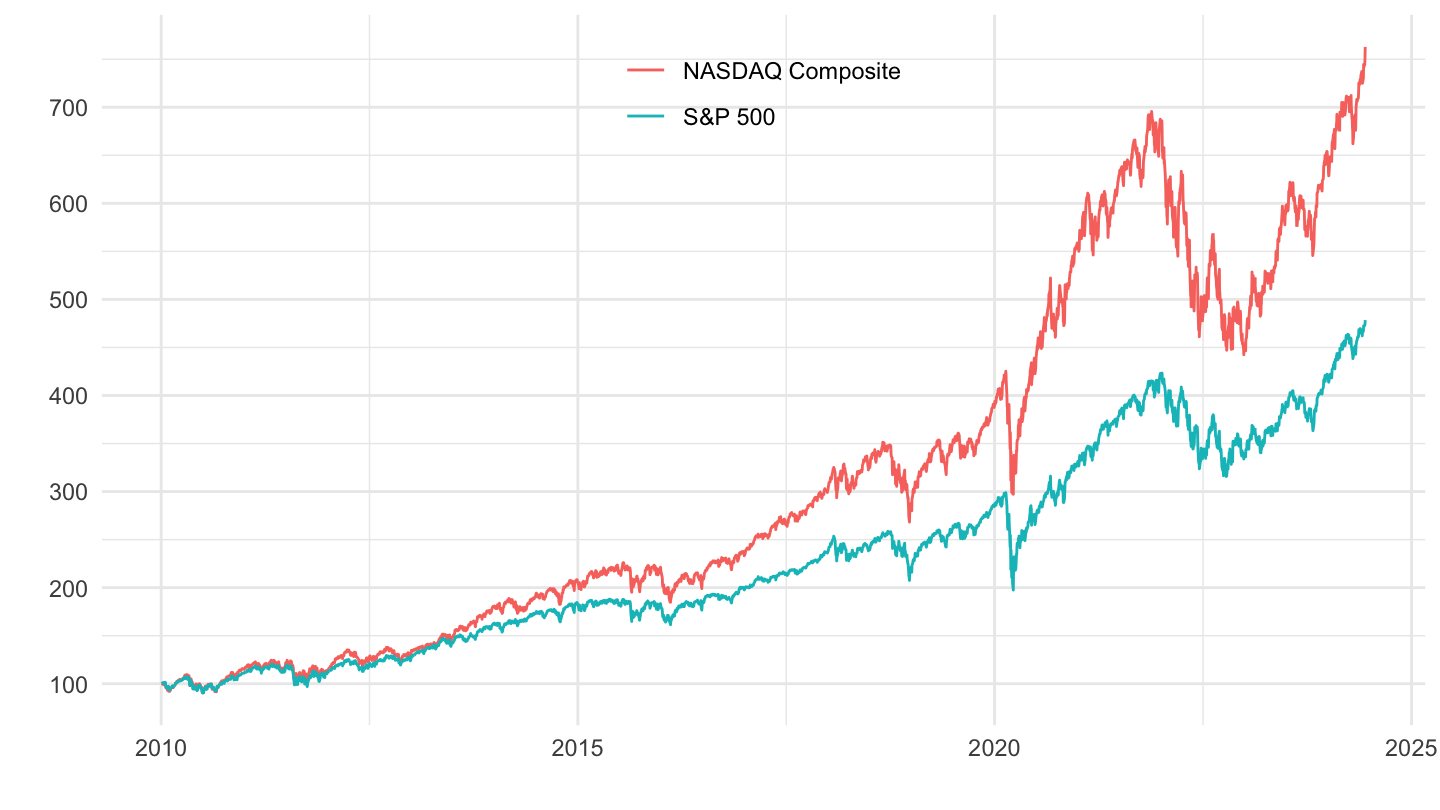
Log
Code
plot_log <- plot_linear +
  scale_y_log10(breaks = seq(0, 10000, 100))

plot_log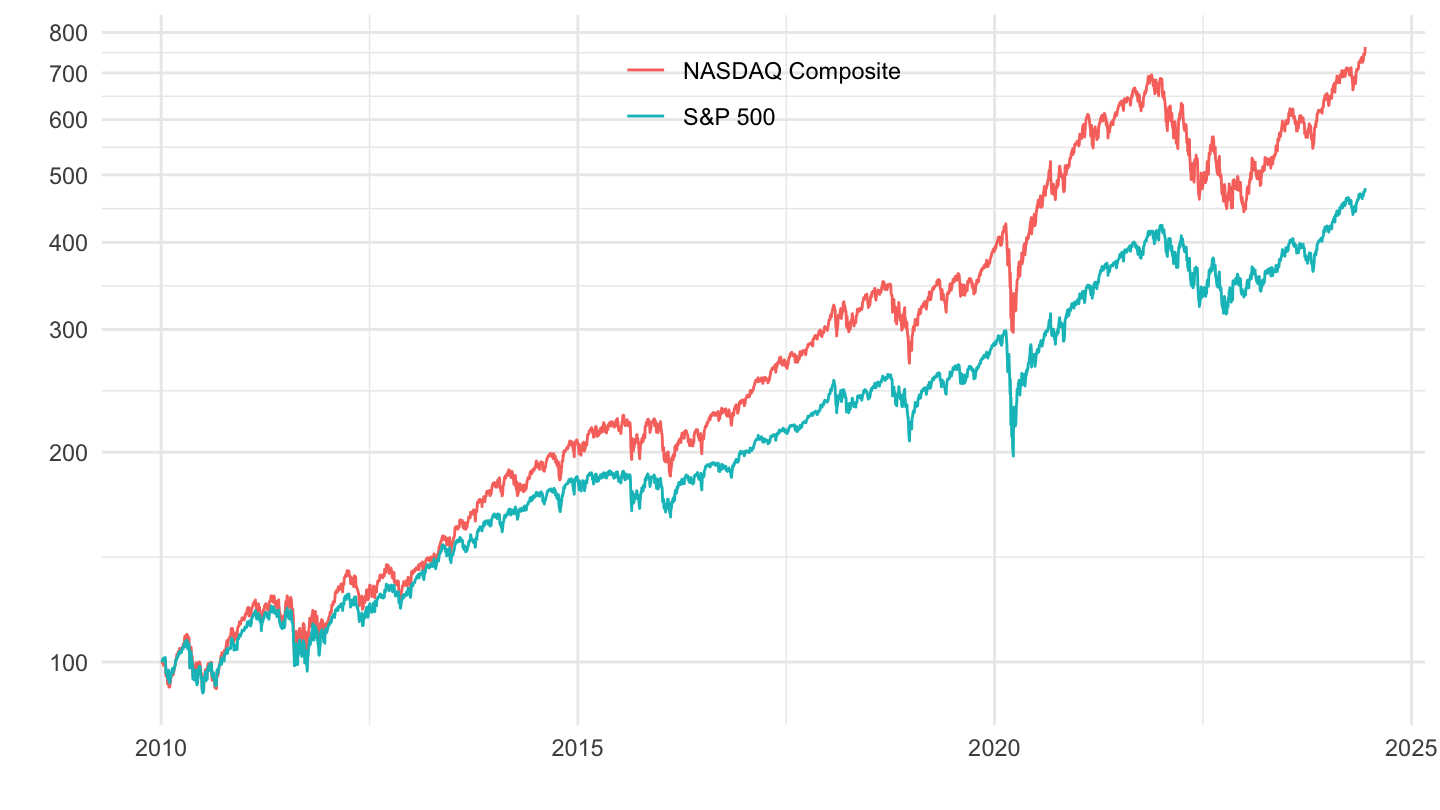
Bind
Code
ggpubr::ggarrange(plot_linear + ggtitle("Linear scale"), plot_log + ggtitle("Log scale"), common.legend = T)
Nasdaq, S&P 500, Euro Stoxx
1995-
Linear
Code
plot_linear <- indices %>%
  filter(symbol %in% c("^STOXX50E", "^GSPC", "^IXIC")) %>%
  filter(date >= as.Date("1995-01-01")) %>%
  left_join(symbol, by = "symbol") %>%
  group_by(symbol) %>%
  arrange(date) %>%
  mutate(close = 100*close/close[1]) %>%
  ggplot() + geom_line(aes(x = date, y = close, color = Symbol)) +
  theme_minimal() + xlab("") + ylab("") +
  theme(legend.title = element_blank(),
        legend.position = c(0.5, 0.9)) +
  scale_y_continuous(breaks = seq(0, 10000, 100)) +
  scale_x_date(breaks = as.Date(paste0(seq(1945, 2100, 5), "-01-01")),
               labels = date_format("%Y"))

plot_linear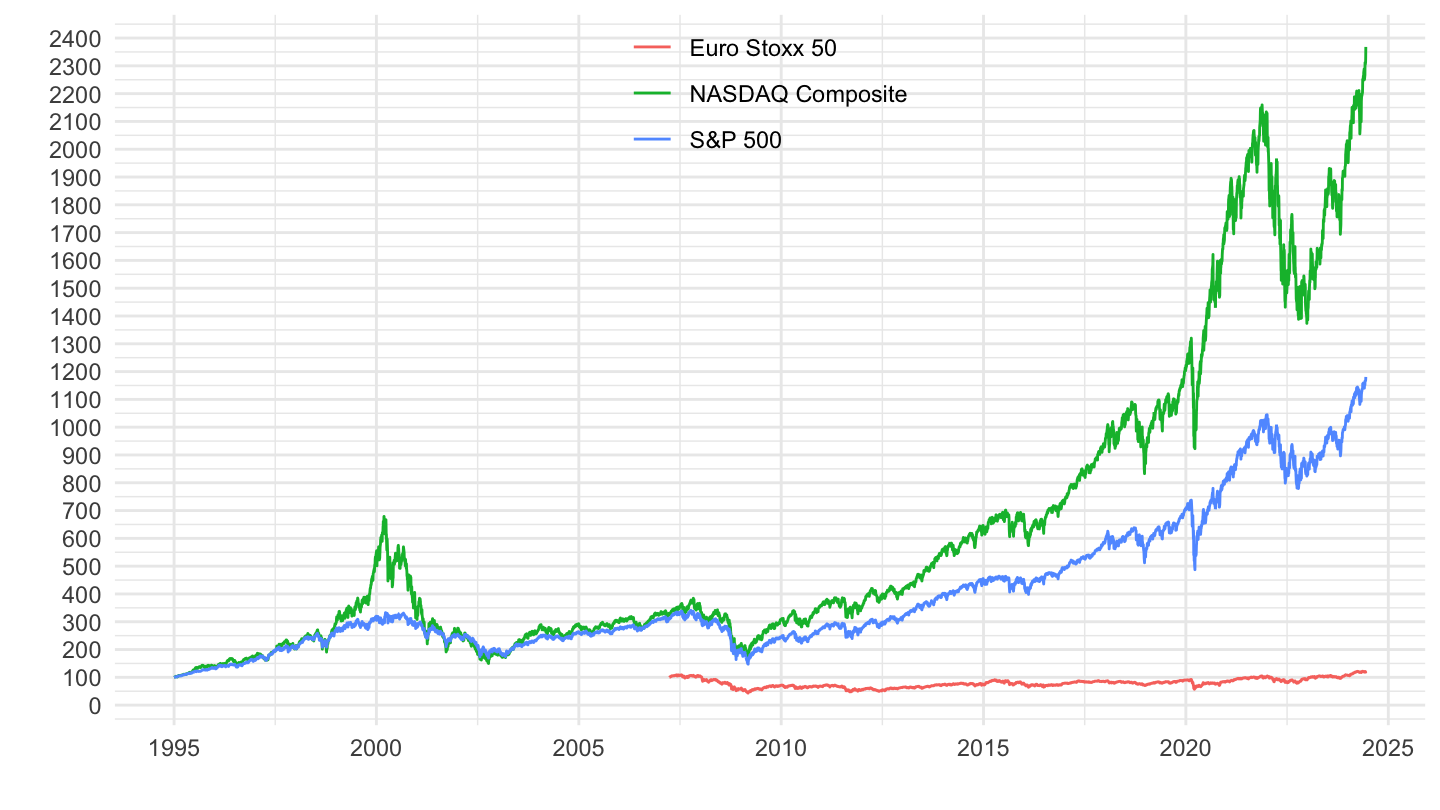
Log
Code
plot_log <- plot_linear +
  scale_y_log10(breaks = seq(0, 10000, 100))

plot_log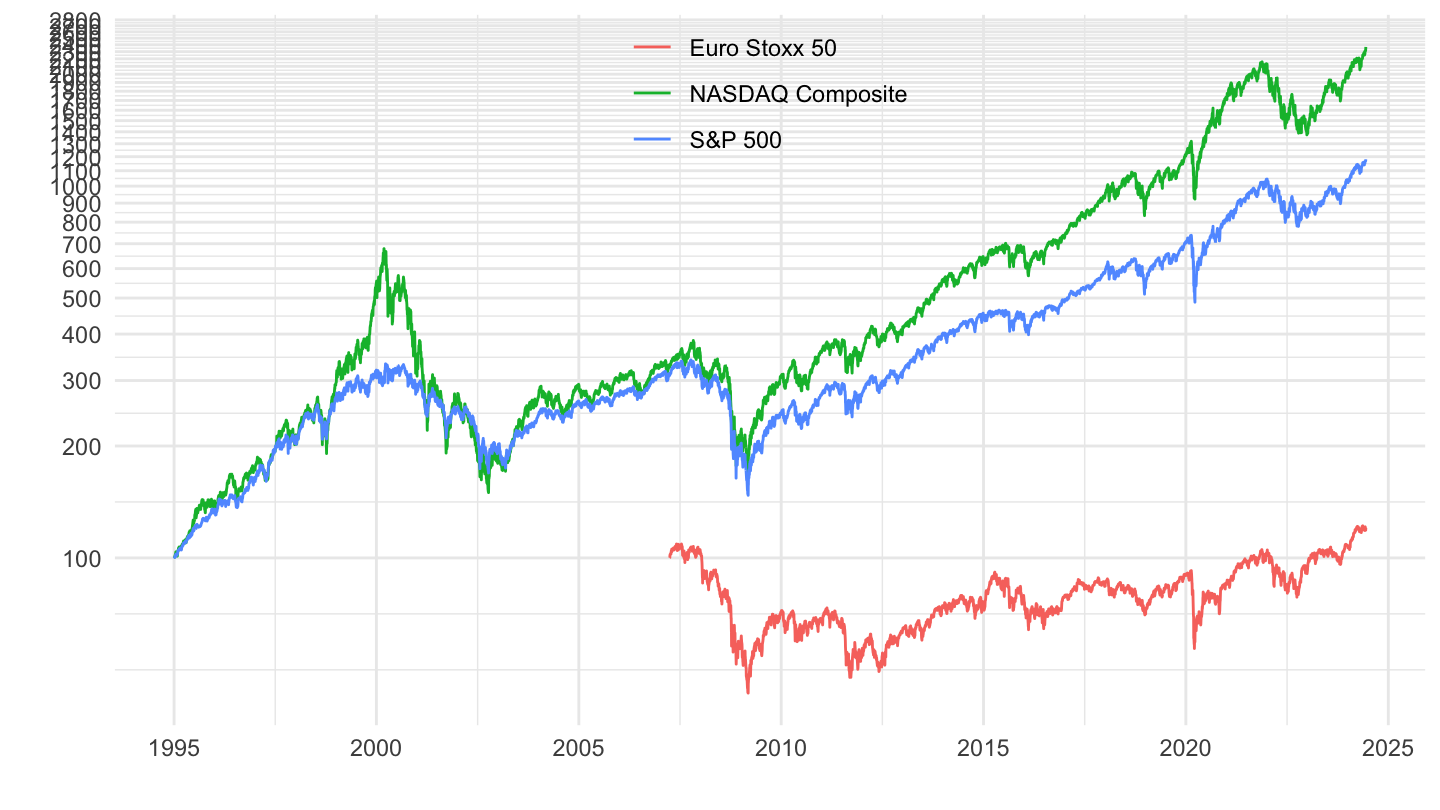
Bind
Code
ggpubr::ggarrange(plot_linear + ggtitle("Linear scale"), plot_log + ggtitle("Log scale"), common.legend = T)
2007-
Linear
Code
plot_linear <- indices %>%
  filter(symbol %in% c("^STOXX50E", "^GSPC", "^IXIC")) %>%
  filter(date >= as.Date("2007-01-01")) %>%
  left_join(symbol, by = "symbol") %>%
  group_by(symbol) %>%
  arrange(date) %>%
  mutate(close = 100*close/close[1]) %>%
  ggplot() + geom_line(aes(x = date, y = close, color = Symbol)) +
  theme_minimal() + xlab("") + ylab("") +
  theme(legend.title = element_blank(),
        legend.position = c(0.5, 0.9)) +
  scale_y_continuous(breaks = seq(0, 10000, 100)) +
  scale_x_date(breaks = as.Date(paste0(seq(1945, 2100, 2), "-01-01")),
               labels = date_format("%Y"))

plot_linear
Log
Code
plot_log <- plot_linear +
  scale_y_log10(breaks = seq(0, 10000, 100))

plot_log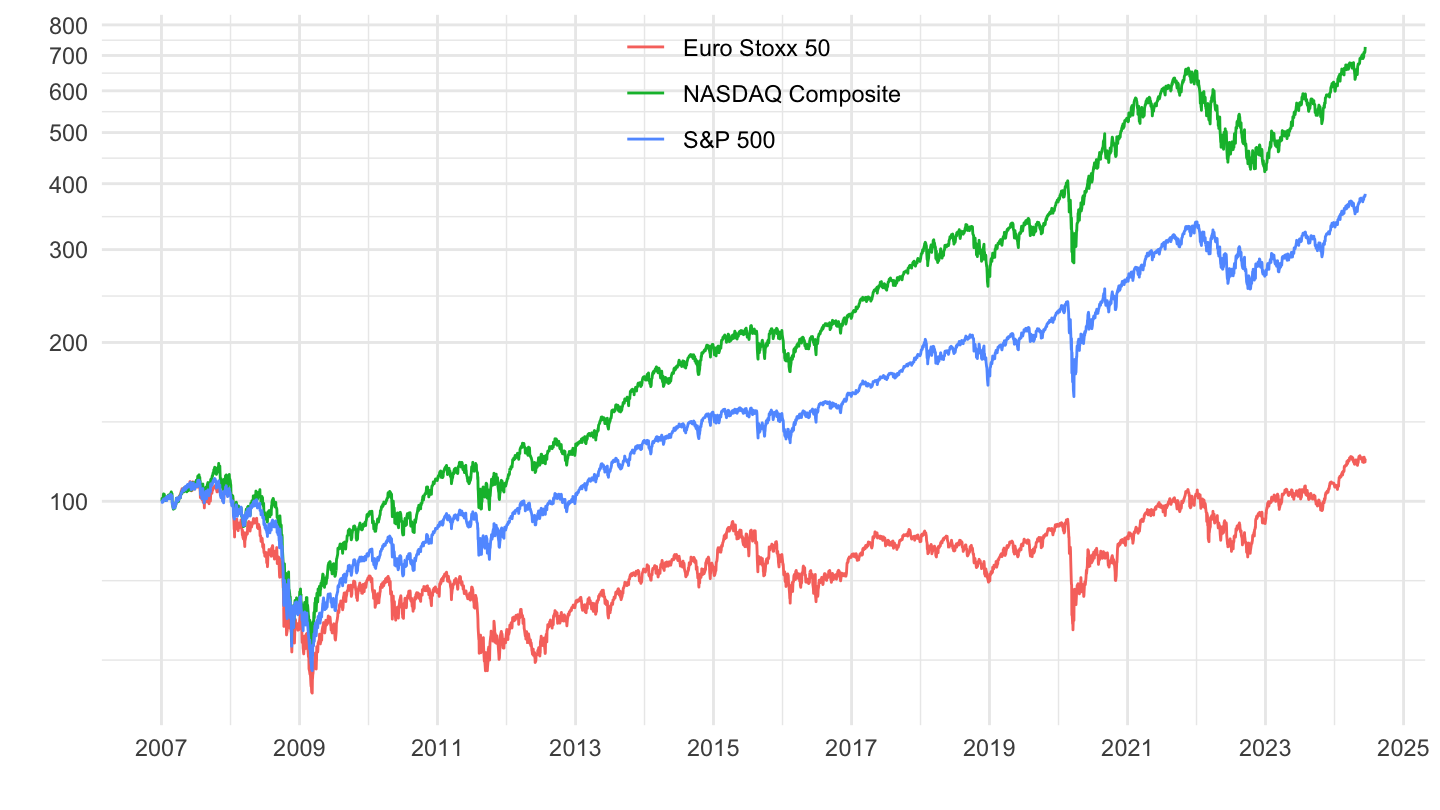
Bind
Code
ggpubr::ggarrange(plot_linear + ggtitle("Linear scale"), plot_log + ggtitle("Log scale"), common.legend = T)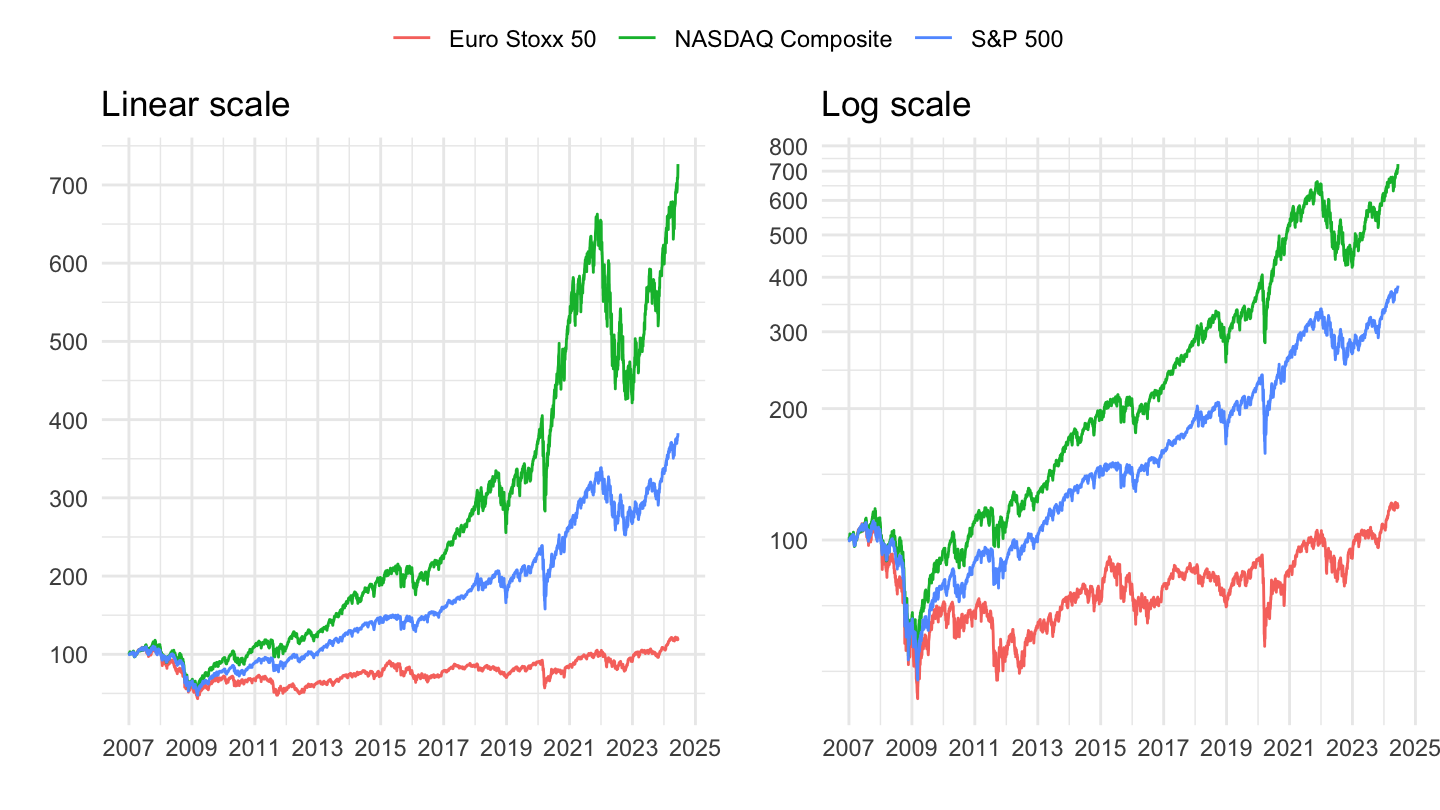
S&P 500
All
Linear
Code
plot_linear <- indices %>%
  filter(symbol %in% c("^GSPC")) %>%
  #filter(date >= as.Date("1990-01-01")) %>%
  left_join(symbol, by = "symbol") %>%
  group_by(symbol) %>%
  arrange(date) %>%
  mutate(close = 100*close/close[1]) %>%
  ggplot() + geom_line(aes(x = date, y = close)) +
  theme_minimal() + xlab("") + ylab("") +
  theme(legend.title = element_blank(),
        legend.position = c(0.5, 0.9)) +
  scale_y_continuous(breaks = seq(0, 10000, 500)) +
  scale_x_date(breaks = as.Date(paste0(seq(1945, 2100, 5), "-01-01")),
               labels = date_format("%Y"))

plot_linear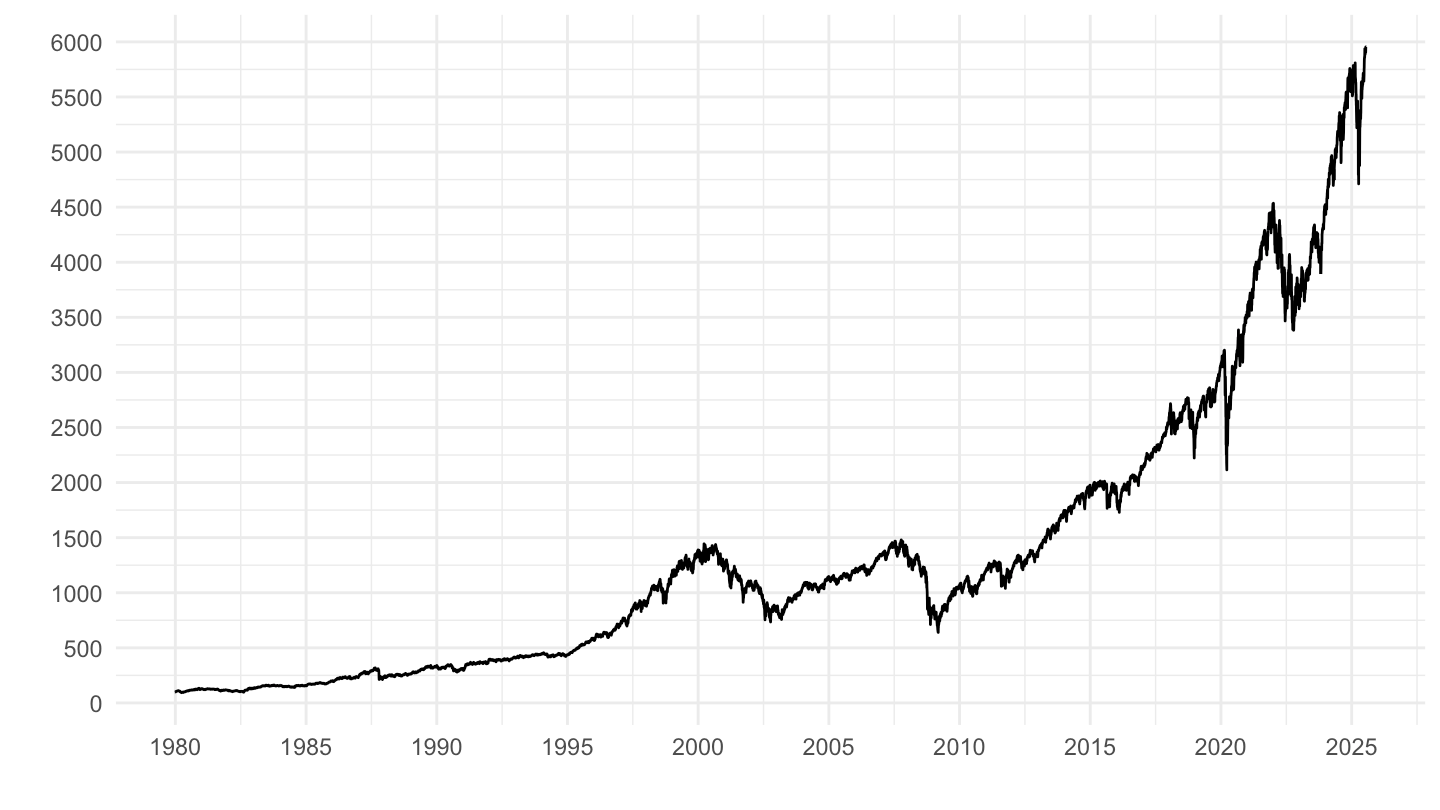
Log
Code
plot_log <- plot_linear +
  scale_y_log10(breaks = seq(0, 10000, 500))

plot_log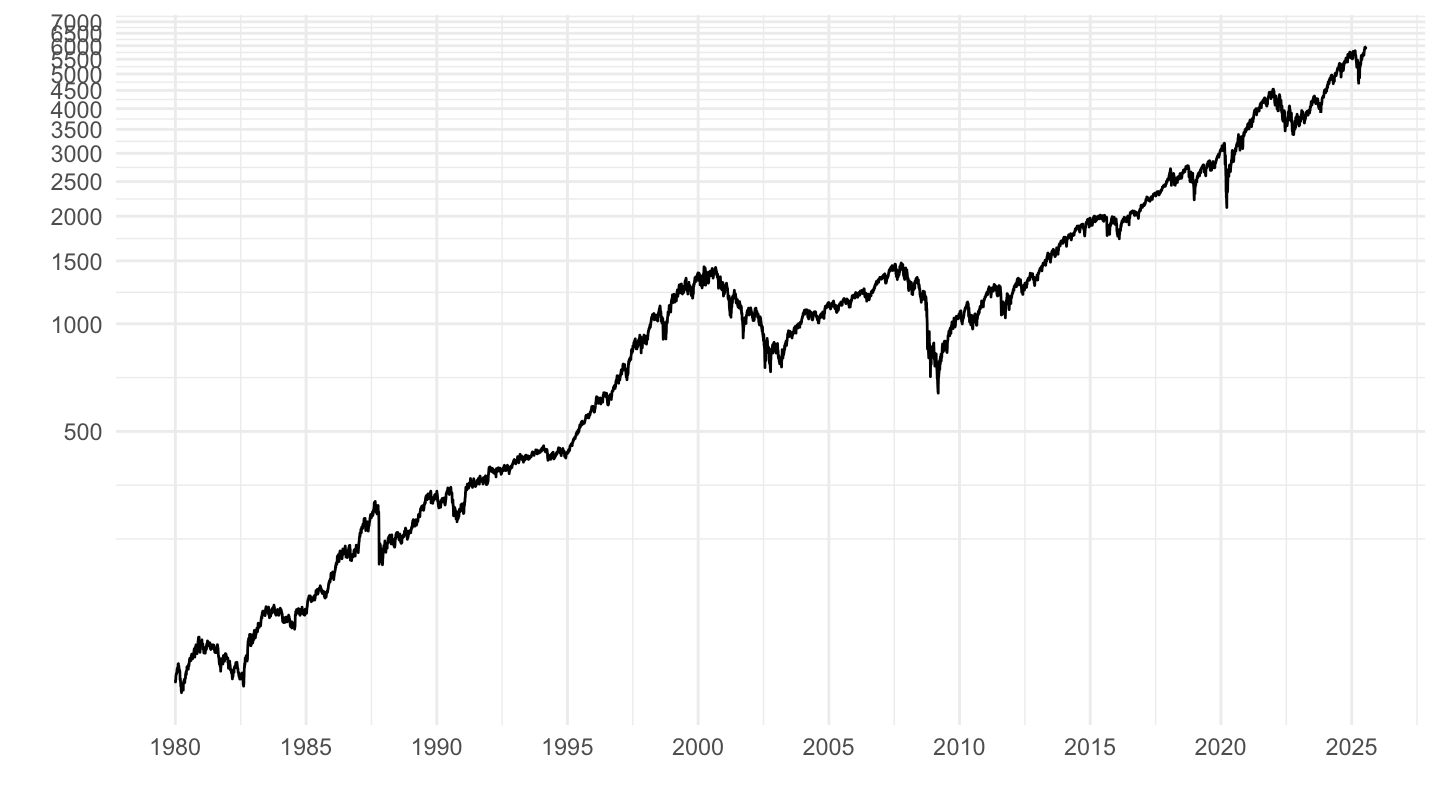
Bind
Code
ggpubr::ggarrange(plot_linear + ggtitle("Linear scale"), plot_log + ggtitle("Log scale"), common.legend = T)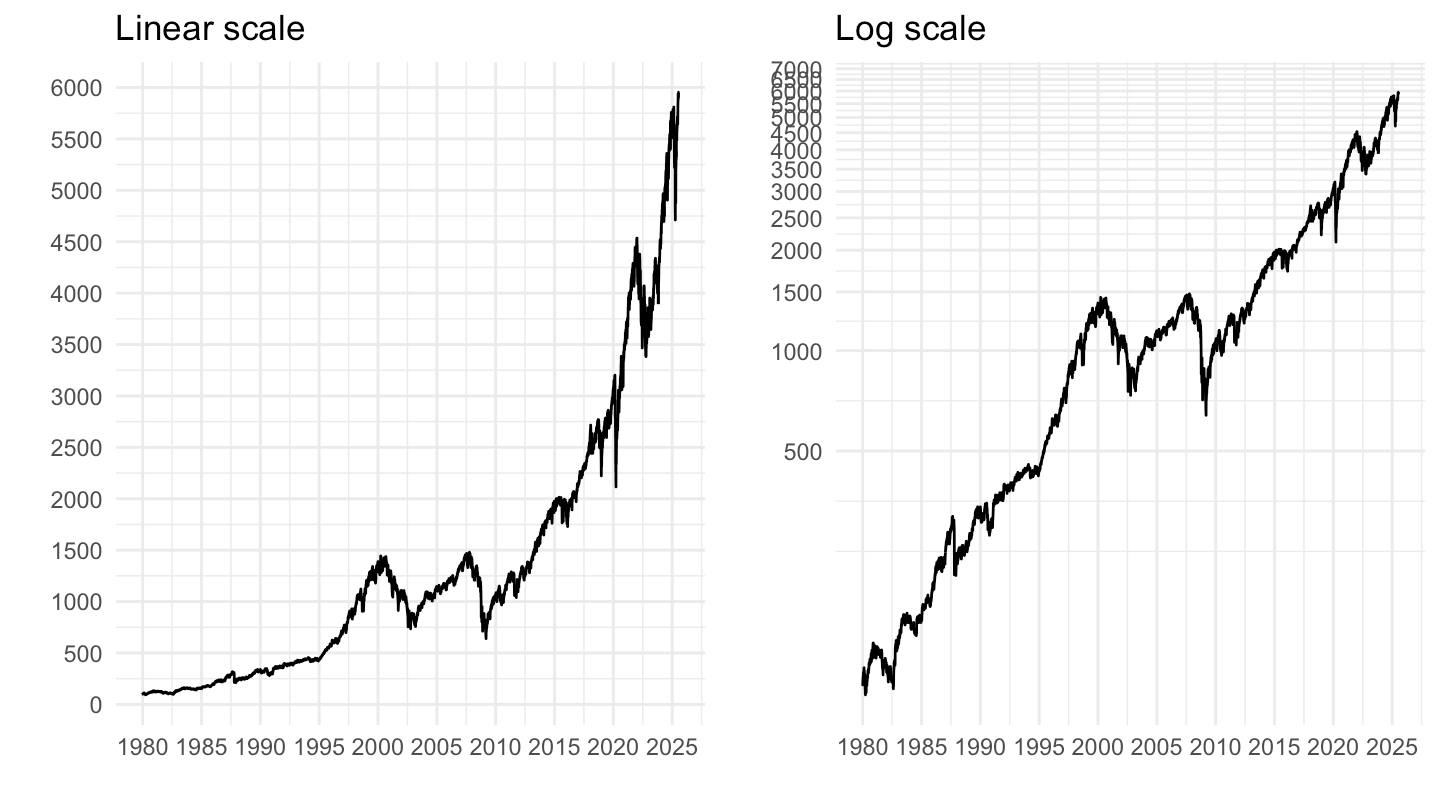
1990-
Linear
Code
plot_linear <- indices %>%
  filter(symbol %in% c("^GSPC")) %>%
  filter(date >= as.Date("1990-01-01")) %>%
  left_join(symbol, by = "symbol") %>%
  group_by(symbol) %>%
  arrange(date) %>%
  mutate(close = 100*close/close[1]) %>%
  ggplot() + geom_line(aes(x = date, y = close)) +
  theme_minimal() + xlab("") + ylab("") +
  theme(legend.title = element_blank(),
        legend.position = c(0.5, 0.9)) +
  scale_y_continuous(breaks = seq(0, 10000, 100)) +
  scale_x_date(breaks = as.Date(paste0(seq(1945, 2100, 5), "-01-01")),
               labels = date_format("%Y"))

plot_linear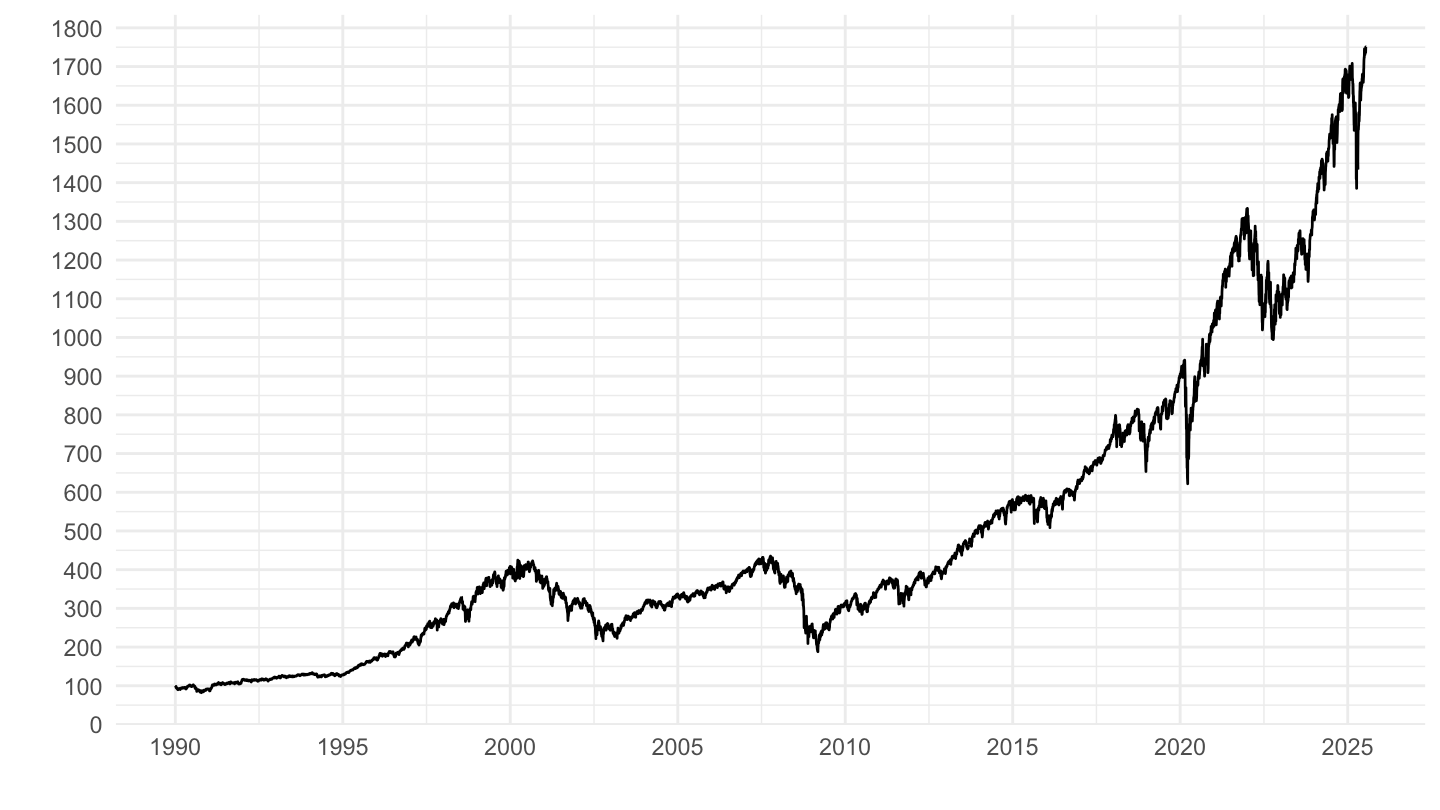
Log
Code
plot_log <- plot_linear +
  scale_y_log10(breaks = seq(0, 10000, 100))

plot_log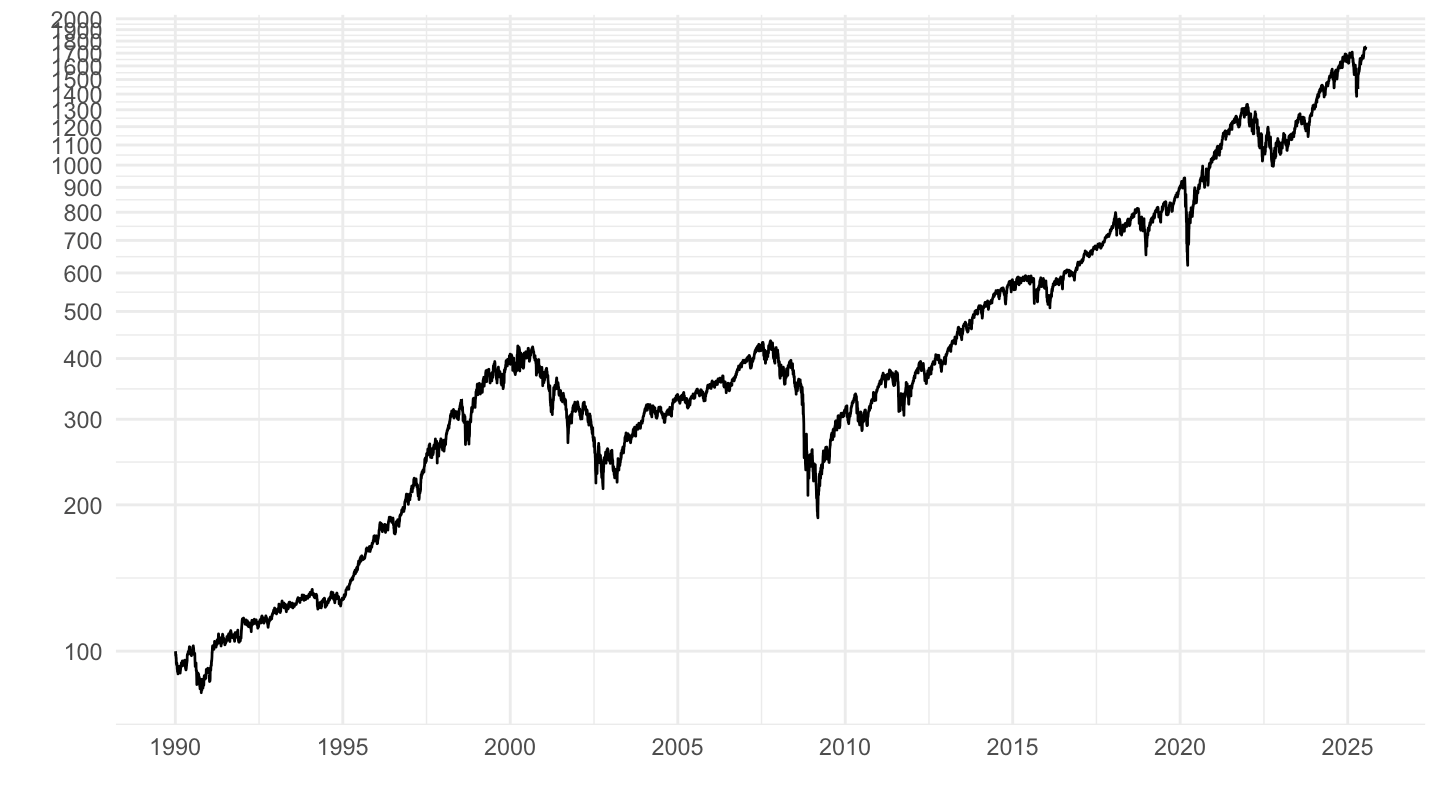
Bind
Code
ggpubr::ggarrange(plot_linear + ggtitle("Linear scale"), plot_log + ggtitle("Log scale"), common.legend = T)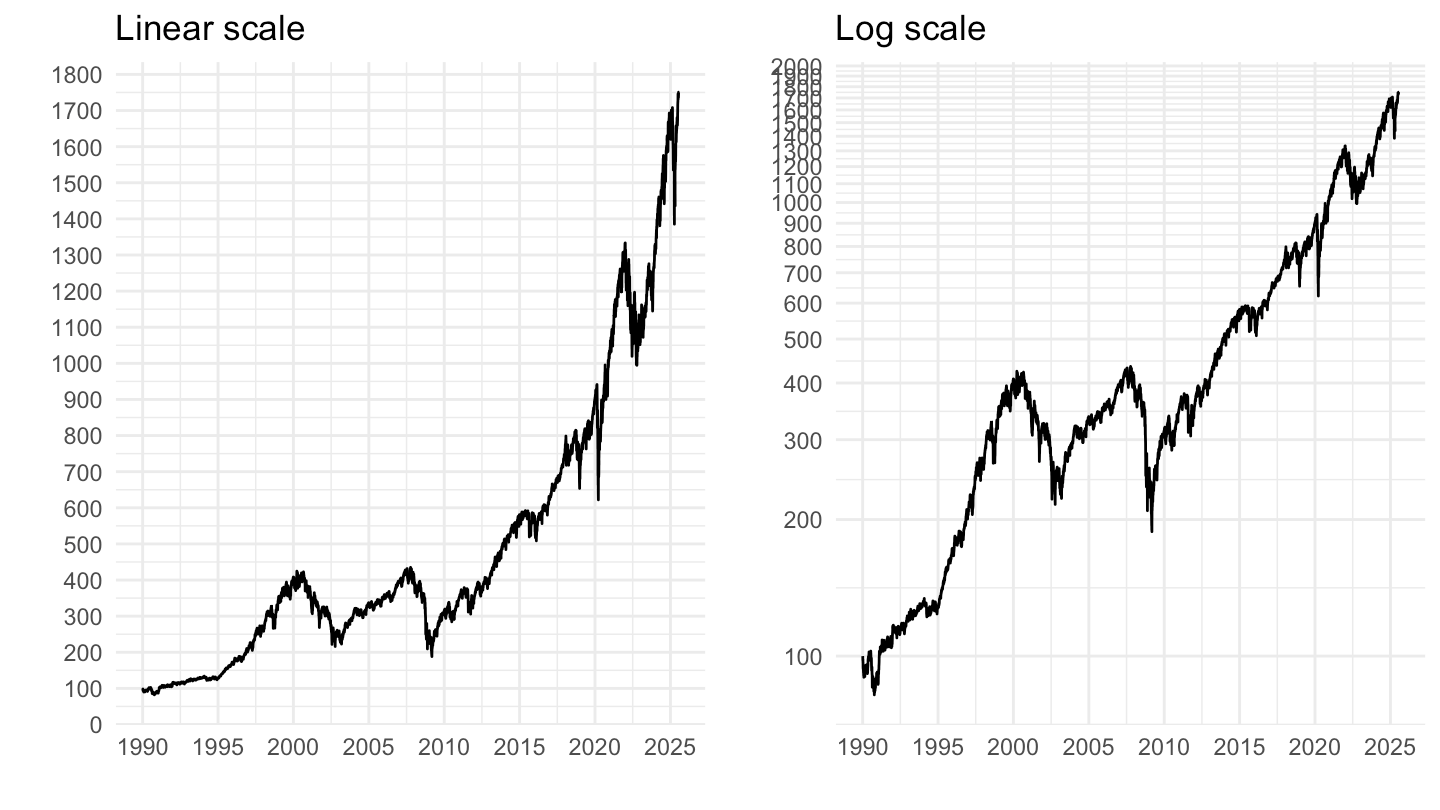
CAC40, S&P 500
1990-
Linear
Code
plot_linear <- indices %>%
  filter(symbol %in% c("^FCHI", "^GSPC")) %>%
  filter(date >= as.Date("1990-01-01")) %>%
  left_join(symbol, by = "symbol") %>%
  group_by(symbol) %>%
  arrange(date) %>%
  mutate(close = 100*close/close[1]) %>%
  ggplot() + geom_line(aes(x = date, y = close, color = Symbol)) +
  theme_minimal() + xlab("") + ylab("") +
  theme(legend.title = element_blank(),
        legend.position = c(0.5, 0.9)) +
  scale_y_continuous(breaks = seq(0, 10000, 100)) +
  scale_x_date(breaks = as.Date(paste0(seq(1945, 2100, 5), "-01-01")),
               labels = date_format("%Y"))

plot_linear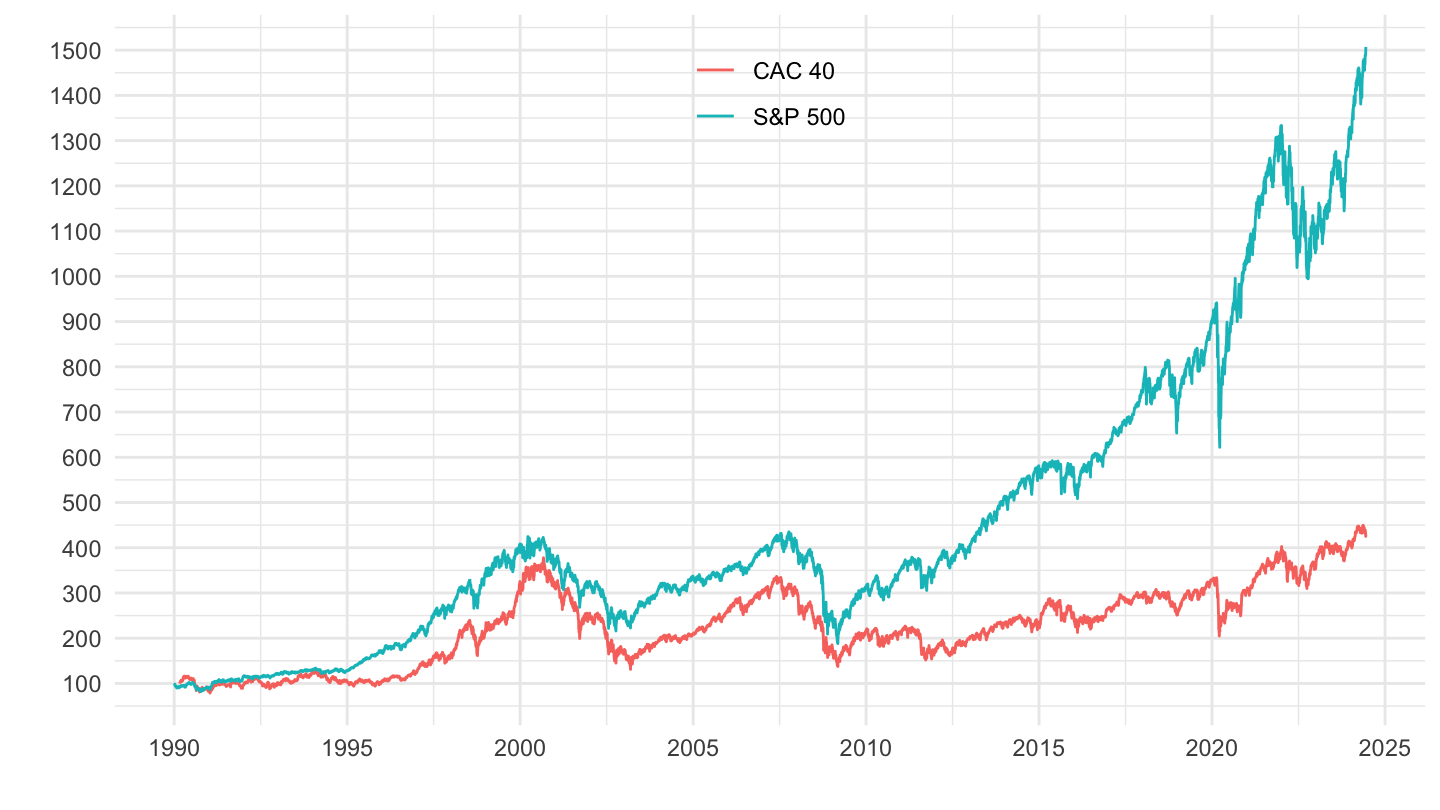
Log
Code
plot_log <- plot_linear +
  scale_y_log10(breaks = seq(0, 10000, 100))

plot_log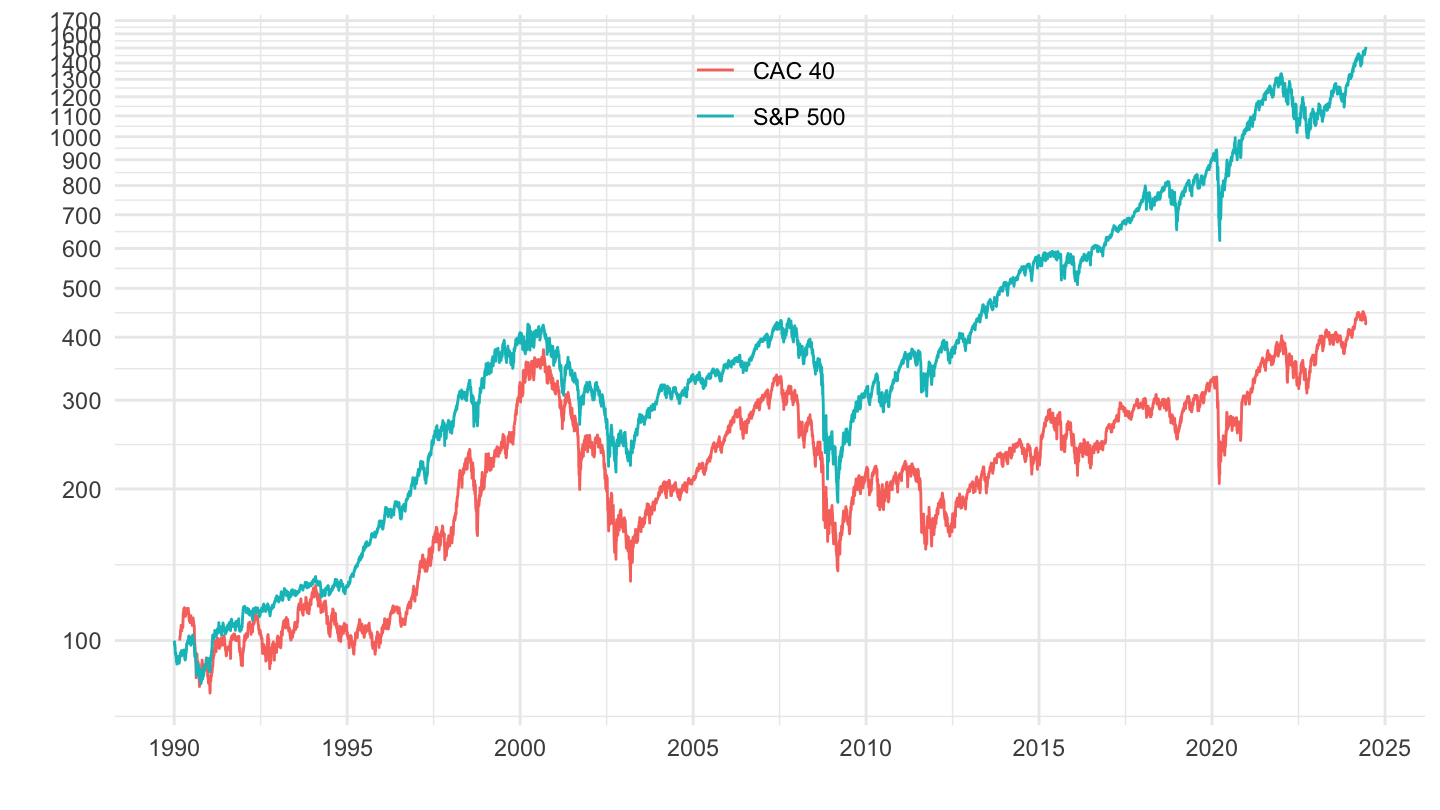
Bind
Code
ggpubr::ggarrange(plot_linear + ggtitle("Linear scale"), plot_log + ggtitle("Log scale"), common.legend = T)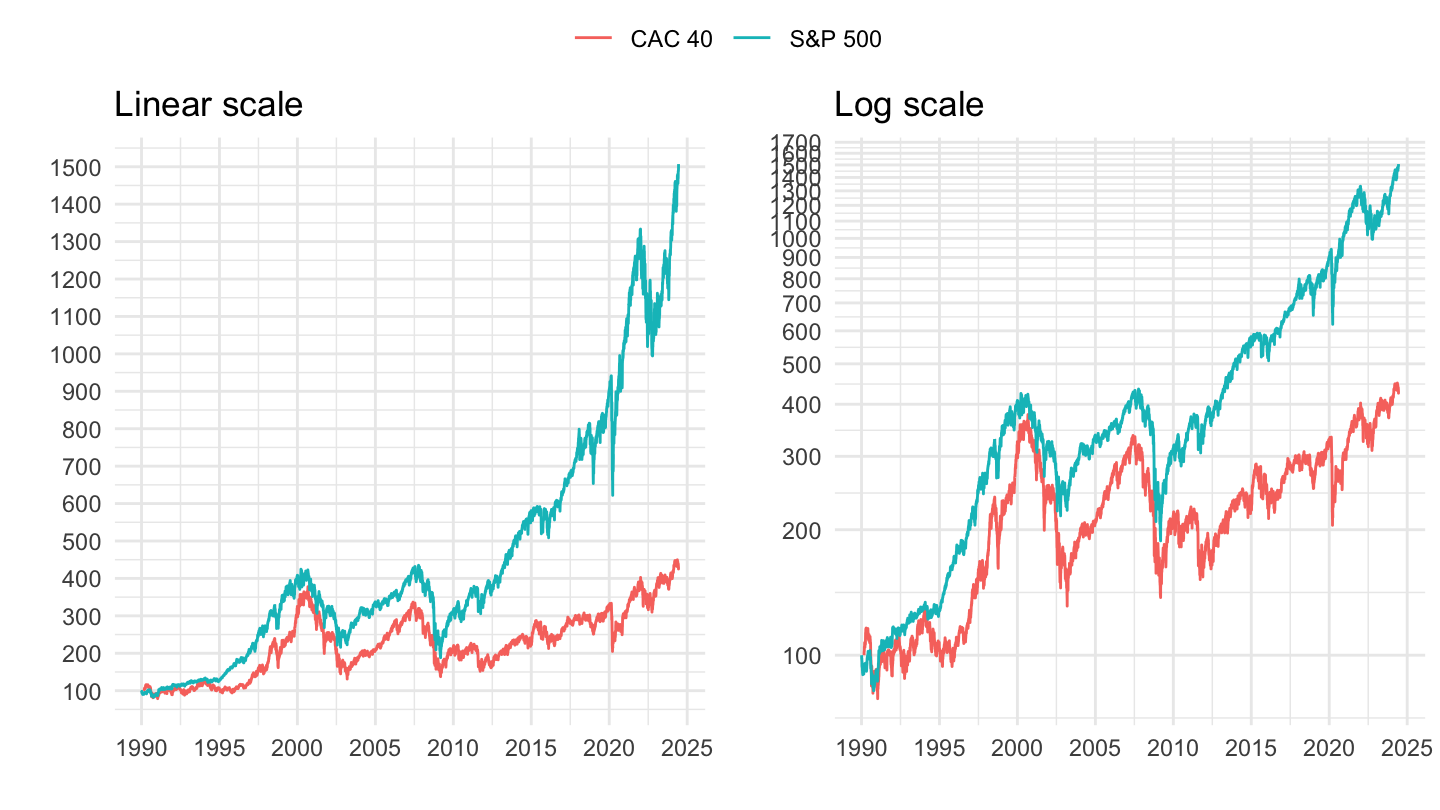
2000-
Linear
Code
plot_linear <- indices %>%
  filter(symbol %in% c("^FCHI", "^GSPC")) %>%
  filter(date >= as.Date("2000-01-01")) %>%
  left_join(symbol, by = "symbol") %>%
  group_by(symbol) %>%
  arrange(date) %>%
  mutate(close = 100*close/close[1]) %>%
  ggplot() + geom_line(aes(x = date, y = close, color = Symbol)) +
  theme_minimal() + xlab("") + ylab("") +
  theme(legend.title = element_blank(),
        legend.position = c(0.5, 0.9)) +
  scale_y_continuous(breaks = seq(0, 10000, 100)) +
  scale_x_date(breaks = as.Date(paste0(seq(1945, 2100, 5), "-01-01")),
               labels = date_format("%Y"))

plot_linear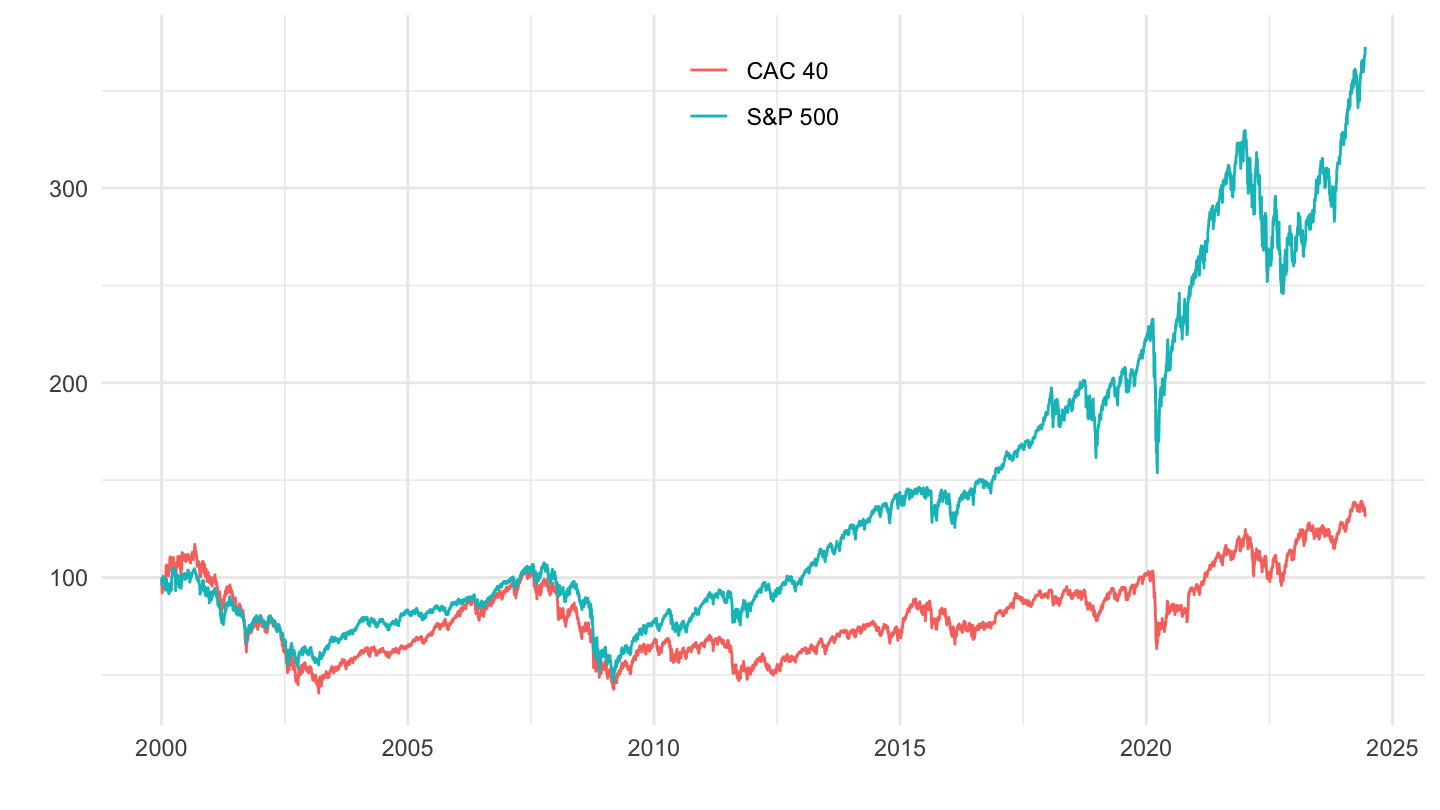
Log
Code
plot_log <- plot_linear +
  scale_y_log10(breaks = seq(0, 10000, 100))

plot_log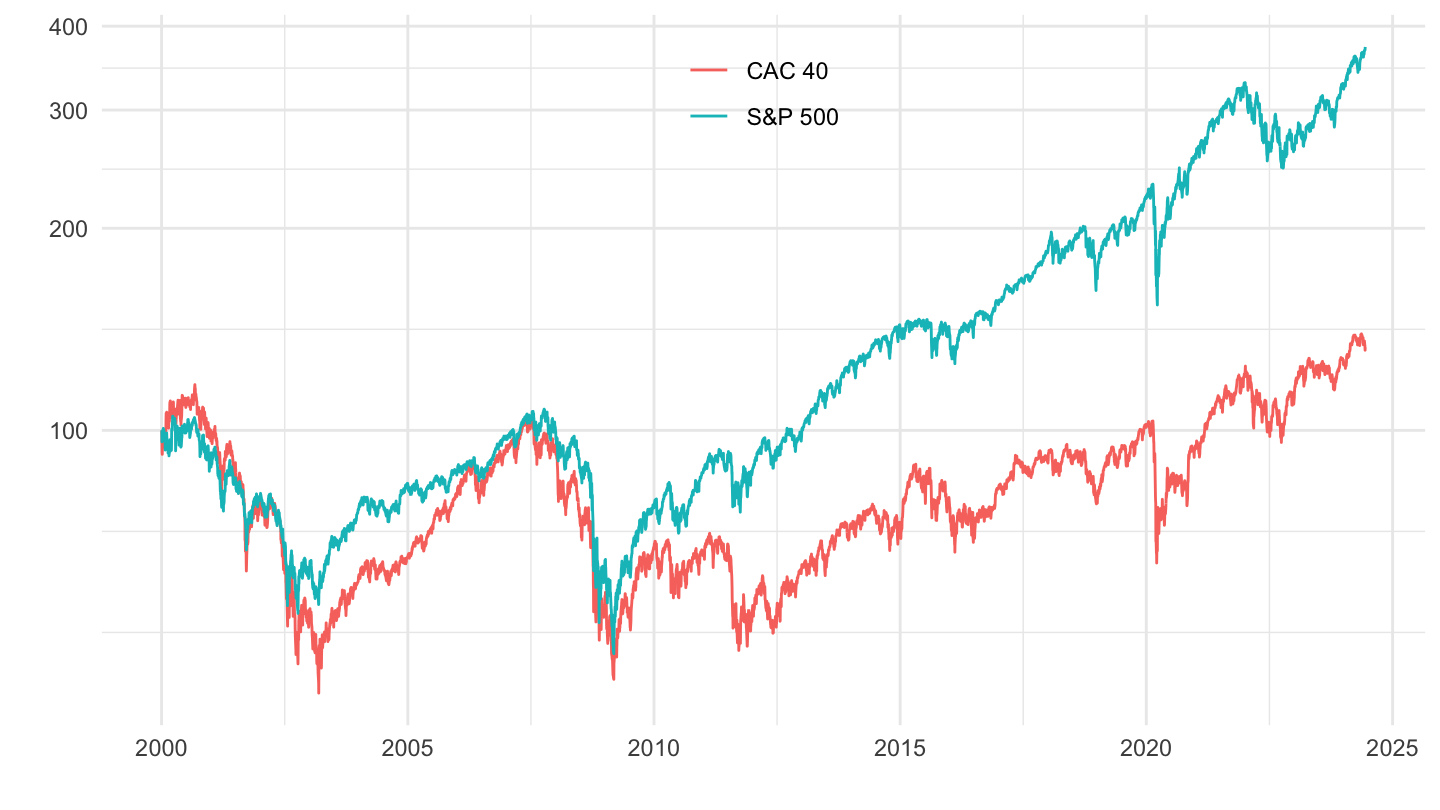
Bind
Code
ggpubr::ggarrange(plot_linear + ggtitle("Linear scale"), plot_log + ggtitle("Log scale"), common.legend = T)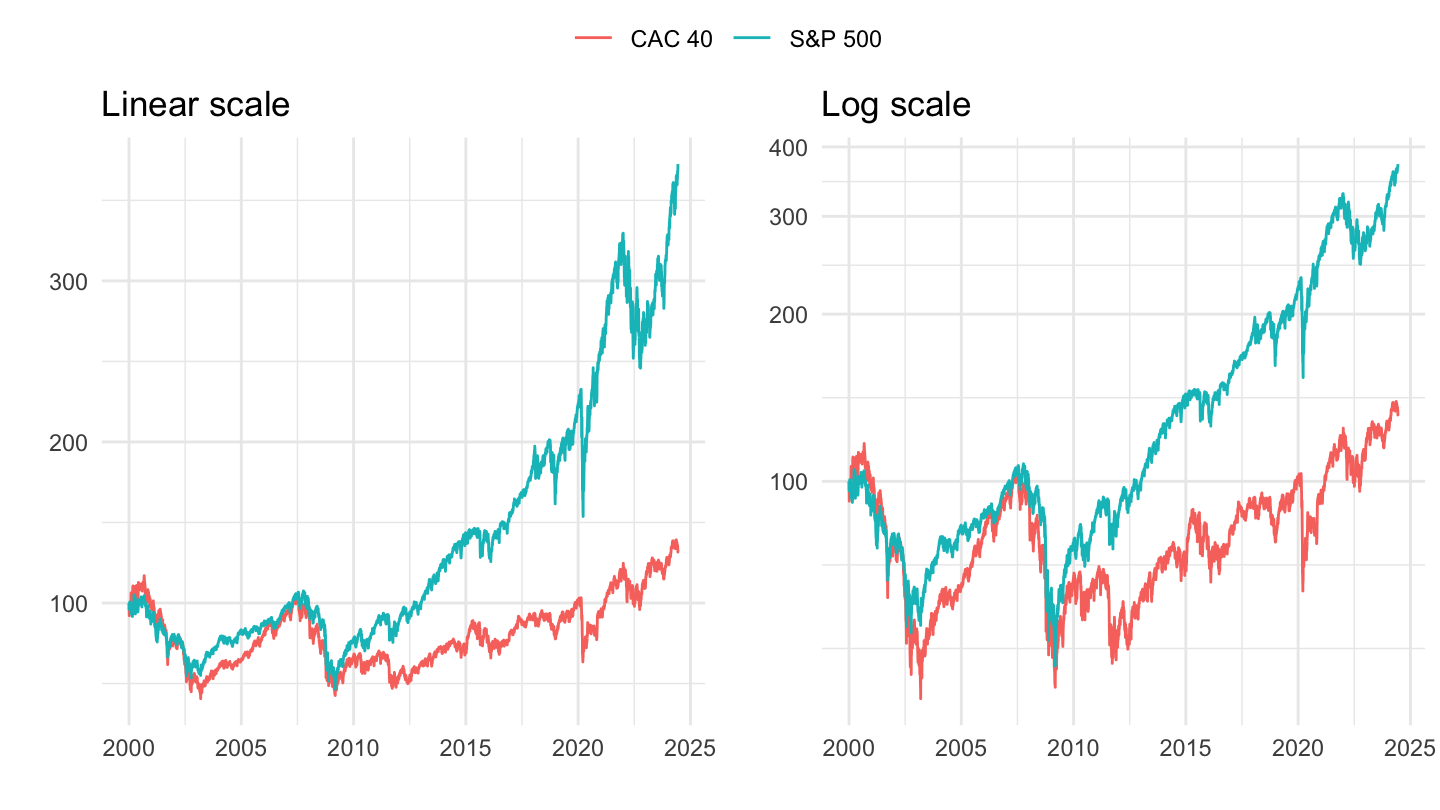
2010-
Linear
Code
plot_linear <- indices %>%
  filter(symbol %in% c("^FCHI", "^GSPC")) %>%
  filter(date >= as.Date("2010-01-01")) %>%
  left_join(symbol, by = "symbol") %>%
  group_by(symbol) %>%
  arrange(date) %>%
  mutate(close = 100*close/close[1]) %>%
  ggplot() + geom_line(aes(x = date, y = close, color = Symbol)) +
  theme_minimal() + xlab("") + ylab("") +
  theme(legend.title = element_blank(),
        legend.position = c(0.5, 0.9)) +
  scale_y_continuous(breaks = seq(0, 10000, 100)) +
  scale_x_date(breaks = as.Date(paste0(seq(1940, 2100, 2), "-01-01")),
               labels = date_format("%Y"))

plot_linear
Log
Code
plot_log <- plot_linear +
  scale_y_log10(breaks = seq(0, 10000, 100))

plot_log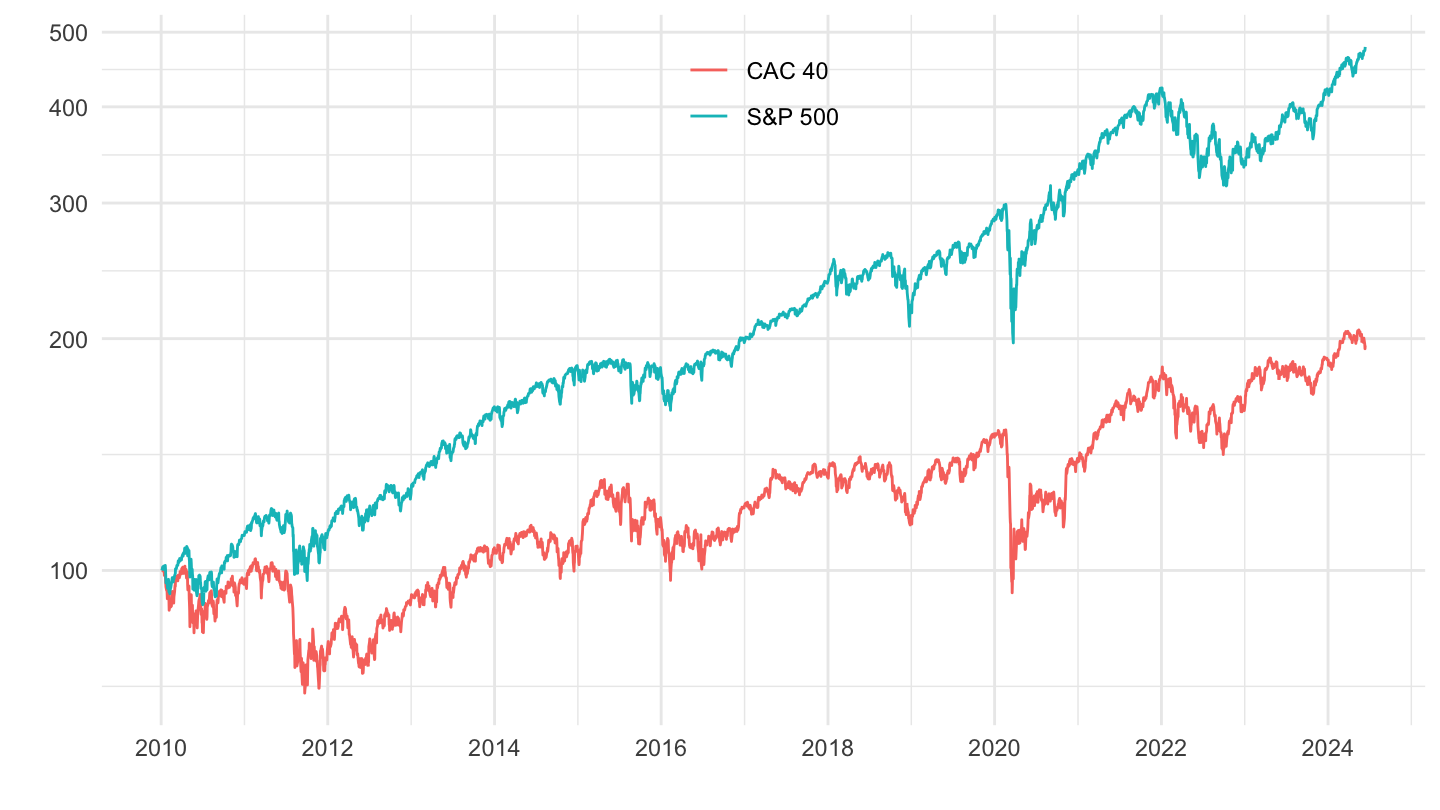
Bind
Code
ggpubr::ggarrange(plot_linear + ggtitle("Linear scale"), plot_log + ggtitle("Log scale"), common.legend = T)
^NKNR.OS (Nikkei Average Net Total Return)
1995-
Linear
Code
plot_linear <- indices %>%
  filter(symbol %in% c("^NKNR.OS")) %>%
  left_join(symbol, by = "symbol") %>%
  group_by(symbol) %>%
  arrange(date) %>%
  mutate(close = 100*close/close[1]) %>%
  ggplot() + geom_line(aes(x = date, y = close, color = Symbol)) +
  theme_minimal() + xlab("") + ylab("") +
  theme(legend.title = element_blank(),
        legend.position = c(0.5, 0.9)) +
  scale_y_continuous(breaks = seq(0, 10000, 100)) +
  scale_x_date(breaks = as.Date(paste0(seq(1945, 2100, 5), "-01-01")),
               labels = date_format("%Y"))

plot_linear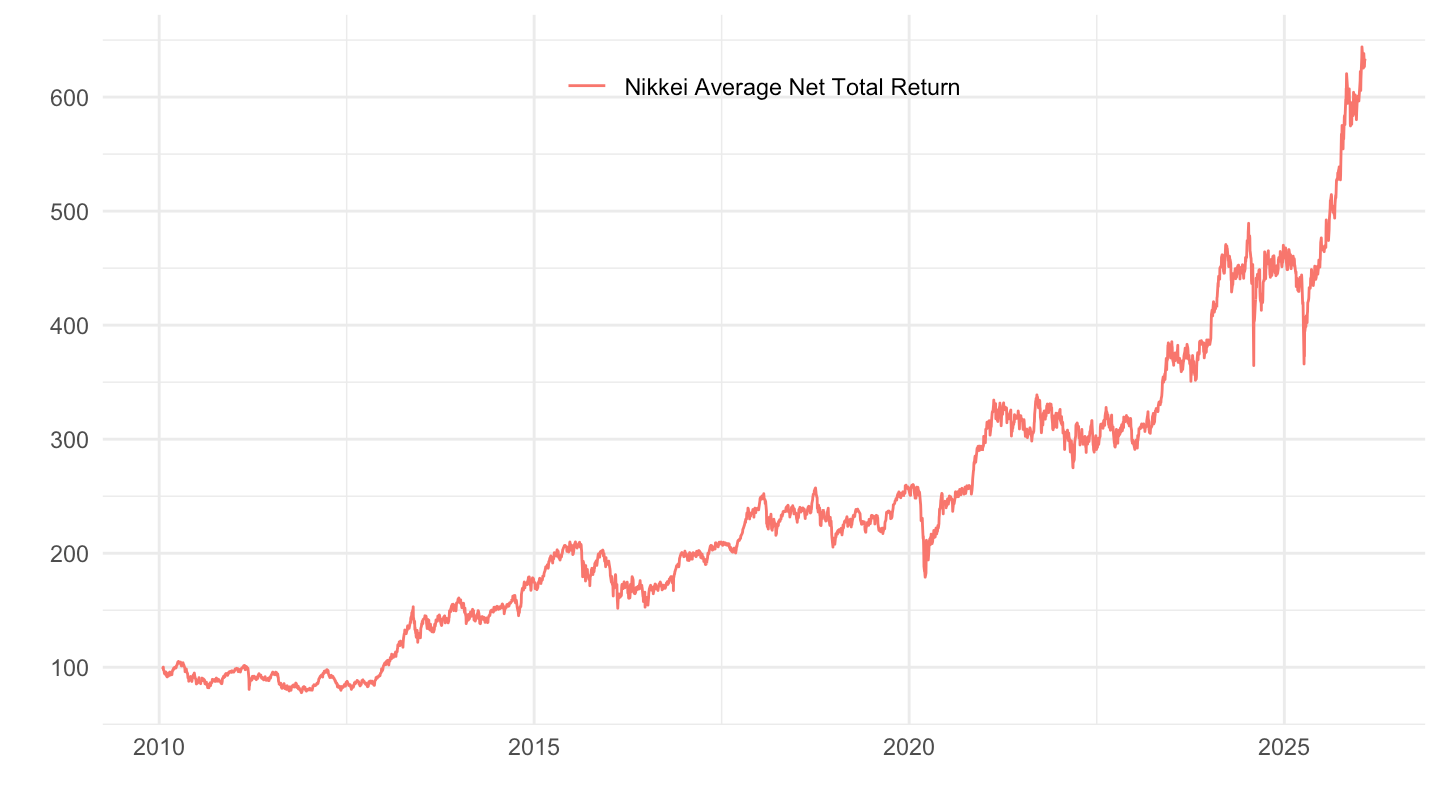
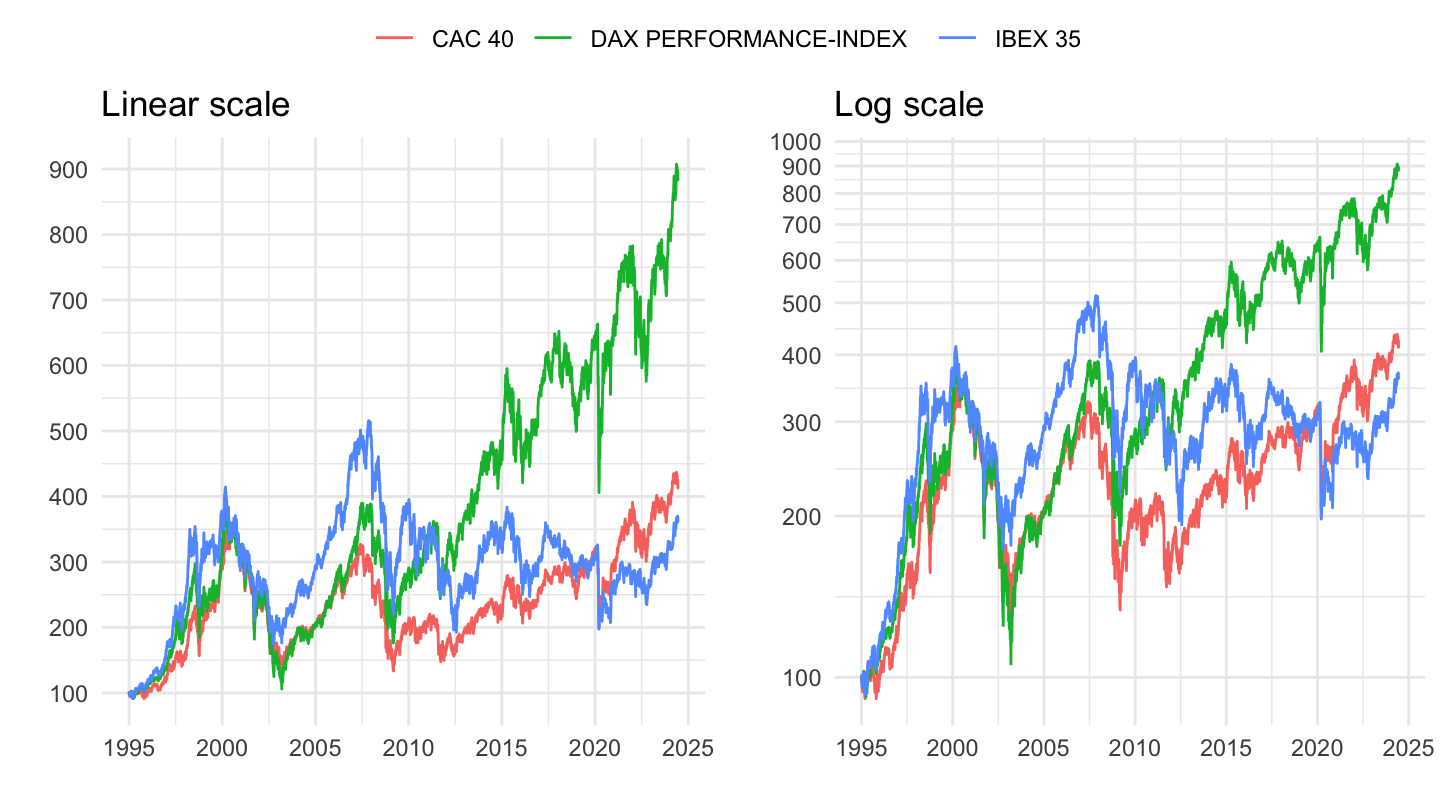
Nasdaq, S&P 500, Euro Stoxx
1995-
Linear
Code
plot_linear <- indices %>%
  filter(symbol %in% c("^GDAXI", "^IBEX", "^FCHI")) %>%
  filter(date >= as.Date("1995-01-01")) %>%
  left_join(symbol, by = "symbol") %>%
  group_by(symbol) %>%
  arrange(date) %>%
  mutate(close = 100*close/close[1]) %>%
  ggplot() + geom_line(aes(x = date, y = close, color = Symbol)) +
  theme_minimal() + xlab("") + ylab("") +
  theme(legend.title = element_blank(),
        legend.position = c(0.5, 0.9)) +
  scale_y_continuous(breaks = seq(0, 10000, 100)) +
  scale_x_date(breaks = as.Date(paste0(seq(1945, 2100, 5), "-01-01")),
               labels = date_format("%Y"))

plot_linear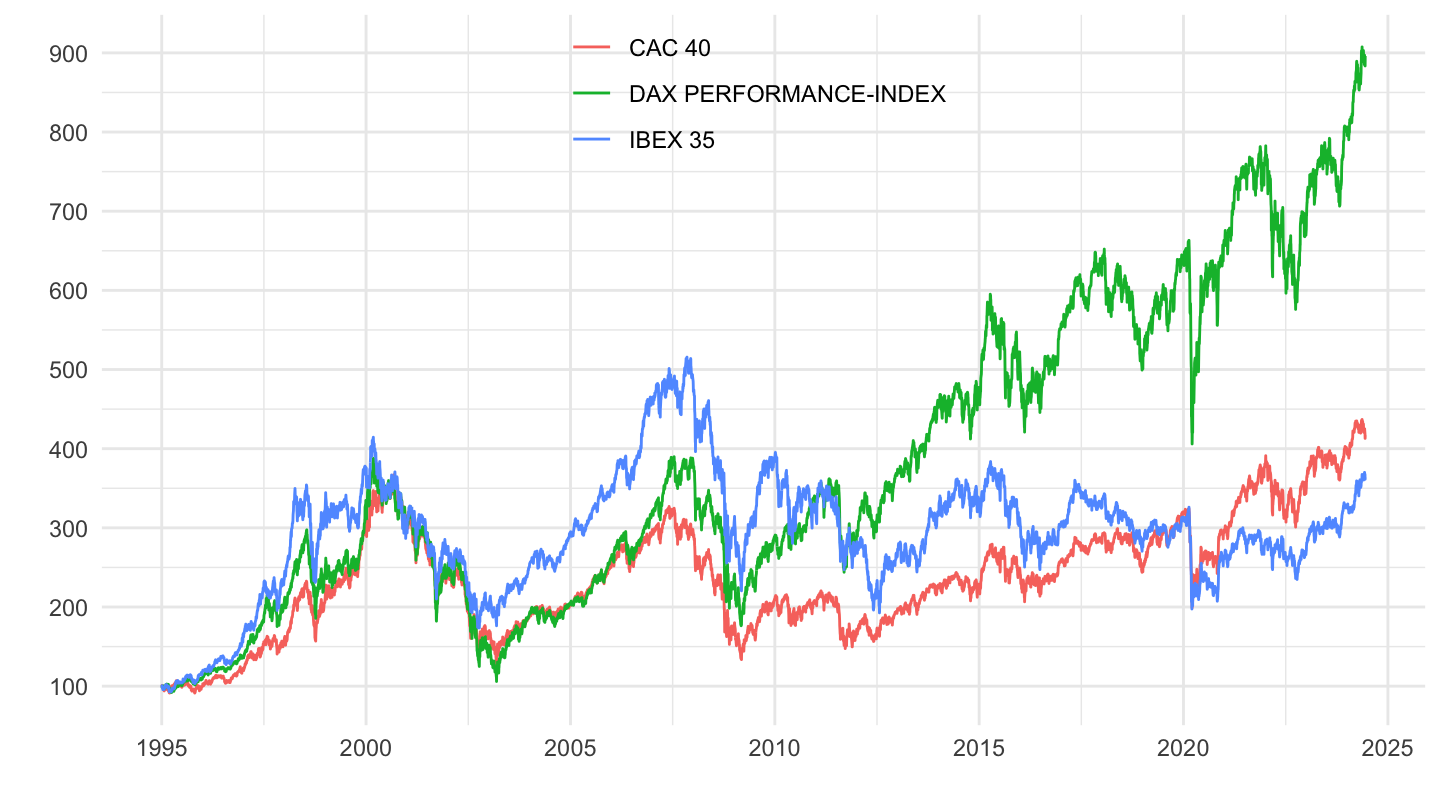
Log
Code
plot_log <- plot_linear +
  scale_y_log10(breaks = seq(0, 10000, 100))

plot_log
Bind
Code
ggpubr::ggarrange(plot_linear + ggtitle("Linear scale"), plot_log + ggtitle("Log scale"), common.legend = T)