| source | dataset | Title | .html | .rData |
|---|---|---|---|---|
| yahoo | commodities | Commodities | 2026-07-24 | 2026-07-24 |
Commodities
Data - Yahoo
Info
LAST_COMPILE
| LAST_COMPILE |
|---|
| 2026-07-25 |
Last
| date | Nobs |
|---|---|
| 2026-07-25 | 2 |
symbol
| symbol | Symbol | Nobs |
|---|---|---|
| BTC-EUR | Bitcoin EUR | 4330 |
| BTC-USD | Bitcoin USD Price | 4330 |
| CL=F | Crude Oil Futures | 6507 |
| GC=F | Gold futures | 6498 |
Bitcoin price
Linear
All
Code
commodities %>%
  filter(symbol %in% c("BTC-EUR", "BTC-USD")) %>%
  left_join(symbol, by = "symbol") %>%
  ggplot() + geom_line(aes(x = date, y = close, color = Symbol)) + theme_minimal() +
  theme(legend.title = element_blank(),
        legend.position = c(0.5, 0.9)) +
  scale_y_continuous(breaks = seq(0, 200000, 5000),
                     labels = dollar_format(pre = "")) +
  scale_x_date(breaks = as.Date(paste0(seq(1945, 2100, 1), "-01-01")),
               labels = date_format("%Y")) +
  xlab("") + ylab("Bitcoin")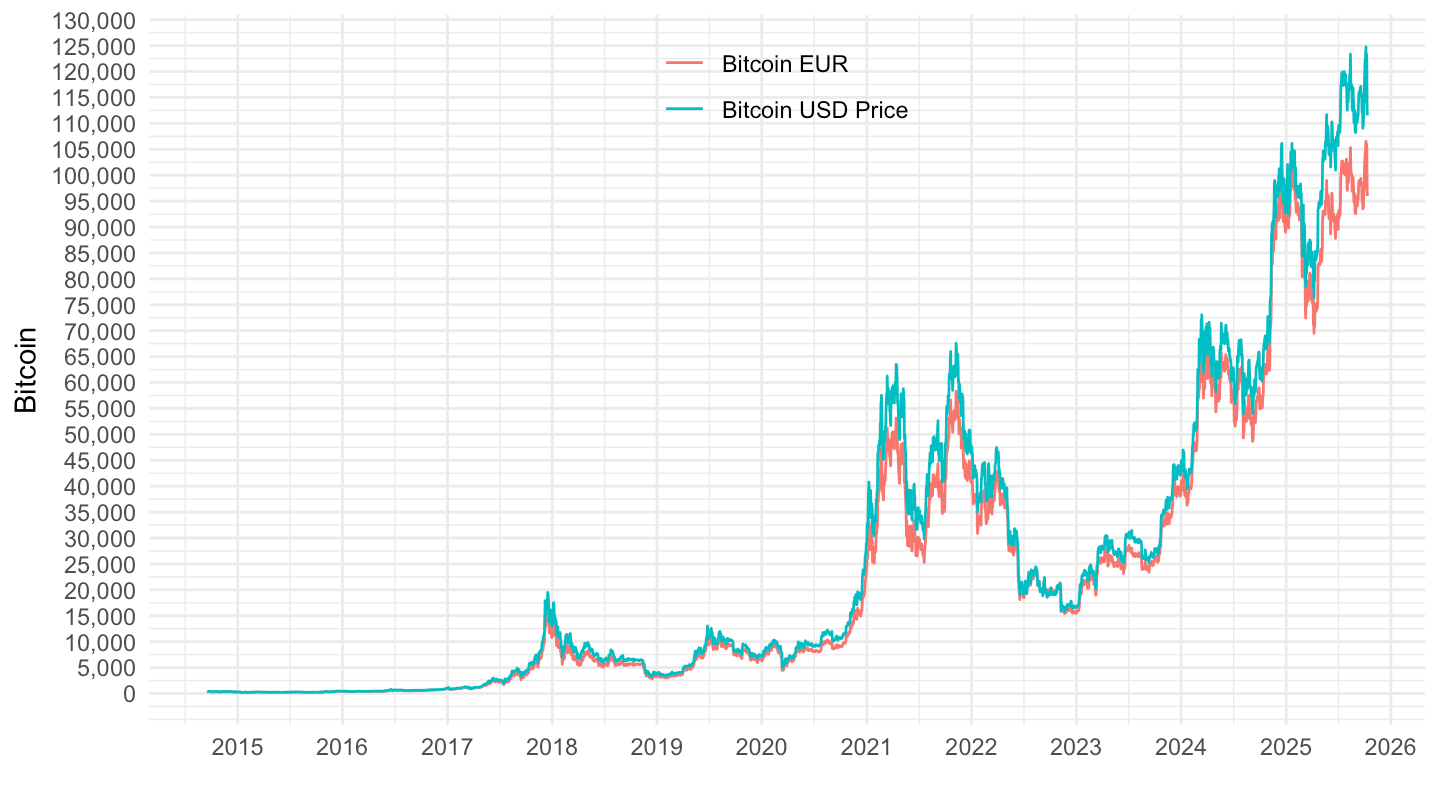
2021-
Code
commodities %>%
  filter(symbol %in% c("BTC-EUR", "BTC-USD"),
         date >= as.Date("2021-01-01")) %>%
  left_join(symbol, by = "symbol") %>%
  ggplot() + geom_line(aes(x = date, y = close, color = Symbol)) + theme_minimal() +
  theme(legend.title = element_blank(),
        legend.position = c(0.5, 0.9)) +
  scale_y_continuous(breaks = seq(0, 200000, 5000),
                     labels = dollar_format(pre = "")) +
  scale_x_date(breaks = as.Date(paste0(seq(1945, 2100, 1), "-01-01")),
               labels = date_format("%Y")) +
  xlab("") + ylab("")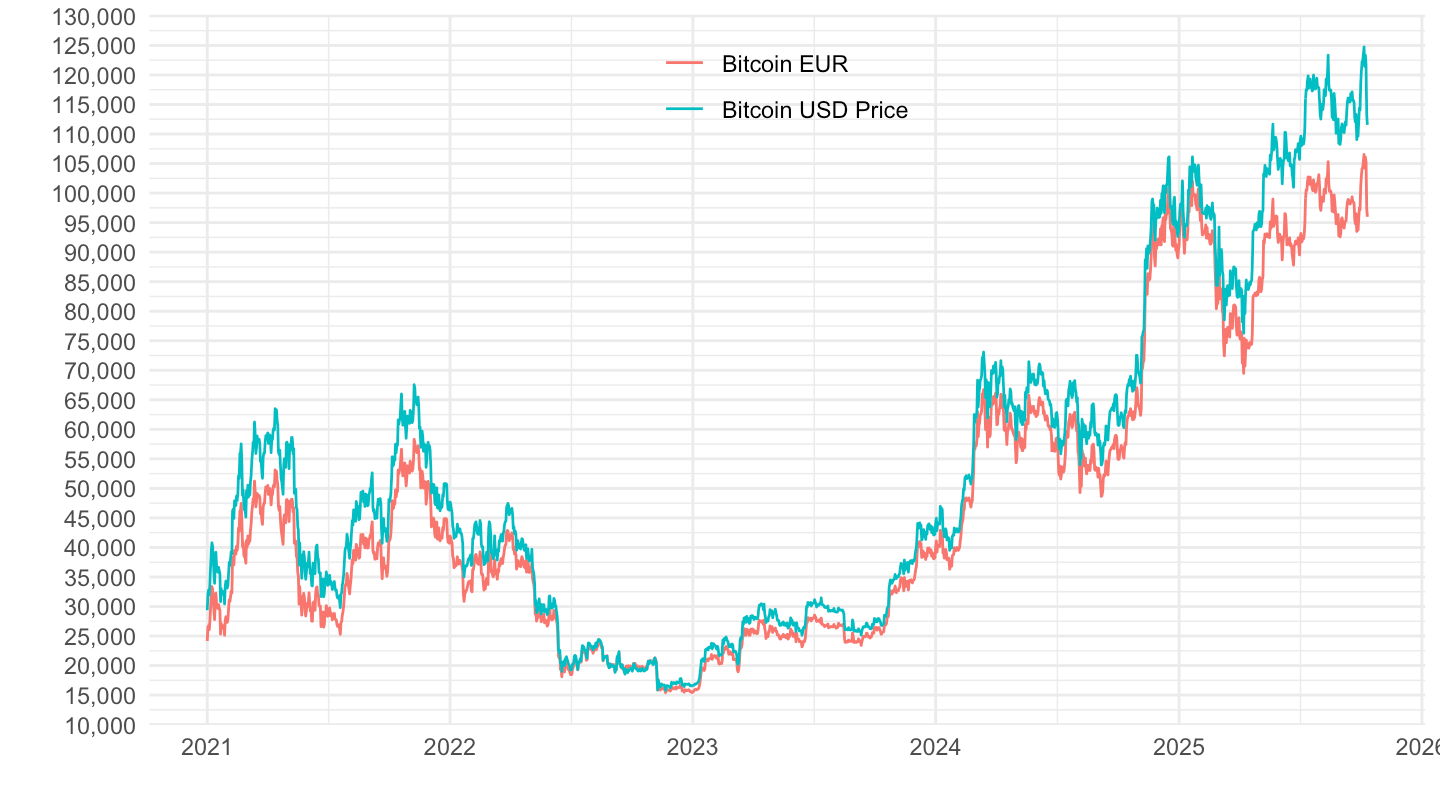
Log
All
Code
commodities %>%
  filter(symbol %in% c("BTC-EUR", "BTC-USD")) %>%
  left_join(symbol, by = "symbol") %>%
  ggplot() + geom_line(aes(x = date, y = close, color = Symbol)) + theme_minimal() +
  theme(legend.title = element_blank(),
        legend.position = c(0.2, 0.9)) +
  scale_y_log10(breaks = 100*c(1, 2, 3, 5, 8, 10, 20, 50, 100, 200, 500, 1000),
                     labels = dollar_format(pre = "", acc = 1)) +
  scale_x_date(breaks = as.Date(paste0(seq(1945, 2100, 1), "-01-01")),
               labels = date_format("%Y")) +
  xlab("") + ylab("Bitcoin in Euro")
2021-
Code
commodities %>%
  filter(symbol %in% c("BTC-EUR", "BTC-USD"),
         date >= as.Date("2021-01-01")) %>%
  left_join(symbol, by = "symbol") %>%
  ggplot() + geom_line(aes(x = date, y = close, color = Symbol)) + theme_minimal() +
  theme(legend.title = element_blank(),
        legend.position = c(0.5, 0.9)) +
  scale_y_log10(breaks = 10000*c(1, 2, 3, 4, 5, 8, 10, 20, 50, 100, 200, 500),
                     labels = dollar_format(pre = "", acc = 1)) +
  scale_x_date(breaks = as.Date(paste0(seq(1945, 2100, 1), "-01-01")),
               labels = date_format("%Y")) +
  xlab("") + ylab("")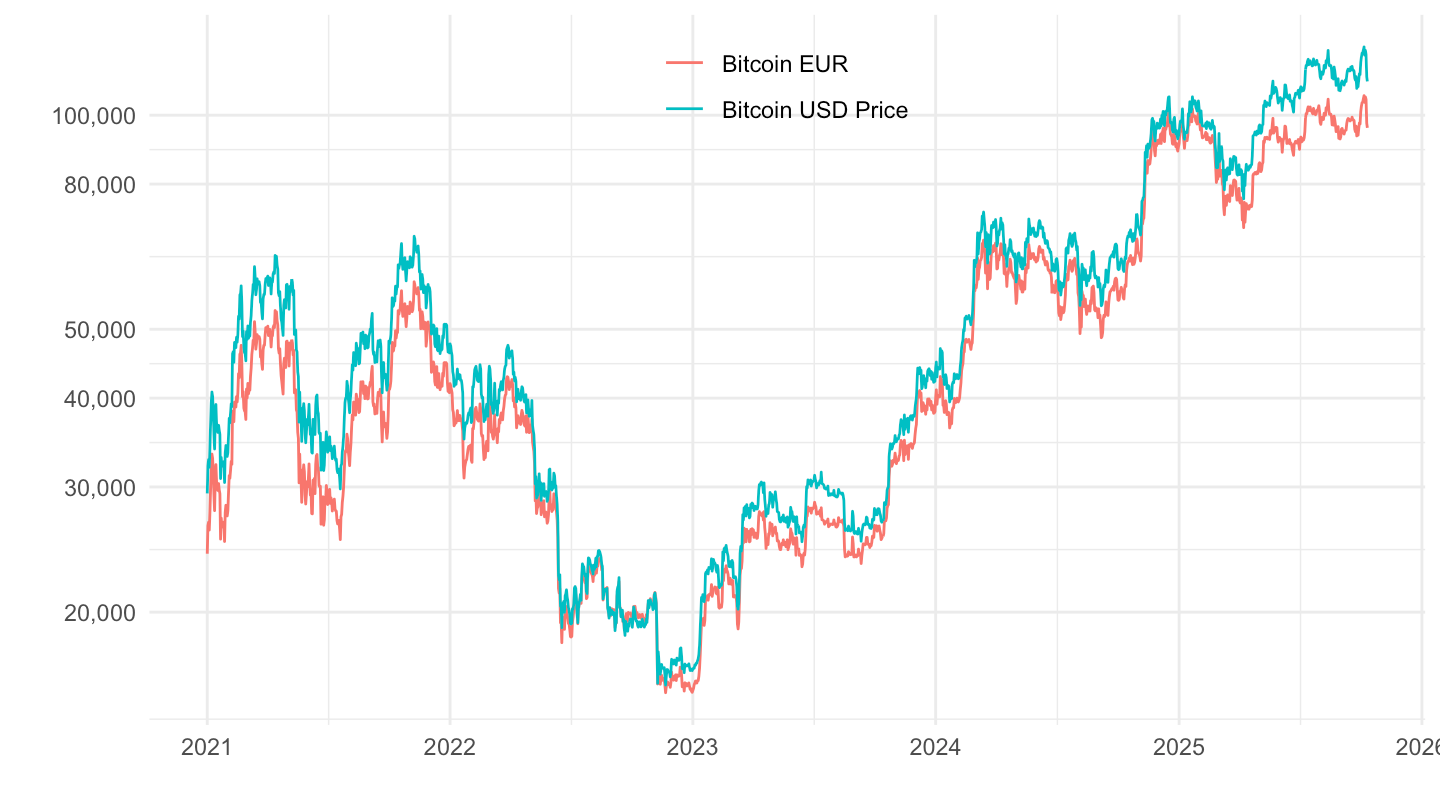
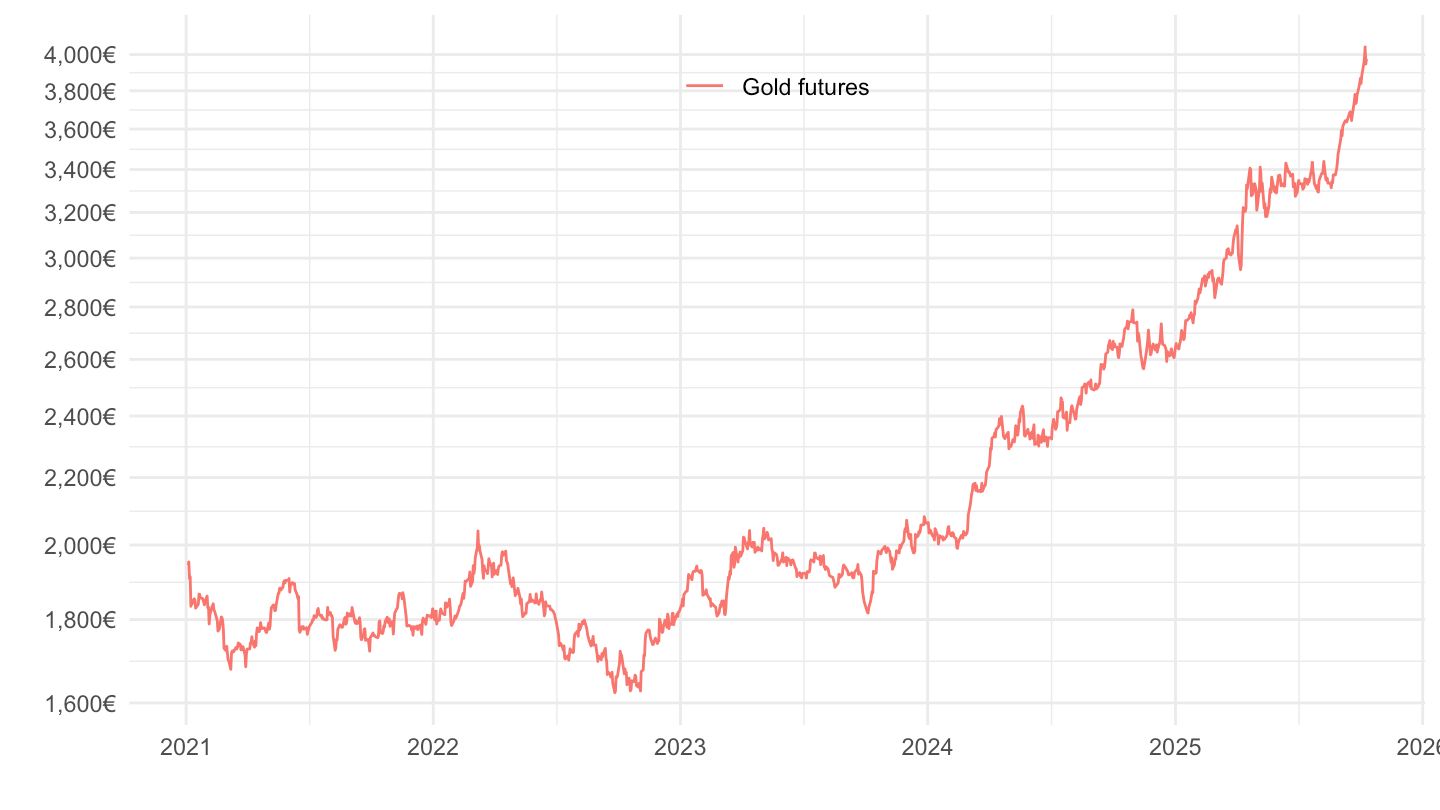
Gold price
Linear
All
Code
commodities %>%
  filter(symbol %in% c("GC=F")) %>%
  left_join(symbol, by = "symbol") %>%
  ggplot() + geom_line(aes(x = date, y = close, color = Symbol)) + theme_minimal() +
  theme(legend.title = element_blank(),
        legend.position = c(0.5, 0.9)) +
  scale_y_continuous(breaks = seq(0, 100000, 200),
                     labels = dollar_format(pre = "", su = "€")) +
  scale_x_date(breaks = as.Date(paste0(seq(1960, 2100, 2), "-01-01")),
               labels = date_format("%Y")) +
  xlab("") + ylab("Bitcoin")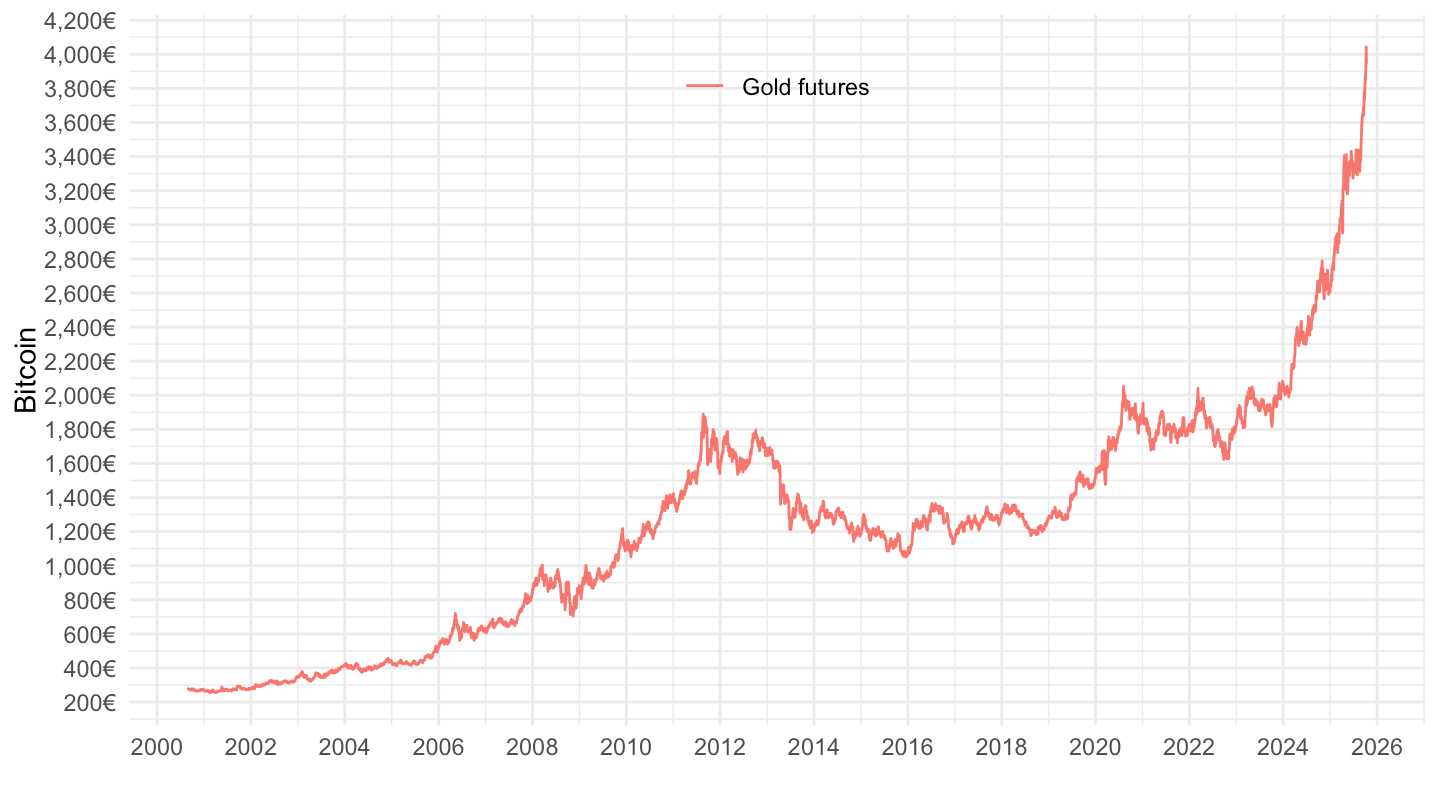
2021-
Code
commodities %>%
  filter(symbol %in% c("GC=F"),
         date >= as.Date("2021-01-01")) %>%
  left_join(symbol, by = "symbol") %>%
  ggplot() + geom_line(aes(x = date, y = close, color = Symbol)) + theme_minimal() +
  theme(legend.title = element_blank(),
        legend.position = c(0.5, 0.9)) +
  scale_y_continuous(breaks = seq(0, 10000, 200),
                     labels = dollar_format(pre = "", su = "€")) +
  scale_x_date(breaks = as.Date(paste0(seq(1945, 2100, 1), "-01-01")),
               labels = date_format("%Y")) +
  xlab("") + ylab("Price per Megawatt-Hour")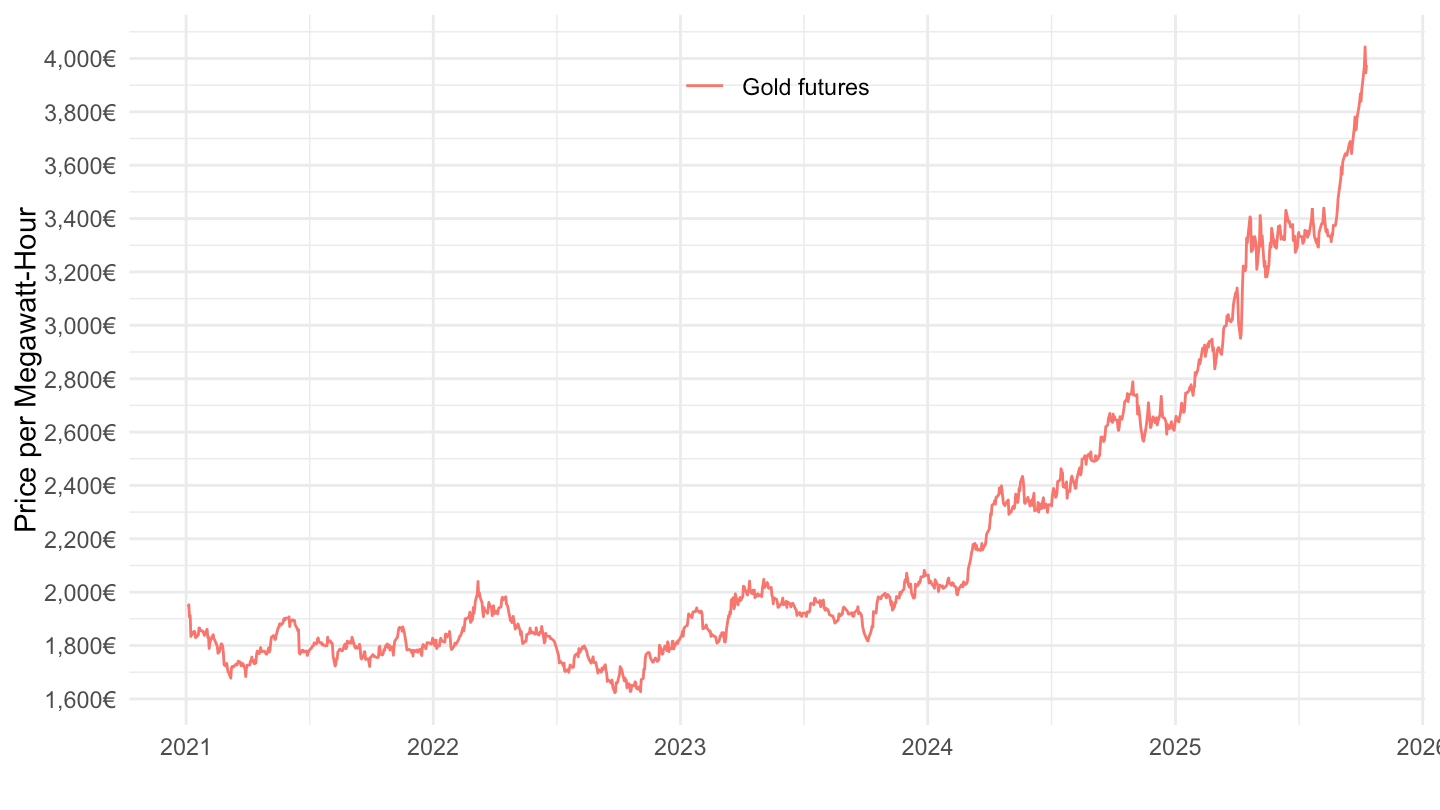
Log
All
Code
commodities %>%
  filter(symbol %in% c("GC=F")) %>%
  left_join(symbol, by = "symbol") %>%
  ggplot() + geom_line(aes(x = date, y = close, color = Symbol)) + theme_minimal() +
  theme(legend.title = element_blank(),
        legend.position = c(0.2, 0.9)) +
  scale_y_log10(breaks = 100*c(1, 2, 3, 5, 8, 10, 15, 20, 25, 50, 100, 200, 500),
                     labels = dollar_format(pre = "", su = "€", acc = 1)) +
  scale_x_date(breaks = as.Date(paste0(seq(1945, 2100, 5), "-01-01")),
               labels = date_format("%Y")) +
  xlab("") + ylab("Bitcoin in Euro")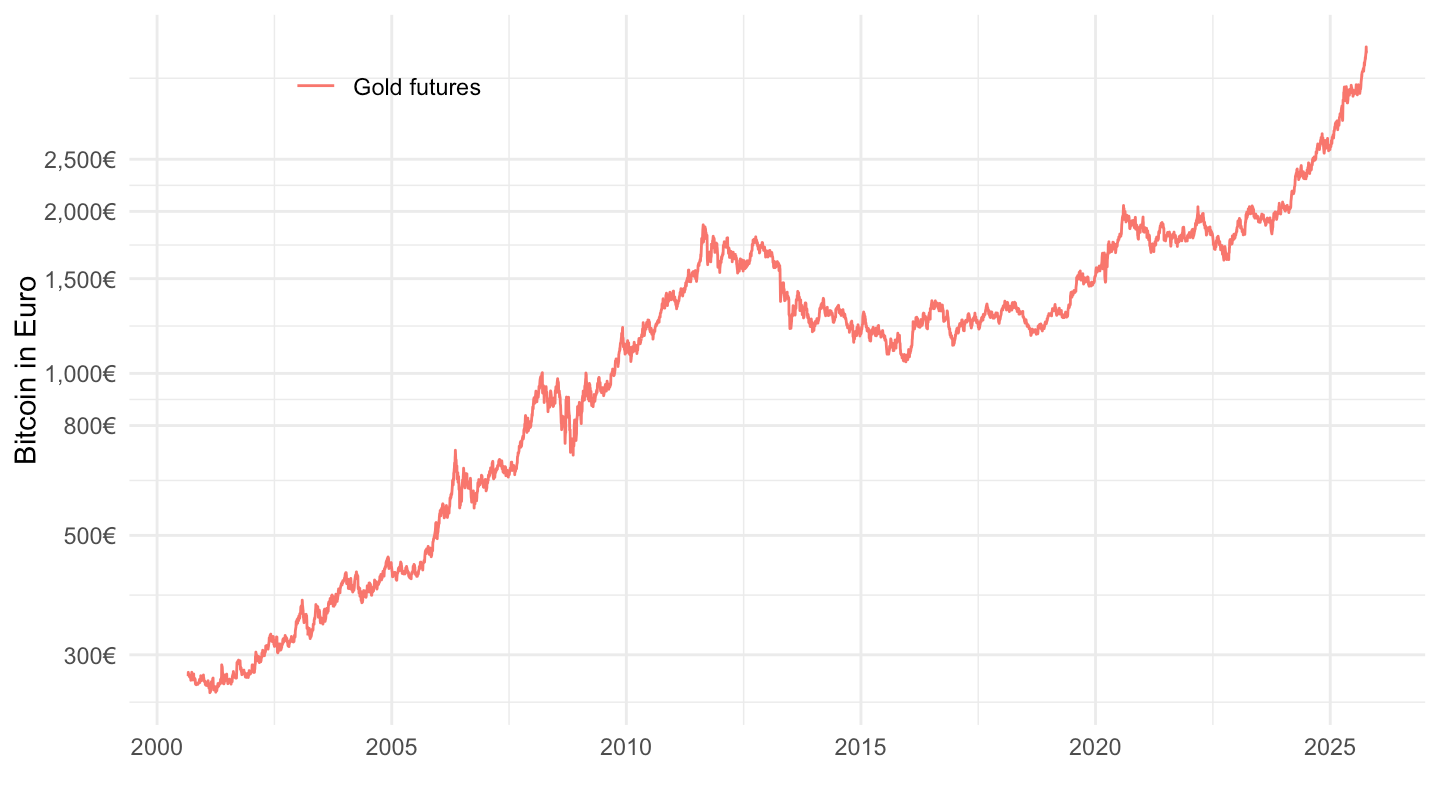
2021-
Code
commodities %>%
  filter(symbol %in% c("GC=F"),
         date >= as.Date("2021-01-01")) %>%
  left_join(symbol, by = "symbol") %>%
  ggplot() + geom_line(aes(x = date, y = close, color = Symbol)) + theme_minimal() +
  theme(legend.title = element_blank(),
        legend.position = c(0.5, 0.9)) +
  scale_y_log10(breaks = seq(200, 4000, 200),
                     labels = dollar_format(pre = "", su = "€", acc = 1)) +
  scale_x_date(breaks = as.Date(paste0(seq(1945, 2100, 1), "-01-01")),
               labels = date_format("%Y")) +
  xlab("") + ylab("")