S&P 500
Data - Yahoo
Info
LAST_COMPILE
| LAST_COMPILE |
|---|
| 2026-07-26 |
Last
| date | Nobs |
|---|---|
| 2026-03-31 | 501 |
symbol
Components
1990-
Linear
Code
library(dplyr)
library(ggplot2)
library(scales)
library(ggrepel)

tickers <- c("META","TSLA","NVDA","AMZN","GOOG","MSFT","AAPL")

sp <- SP500 %>%
  filter(symbol %in% tickers, date >= as.Date("1990-01-01")) %>%
  arrange(symbol, date) %>%
  group_by(symbol) %>%
  mutate(idx = 100 * close / first(close)) %>%
  ungroup()

# grab last point of each series for nice labels on the right
last_pts <- sp %>%
  group_by(symbol) %>%
  slice_max(date, n = 1) %>%
  ungroup()

plot_linear <- ggplot(sp, aes(x = date, y = idx, color = symbol)) +
  geom_line(linewidth = 0.9) +
  #— uncomment for log scale:
  # scale_y_log10(labels = label_number(accuracy = 1)) +
  scale_x_date(date_breaks = "5 years", date_labels = "%Y",
               expand = expansion(mult = c(0.01, 0.08))) +
  scale_y_continuous(breaks = breaks_pretty(n = 8),
                     labels = label_number(accuracy = 1)) +
  labs(
    title = "Big Tech performance since 2010 (indexed = 100)",
    subtitle = "",
    x = NULL, y = NULL,
    caption = "Source: Yahoo! Finance"
  ) +
  # direct labels at the end
  geom_text_repel(
    data = last_pts,
    aes(label = symbol),
    nudge_x = 60, direction = "y", hjust = 0,
    segment.size = 0.3, segment.alpha = 0.6, min.segment.length = 0,
    box.padding = 0.2, point.padding = 0.2, seed = 42, show.legend = FALSE
  ) +
  coord_cartesian(clip = "off") +
  theme_minimal(base_size = 12) +
  theme(
    legend.position = "none",
    panel.grid.minor = element_blank(),
    panel.grid.major.x = element_line(linewidth = 0.3),
    plot.title = element_text(face = "bold"),
    plot.margin = margin(10, 40, 10, 10) # extra right margin for labels
  )

plot_linear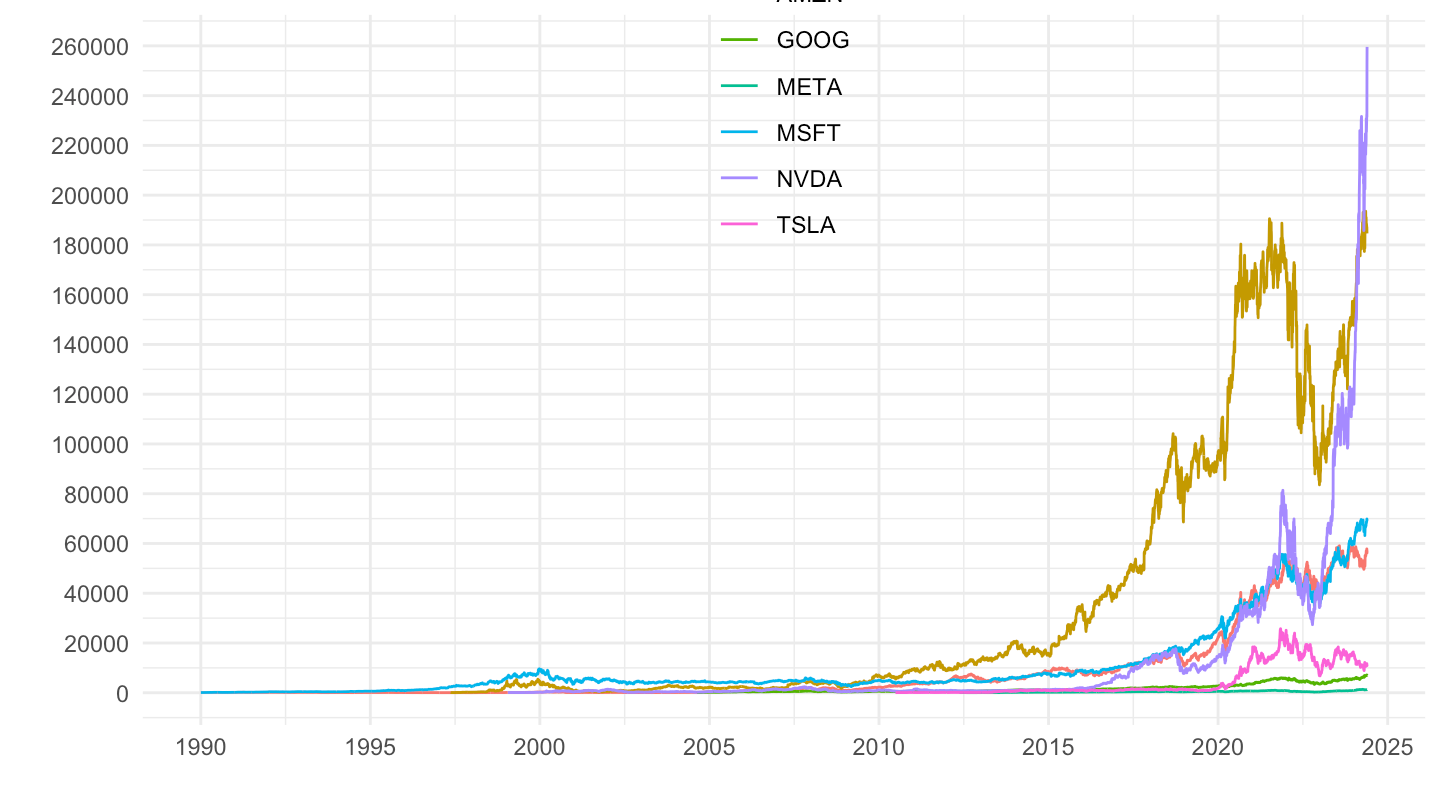
Log
Code
plot_log <- plot_linear +
  scale_y_log10(breaks = 10^seq(2, 100, 1))

plot_log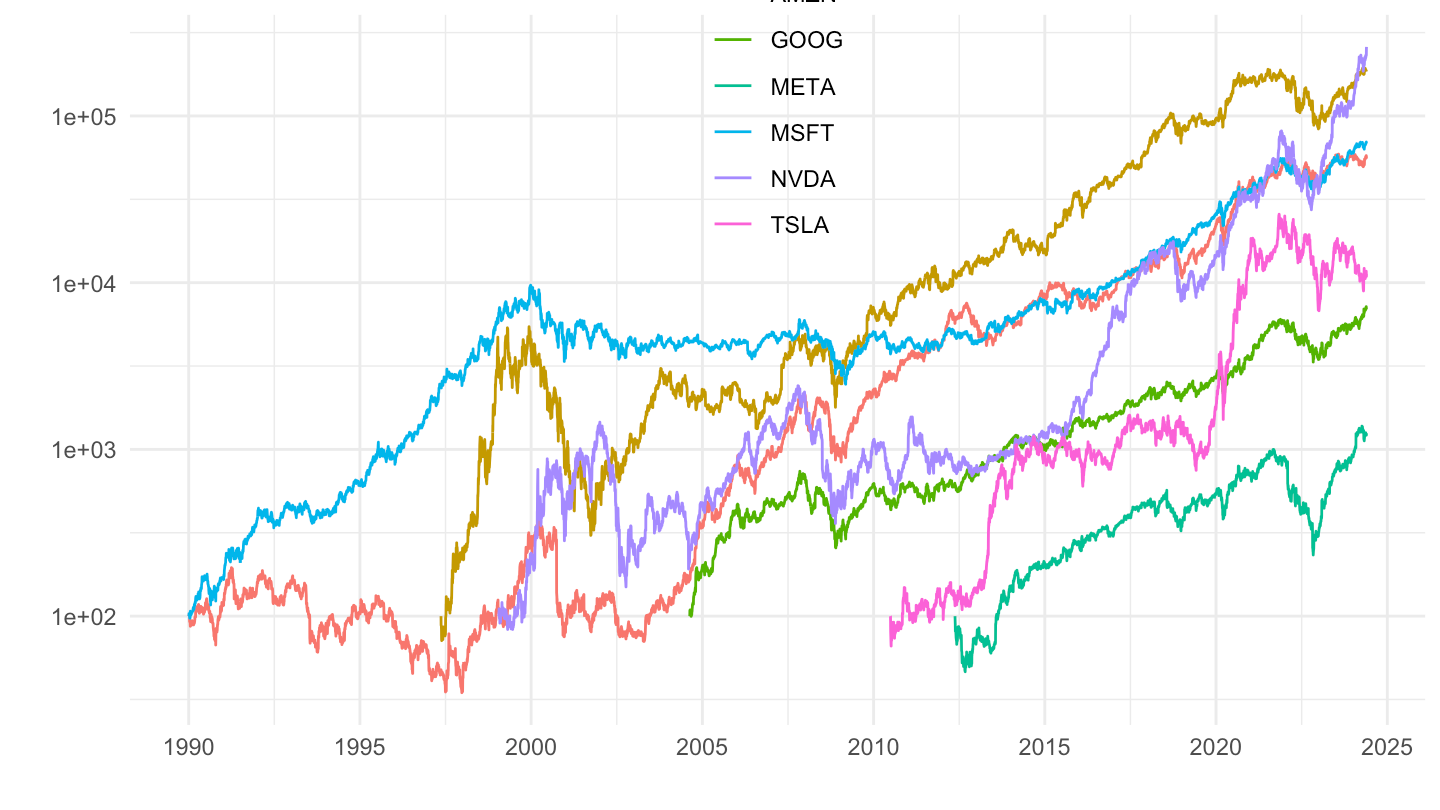
Bind
Code
ggpubr::ggarrange(plot_linear + ggtitle("Linear scale"), plot_log + ggtitle("Log scale"), common.legend = T)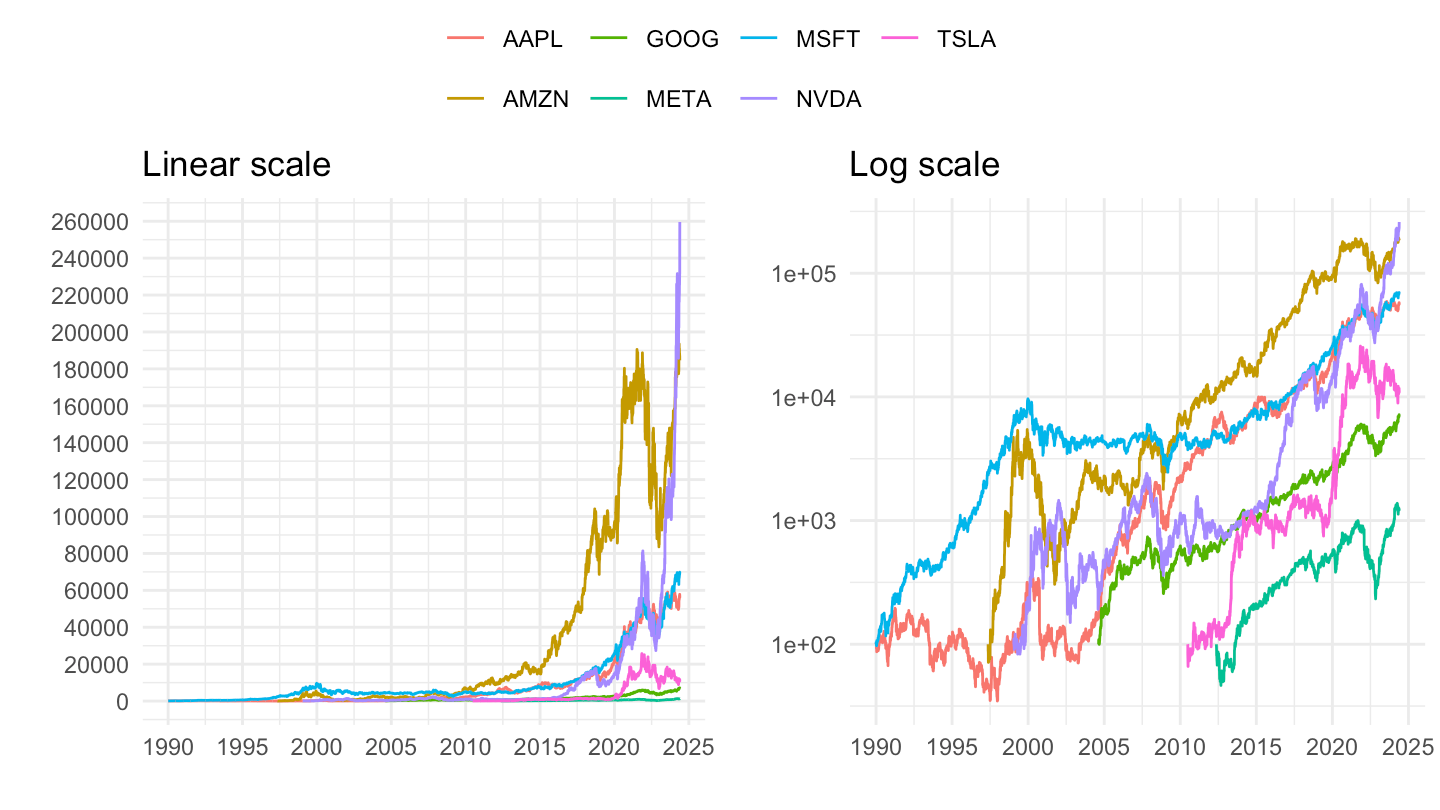
2010-
Linear
Code
library(dplyr)
library(ggplot2)
library(scales)
library(ggrepel)

tickers <- c("META","TSLA","NVDA","AMZN","GOOG","MSFT","AAPL")

sp <- SP500 %>%
  filter(symbol %in% tickers, date >= as.Date("2010-01-01")) %>%
  arrange(symbol, date) %>%
  group_by(symbol) %>%
  mutate(idx = 100 * close / first(close)) %>%
  ungroup()

# grab last point of each series for nice labels on the right
last_pts <- sp %>%
  group_by(symbol) %>%
  slice_max(date, n = 1) %>%
  ungroup()

plot_linear <- ggplot(sp, aes(x = date, y = idx, color = symbol)) +
  geom_line(linewidth = 0.9) +
  #— uncomment for log scale:
  # scale_y_log10(labels = label_number(accuracy = 1)) +
  scale_x_date(date_breaks = "2 years", date_labels = "%Y",
               expand = expansion(mult = c(0.01, 0.08))) +
  scale_y_continuous(breaks = breaks_pretty(n = 8),
                     labels = label_number(accuracy = 1)) +
  labs(
    title = "Les 7 merveilles de la Tech",
    subtitle = "",
    x = NULL, y = NULL,
    caption = "Source: Yahoo! Finance"
  ) +
  # direct labels at the end
  geom_text_repel(
    data = last_pts,
    aes(label = symbol),
    nudge_x = 60, direction = "y", hjust = 0,
    segment.size = 0.3, segment.alpha = 0.6, min.segment.length = 0,
    box.padding = 0.2, point.padding = 0.2, seed = 42, show.legend = FALSE
  ) +
  coord_cartesian(clip = "off") +
  theme_minimal(base_size = 12) +
  theme(
    legend.position = "none",
    panel.grid.minor = element_blank(),
    panel.grid.major.x = element_line(linewidth = 0.3),
    plot.title = element_text(face = "bold"),
    plot.margin = margin(10, 40, 10, 10) # extra right margin for labels
  )

plot_linear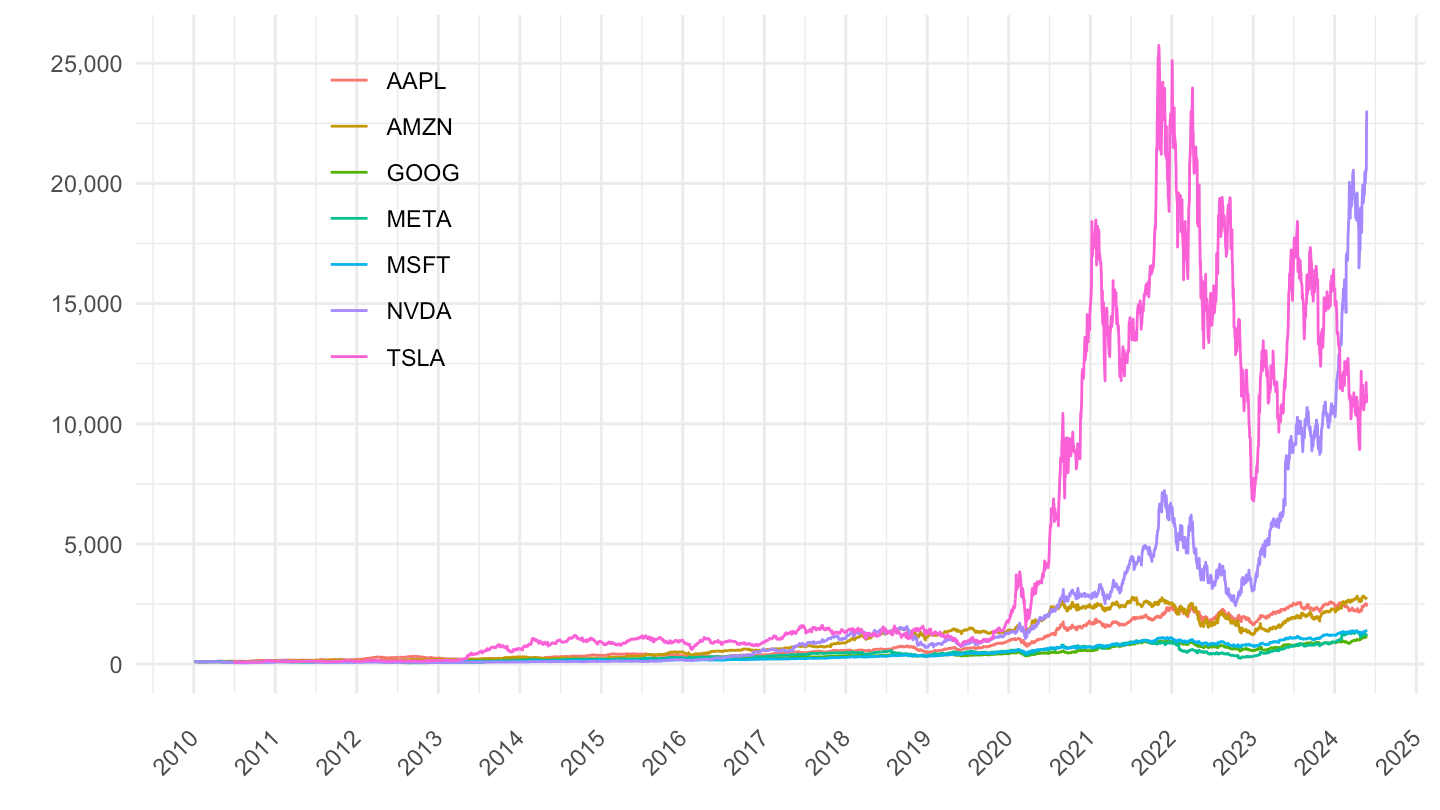
Log
Code
plot_log <- plot_linear +
  scale_y_log10(breaks = c(10^seq(1, 100, 1), 10^seq(1, 100, 1)*2, 10^seq(1, 100, 1)*5),
                     labels = dollar_format(pre = "", acc = 1))

plot_log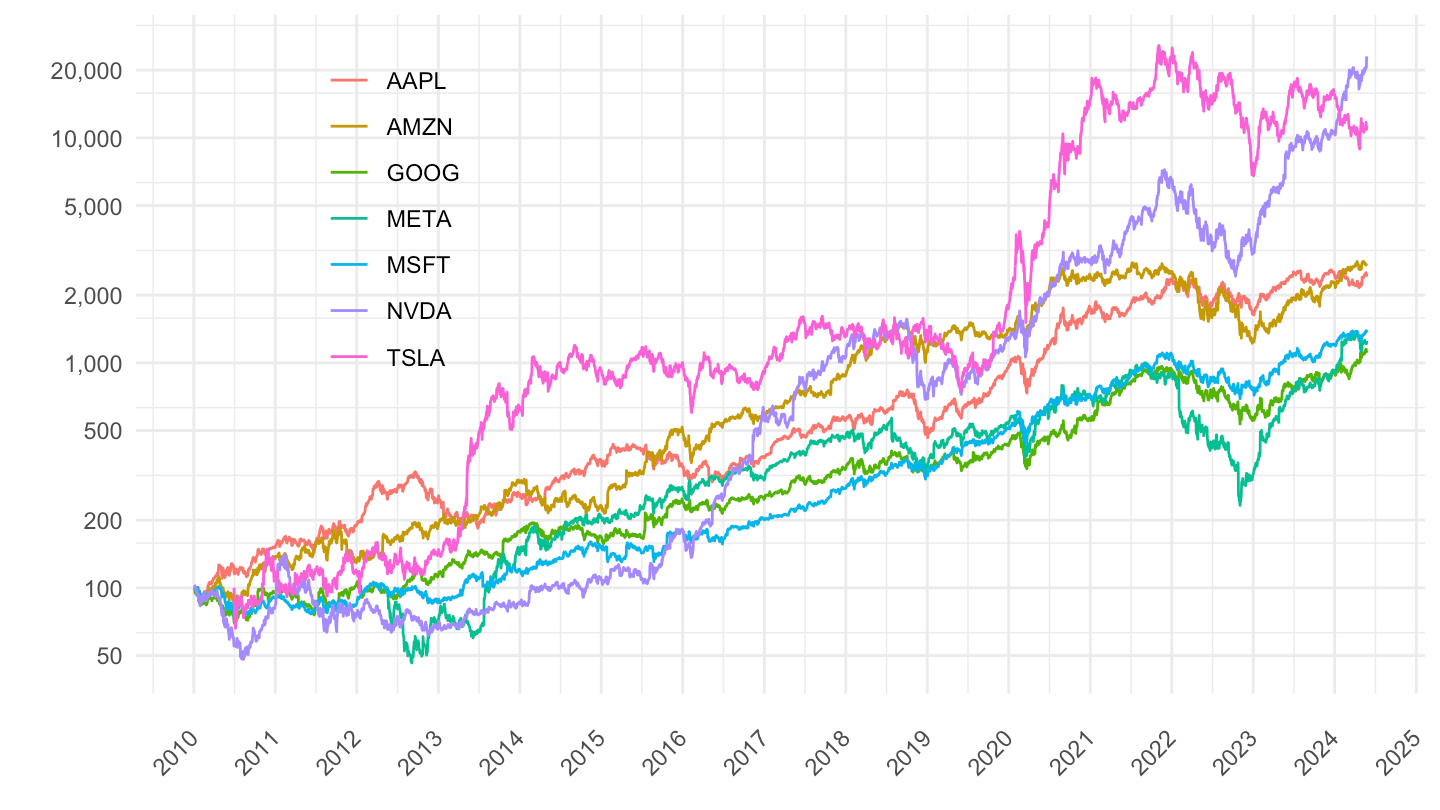
Bind
Code
ggpubr::ggarrange(plot_linear + ggtitle("Linear scale"),
                  plot_log + ggtitle("Log scale"),
                  common.legend = T)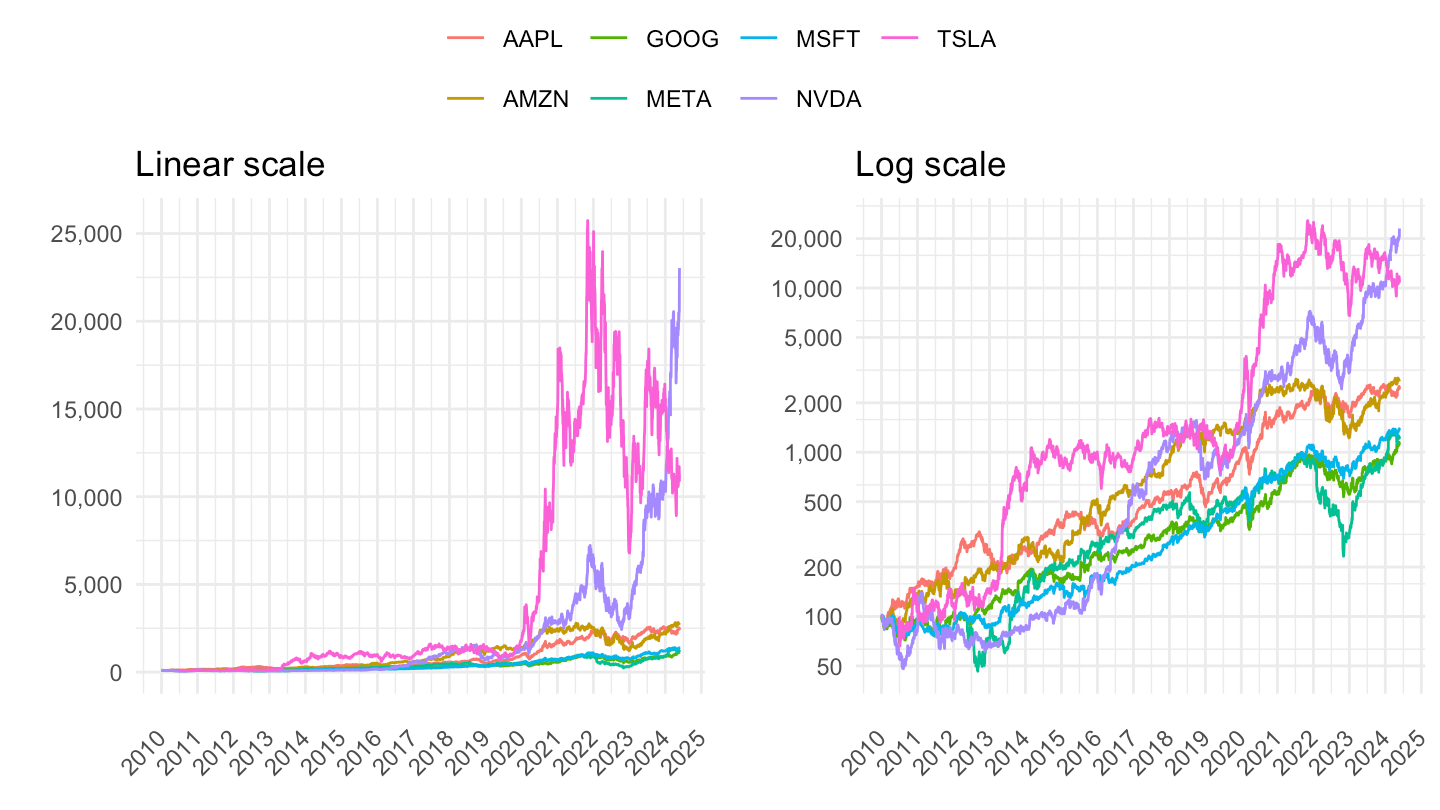
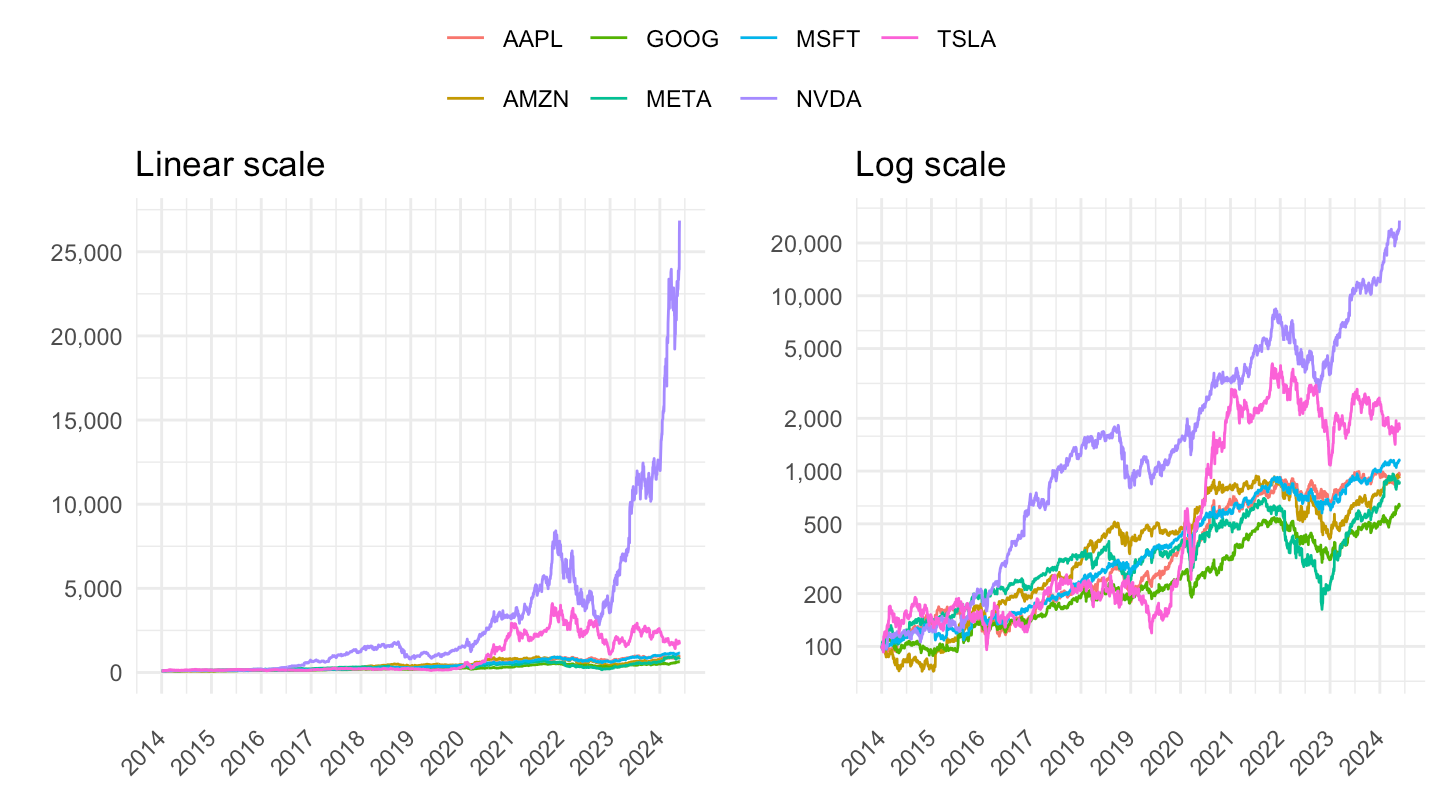
2014-
Linear
Code
plot_linear <- SP500 %>%
  filter(symbol %in% c("META", "TSLA", "NVDA", "AMZN", "GOOG", "MSFT", "AAPL")) %>%
  filter(date >= as.Date("2014-01-01")) %>%
  group_by(symbol) %>%
  arrange(date) %>%
  mutate(close = 100*close/close[1]) %>%
  ggplot() + geom_line(aes(x = date, y = close, color = Symbol)) +
  theme_minimal() + xlab("") + ylab("") +
  theme(legend.title = element_blank(),
        legend.position = c(0.2, 0.7),
        axis.text.x = element_text(angle = 45, vjust = 0.5, hjust=1)) +
  scale_y_continuous(breaks = seq(0, 1000000, 5000),
                     labels = dollar_format(pre = "", acc = 1)) +
  scale_x_date(breaks = as.Date(paste0(seq(1940, 2100, 1), "-01-01")),
               labels = date_format("%Y"))

plot_linear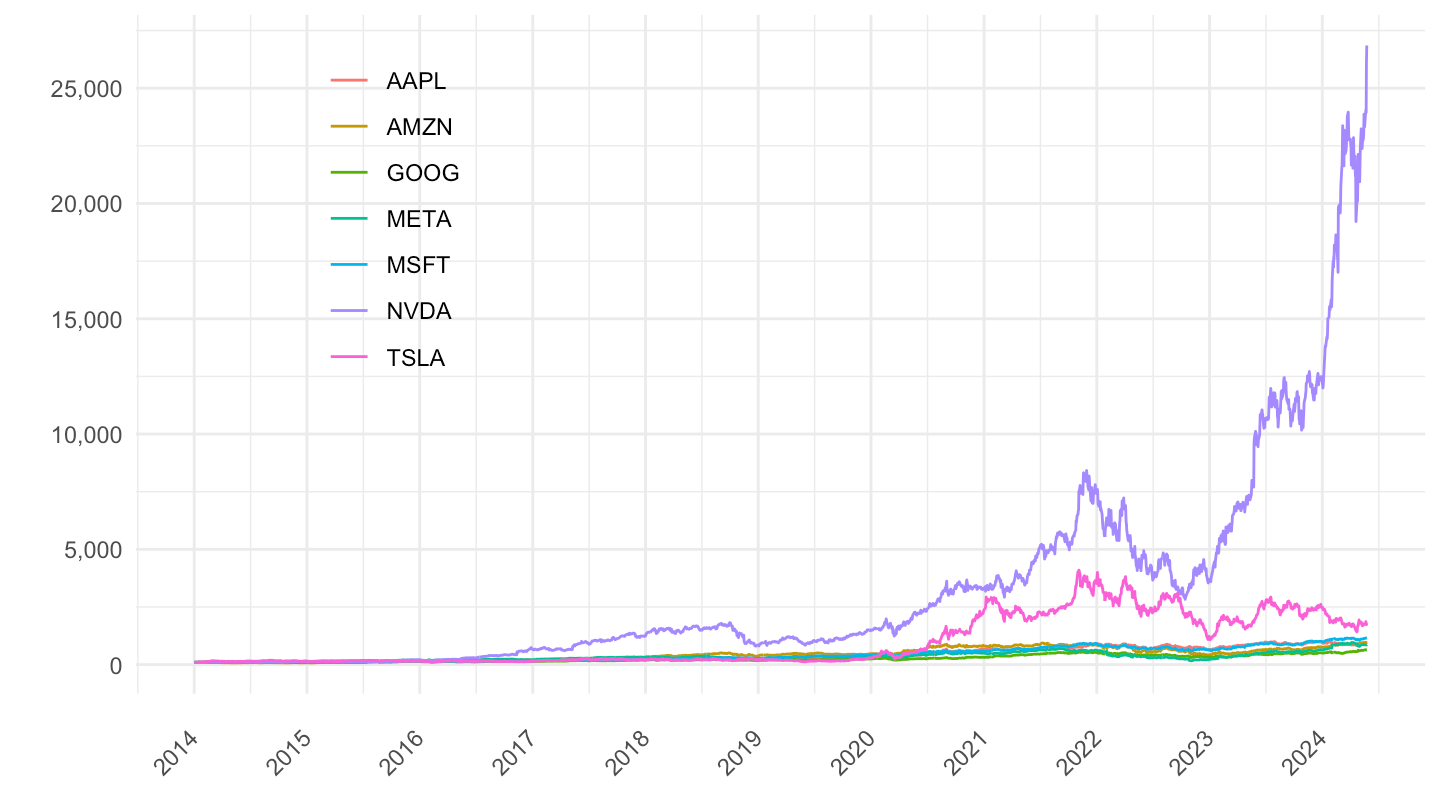
Log
Code
plot_log <- plot_linear +
  scale_y_log10(breaks = c(10^seq(1, 100, 1), 10^seq(1, 100, 1)*2, 10^seq(1, 100, 1)*5),
                     labels = dollar_format(pre = "", acc = 1))

plot_log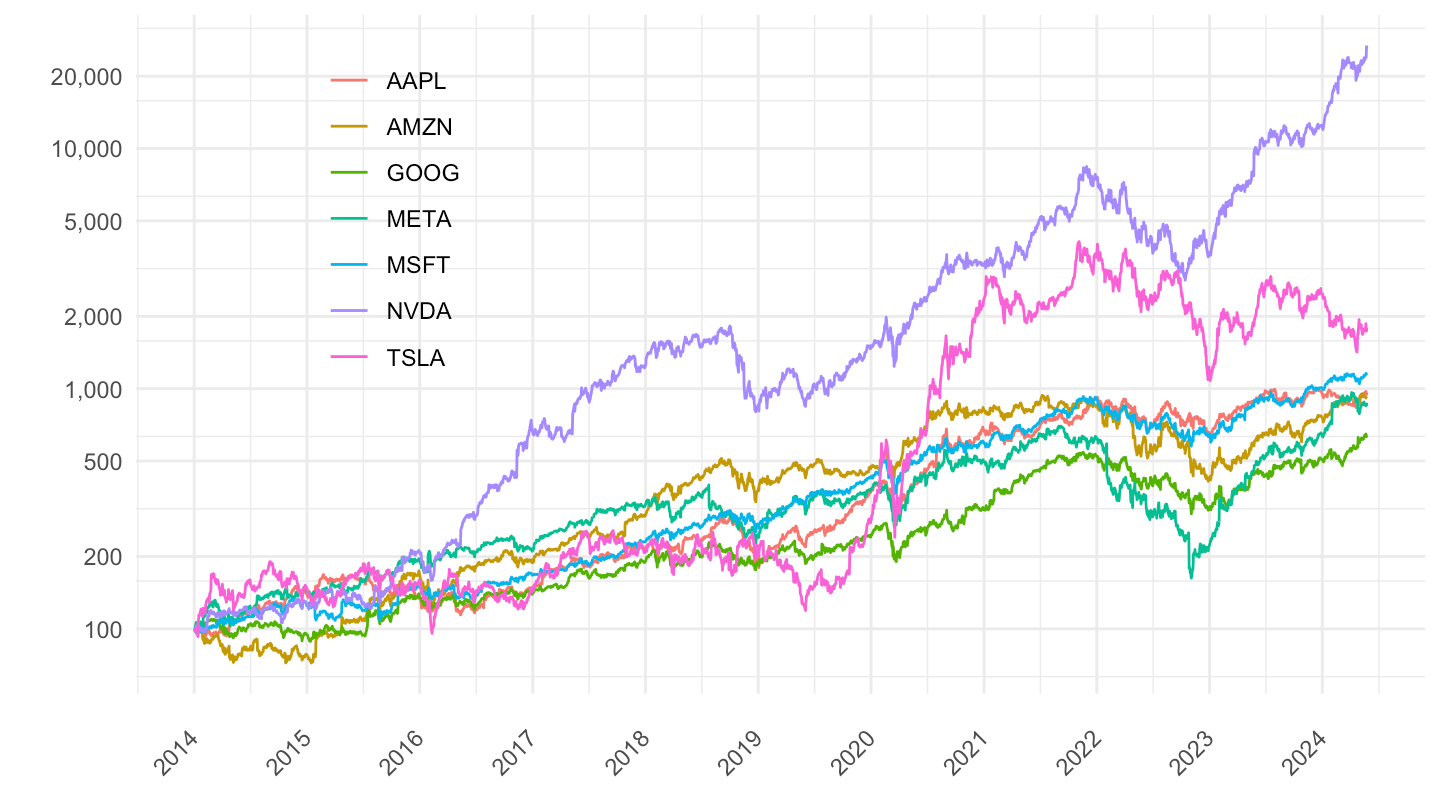
Bind
Code
ggpubr::ggarrange(plot_linear + ggtitle("Linear scale"),
                  plot_log + ggtitle("Log scale"),
                  common.legend = T)