SP.POP.DPND.OL |>
  filter(year == 2019) |>
  left_join(NE.RSB.GNFS.ZS |>
              filter(year == 2019),
            by = c("iso2c", "year")) |>
  left_join(NY.GDP.MKTP.CD |>
              filter(year == 2019),
            by = c("iso2c", "year")) |>
  filter(NY.GDP.MKTP.CD >= 10*10^10) |>
  left_join(iso2c, by = "iso2c") |>
  na.omit() |>
  ggplot() + theme_minimal() +
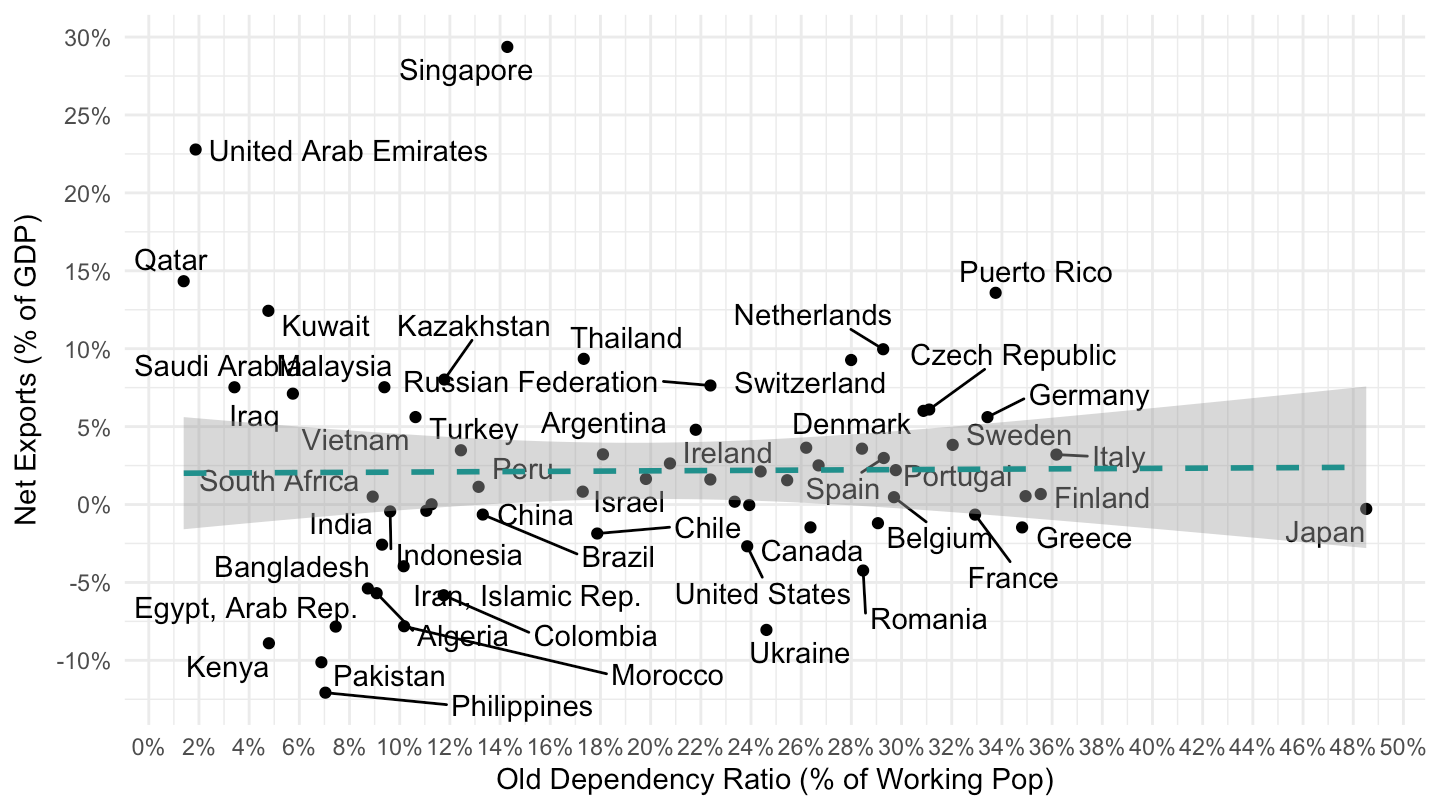
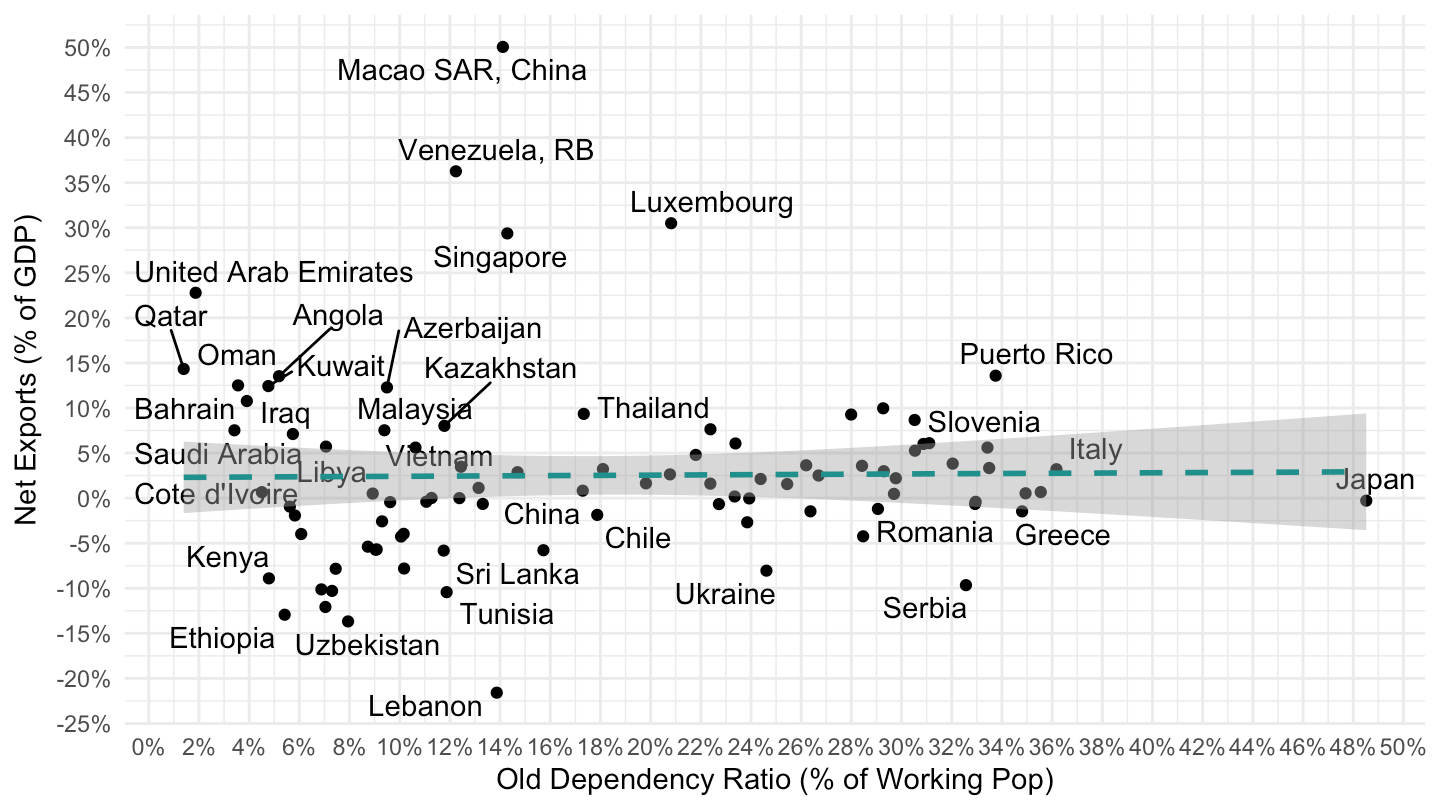
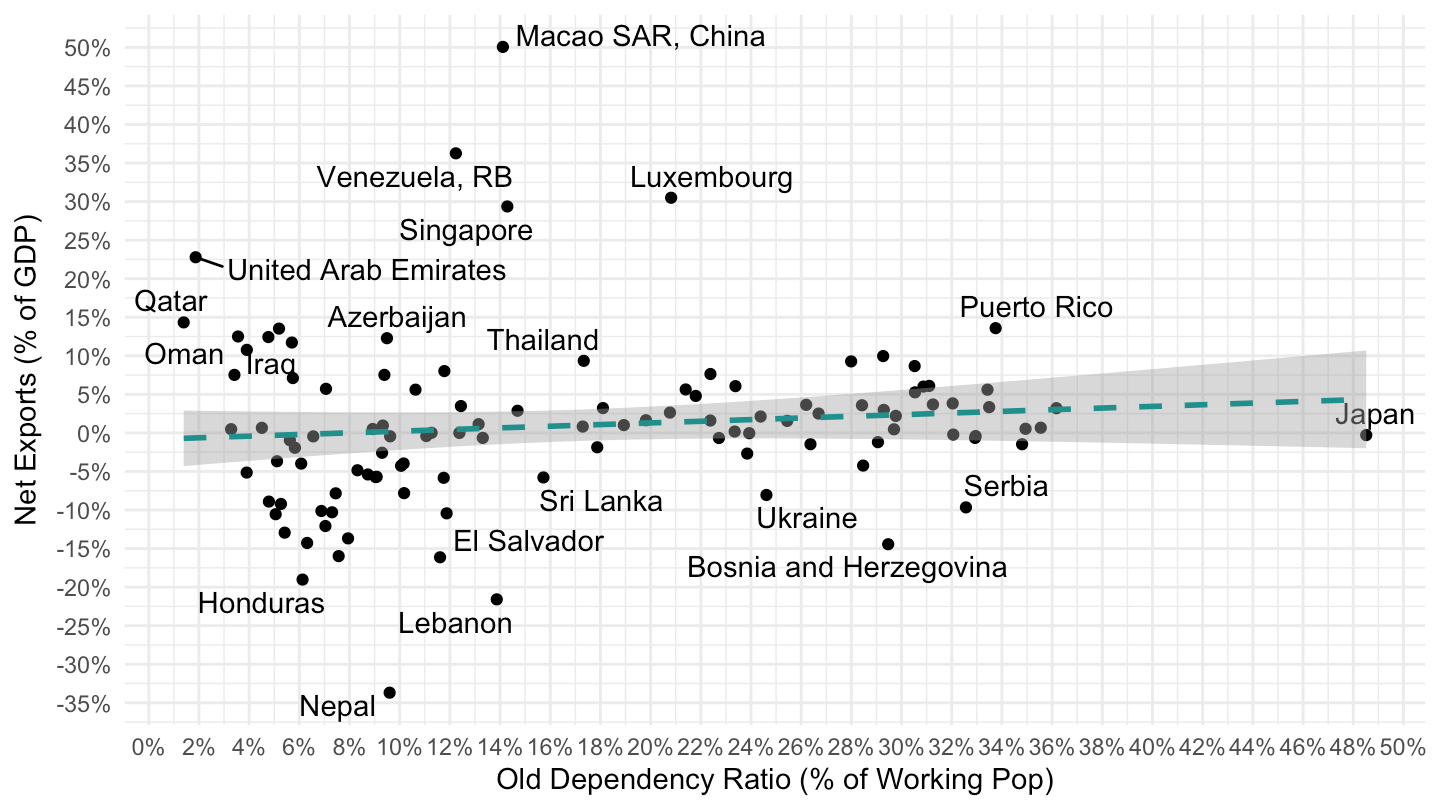
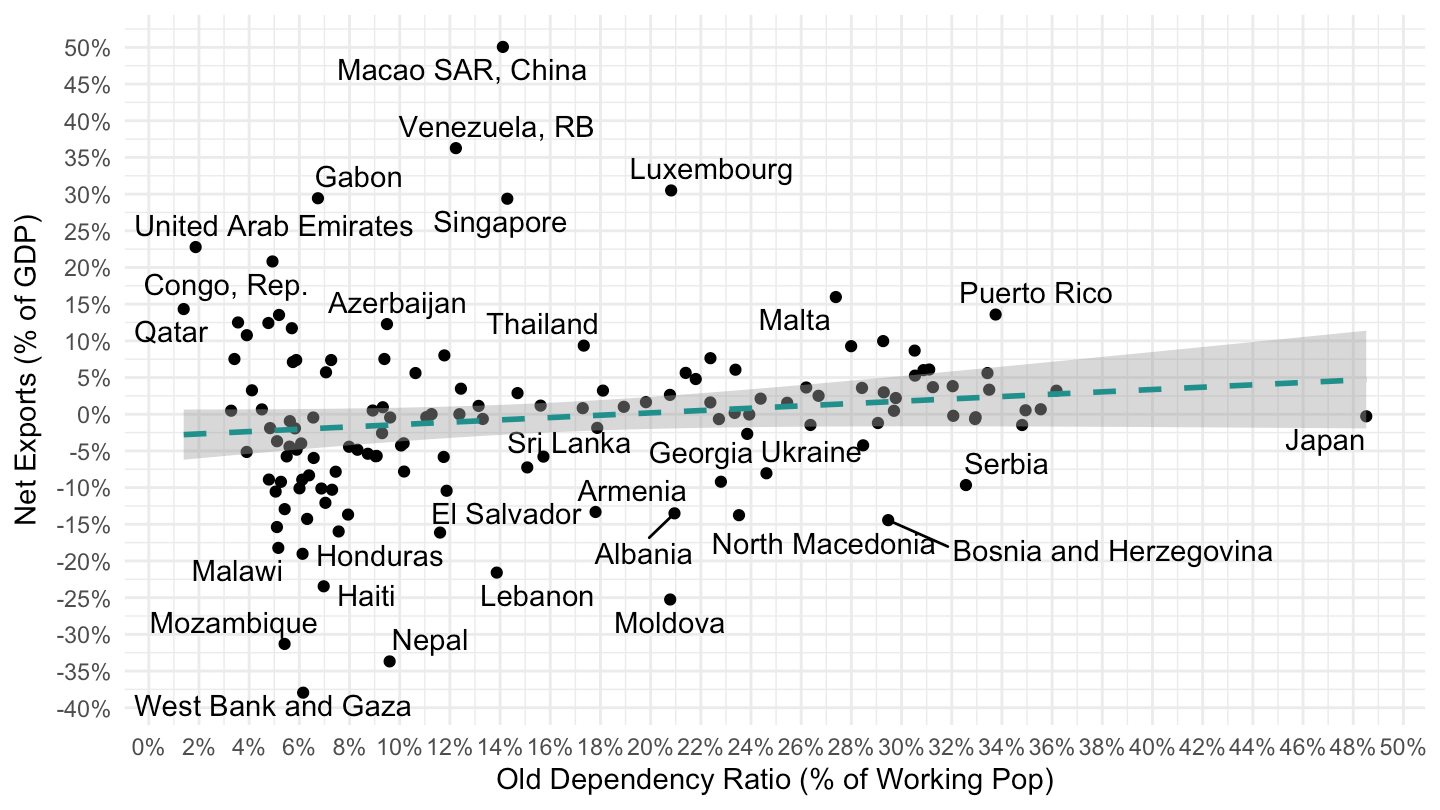
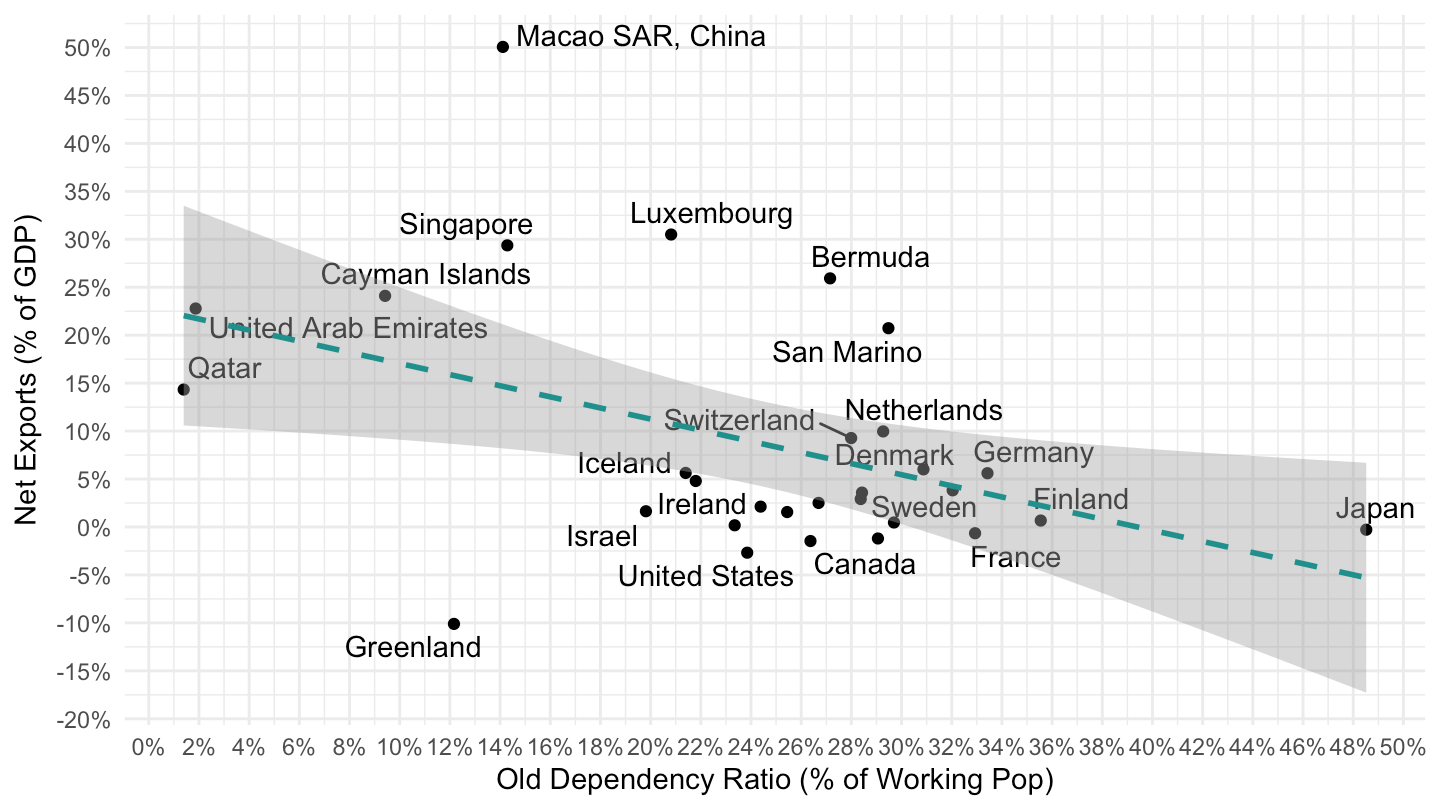
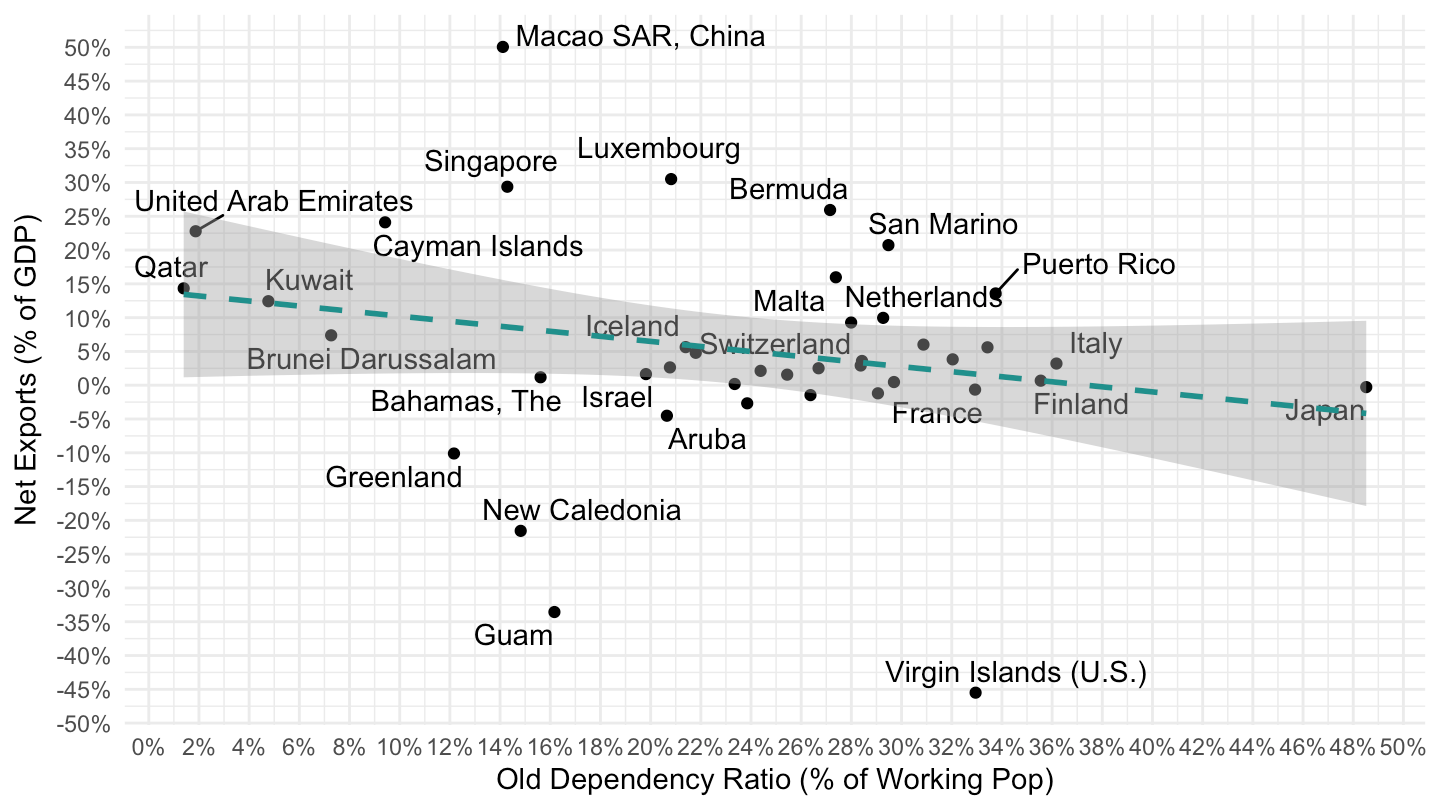
  xlab("Old Dependency Ratio (% of Working Pop)") + ylab("Net Exports (% of GDP)") +
  geom_point(aes(x = SP.POP.DPND.OL/100, y = NE.RSB.GNFS.ZS/100)) +
  scale_x_continuous(breaks = 0.01*seq(-20, 90, 2),
                     labels = percent_format(accuracy = 1)) +
  geom_text_repel(aes(x = SP.POP.DPND.OL/100, y = NE.RSB.GNFS.ZS/100, label = Iso2c)) +
  scale_y_continuous(breaks = 0.01*seq(-50, 50, 5),
                     labels = percent_format(accuracy = 1)) +
  stat_smooth(aes(x = SP.POP.DPND.OL/100, y = NE.RSB.GNFS.ZS/100), linetype = 2,
              method = "lm", color = viridis(3)[2])