Unemployment, youth total (% of total labor force ages 15-24) (modeled ILO estimate) - SL.UEM.1524.ZS
Data - WDI
François Geerolf
Info
- International Labour Organization (ILO). html
Nobs - Javascript
SL.UEM.1524.ZS %>%
  left_join(iso2c, by = "iso2c") %>%
  group_by(iso2c, Iso2c) %>%
  rename(value = `SL.UEM.1524.ZS`) %>%
  mutate(value = round(value, 1)) %>%
  summarise(Nobs = n(),
            `Year 1` = first(year),
            `Unemployment 1 (Bn)` = first(value),
            `Year 2` = last(year),
            `Unemployment 2 (Bn)` = last(value)) %>%
  arrange(-Nobs) %>%
  mutate(Flag = gsub(" ", "-", str_to_lower(Iso2c)),
         Flag = paste0('<img src="../../bib/flags/vsmall/', Flag, '.png" alt="Flag">')) %>%
  select(Flag, everything()) %>%
  {if (is_html_output()) datatable(., filter = 'top', rownames = F, escape = F) else .}
Hong Kong
SL.UEM.1524.ZS %>%
  filter(iso2c %in% c("HK")) %>%
  left_join(iso2c, by = "iso2c") %>%
  year_to_enddate() %>%
  ggplot(.) + geom_line() + theme_minimal() +
  aes(x = date, y = SL.UEM.1524.ZS/100) +
  xlab("") + ylab("Unemp., youth total (% of total labor force 15-24)") +
  scale_color_manual(values = viridis(4)[1:3]) +
  theme(legend.title = element_blank(),
        legend.position = c(0.85, 0.85)) +
  scale_x_date(breaks = seq(1900, 2020, 5) %>% paste0("-01-01") %>% as.Date,
               labels = date_format("%y")) +
  scale_y_continuous(breaks = 0.01*seq(-100, 10000, 2),
                     labels = percent_format(a = 1)) +
  geom_hline(yintercept = 0, linetype = "dashed", color = "grey")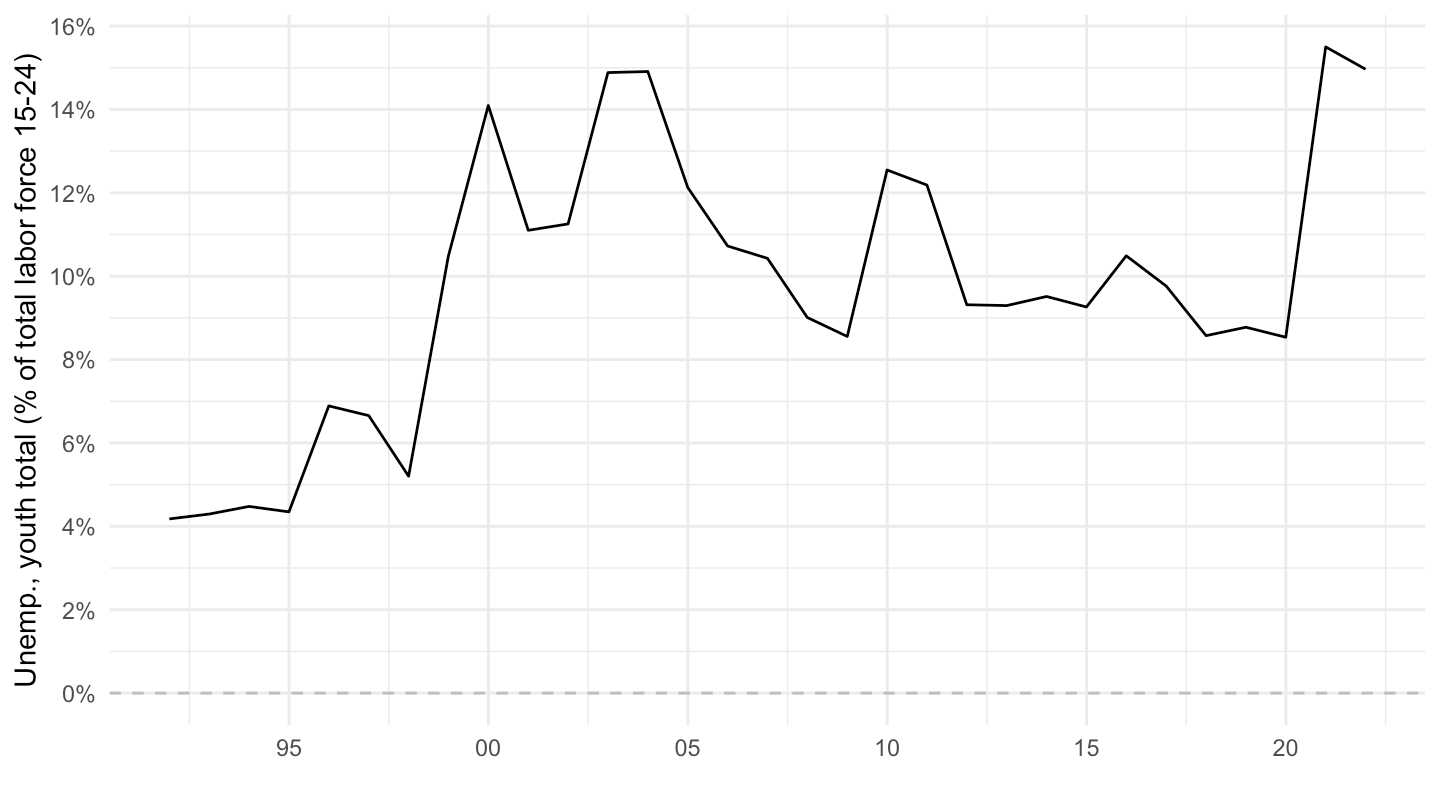
Europe, United States
English
SL.UEM.1524.ZS %>%
  filter(iso2c %in% c("EU", "US")) %>%
  left_join(iso2c, by = "iso2c") %>%
  year_to_enddate() %>%
  ggplot(.) + theme_minimal() +
  geom_line(aes(x = date, y = SL.UEM.1524.ZS/100, color = Iso2c, linetype = Iso2c)) +
  xlab("") + ylab("Unemp., youth total (% of total labor force 15-24)") +
  scale_color_manual(values = viridis(3)[1:2]) +
  theme(legend.title = element_blank(),
        legend.position = c(0.15, 0.25)) +
  scale_x_date(breaks = seq(1900, 2020, 5) %>% paste0("-01-01") %>% as.Date,
               labels = date_format("%y")) +
  geom_rect(data = data_frame(start = as.Date("2011-01-01"),
                              end = as.Date("2014-01-01")),
              aes(xmin = start, xmax = end, ymin = -Inf, ymax = +Inf),
              fill = viridis(3)[3], alpha = 0.2) +
  geom_vline(xintercept = as.Date("2011-01-01"), linetype = "dashed", color = viridis(3)[3]) +
  geom_vline(xintercept = as.Date("2014-01-01"), linetype = "dashed", color = viridis(3)[3]) +
  scale_y_continuous(breaks = 0.01*seq(-100, 10000, 2),
                     labels = percent_format(a = 1)) +
  geom_hline(yintercept = 0, linetype = "dashed", color = "black")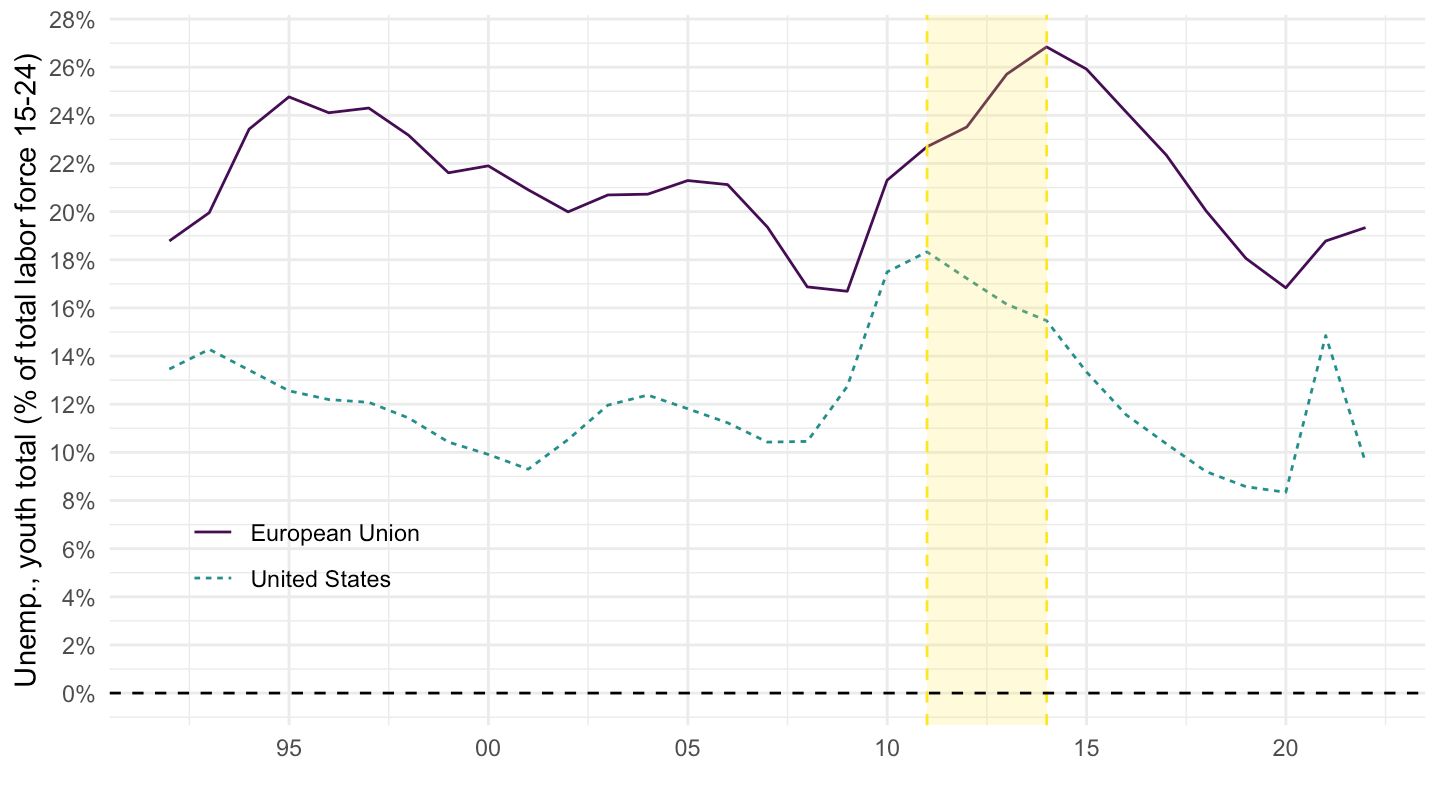
French
SL.UEM.1524.ZS %>%
  filter(iso2c %in% c("EU", "US")) %>%
  mutate(Iso2c = case_when(iso2c == "EU" ~ "Union Européenne",
                                iso2c == "US" ~ "Etats-Unis")) %>%
  year_to_enddate() %>%
  ggplot(.) + theme_minimal() +
  geom_line(aes(x = date, y = SL.UEM.1524.ZS/100, color = Iso2c, linetype = Iso2c)) +
  xlab("") + ylab("Taux de Chômage des Jeunes 15-24 (%)") +
  scale_color_manual(values = viridis(3)[1:2]) +
  theme(legend.title = element_blank(),
        legend.position = c(0.15, 0.25)) +
  scale_x_date(breaks = seq(1900, 2020, 5) %>% paste0("-01-01") %>% as.Date,
               labels = date_format("%y")) +
  geom_rect(data = data_frame(start = as.Date("2011-01-01"),
                              end = as.Date("2014-01-01")),
              aes(xmin = start, xmax = end, ymin = -Inf, ymax = +Inf),
              fill = viridis(3)[3], alpha = 0.2) +
  geom_vline(xintercept = as.Date("2011-01-01"), linetype = "dashed", color = viridis(3)[3]) +
  geom_vline(xintercept = as.Date("2014-01-01"), linetype = "dashed", color = viridis(3)[3]) +
  scale_y_continuous(breaks = 0.01*seq(-100, 10000, 2),
                     labels = percent_format(a = 1)) +
  geom_hline(yintercept = 0, linetype = "dashed", color = "black")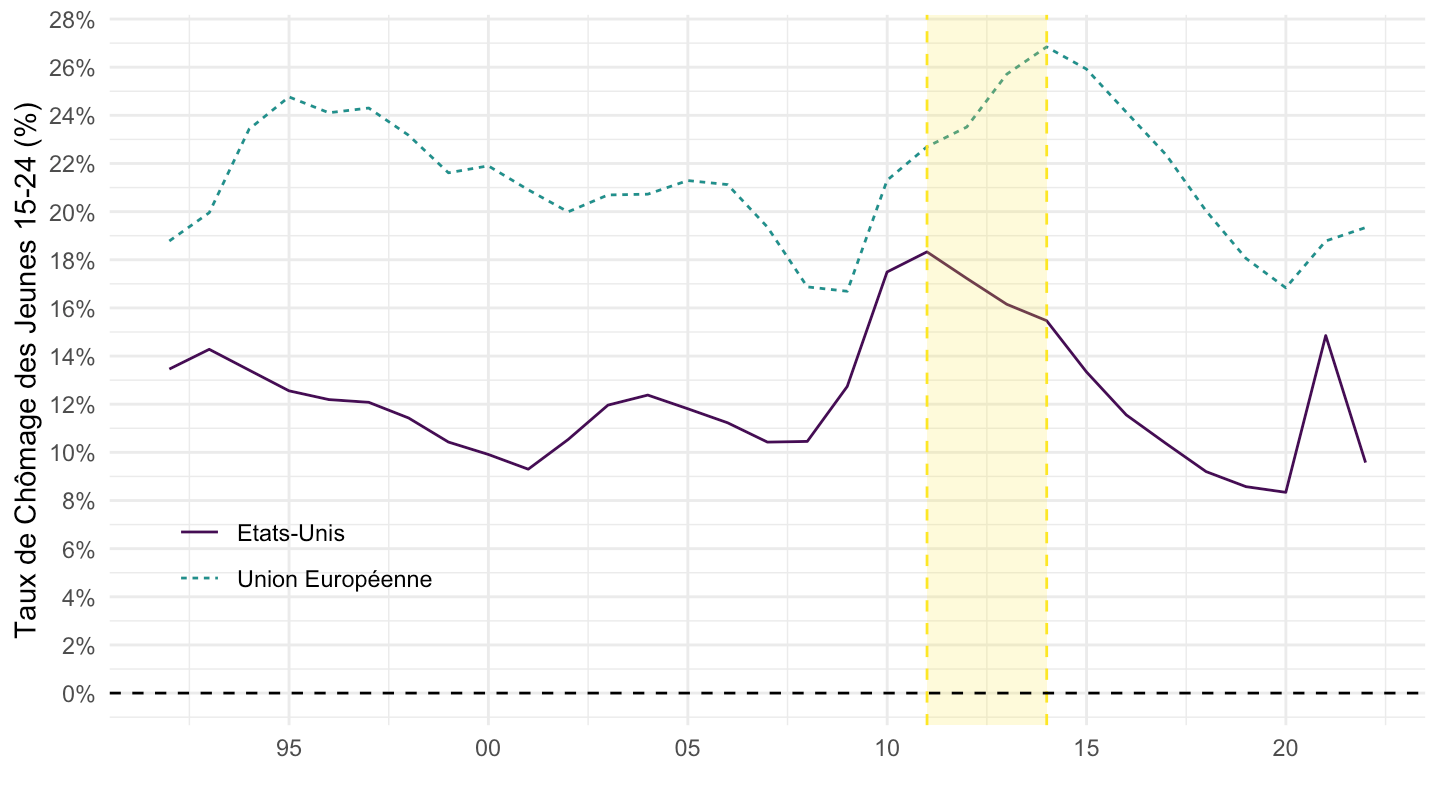
Spain, Portugal, Greece
English
SL.UEM.1524.ZS %>%
  filter(iso2c %in% c("ES", "PT", "GR")) %>%
  left_join(iso2c, by = "iso2c") %>%
  year_to_enddate() %>%
  ggplot(.) + theme_minimal() +
  geom_line(aes(x = date, y = SL.UEM.1524.ZS/100, color = Iso2c, linetype = Iso2c)) +
  xlab("") + ylab("Unemp., youth total (% of total labor force 15-24)") +
  scale_color_manual(values = viridis(4)[1:3]) +
  theme(legend.title = element_blank(),
        legend.position = c(0.25, 0.9),
        legend.direction = "horizontal") +
  scale_x_date(breaks = seq(1900, 2020, 5) %>% paste0("-01-01") %>% as.Date,
               labels = date_format("%y")) +
  geom_rect(data = data_frame(start = as.Date("2011-01-01"),
                              end = as.Date("2014-01-01")),
              aes(xmin = start, xmax = end, ymin = -Inf, ymax = +Inf),
              fill = viridis(4)[4], alpha = 0.2) +
  geom_vline(xintercept = as.Date("2011-01-01"), linetype = "dashed", color = viridis(3)[3]) +
  geom_vline(xintercept = as.Date("2014-01-01"), linetype = "dashed", color = viridis(3)[3]) +
  scale_y_continuous(breaks = 0.01*seq(-100, 10000, 5),
                     labels = percent_format(a = 1)) +
  geom_hline(yintercept = 0, linetype = "dashed", color = "black")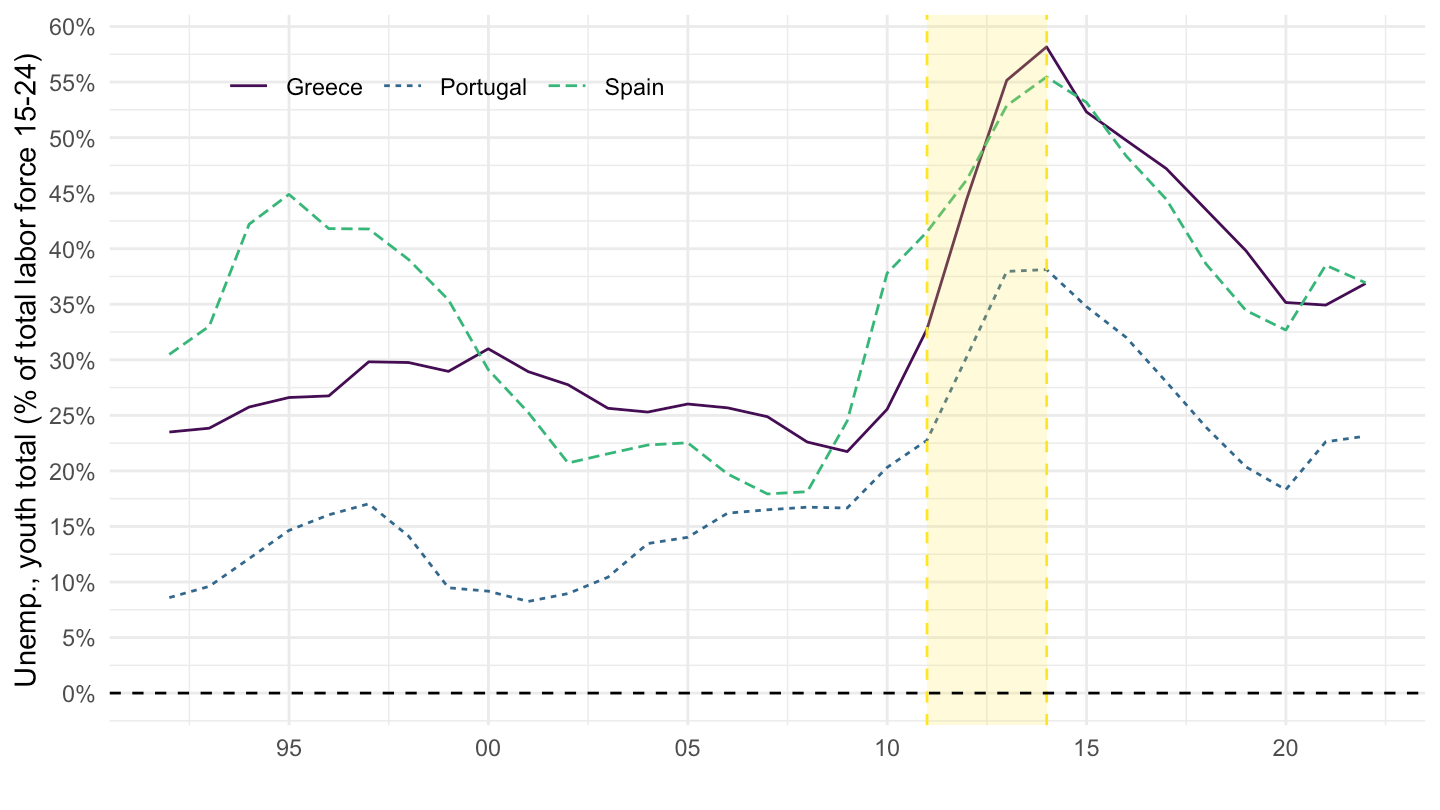
French
SL.UEM.1524.ZS %>%
  filter(iso2c %in% c("ES", "IT", "GR")) %>%
  mutate(Iso2c = case_when(iso2c == "ES" ~ "Espagne",
                                iso2c == "IT" ~ "Italie",
                                iso2c == "GR" ~ "Grèce")) %>%
  year_to_enddate() %>%
  filter(date >= as.Date("2001-01-01")) %>%
  ggplot(.) + theme_minimal() +
  geom_line(aes(x = date, y = SL.UEM.1524.ZS/100, color = Iso2c, linetype = Iso2c)) +
  xlab("") + ylab("Taux de Chômage des Jeunes 15-24 (%)") +
  scale_color_manual(values = viridis(4)[1:3]) +
  theme(legend.title = element_blank(),
        legend.position = c(0.25, 0.9),
        legend.direction = "horizontal") +
  scale_x_date(breaks = seq(1900, 2020, 2) %>% paste0("-01-01") %>% as.Date,
               labels = date_format("%y")) +
  geom_rect(data = data_frame(start = as.Date("2011-01-01"),
                              end = as.Date("2014-01-01")),
              aes(xmin = start, xmax = end, ymin = -Inf, ymax = +Inf),
              fill = viridis(4)[4], alpha = 0.2) +
  geom_vline(xintercept = as.Date("2011-01-01"), linetype = "dashed", color = viridis(3)[3]) +
  geom_vline(xintercept = as.Date("2014-01-01"), linetype = "dashed", color = viridis(3)[3]) +
  scale_y_continuous(breaks = 0.01*seq(-100, 10000, 5),
                     labels = percent_format(a = 1)) +
  geom_hline(yintercept = 0, linetype = "dashed", color = "black")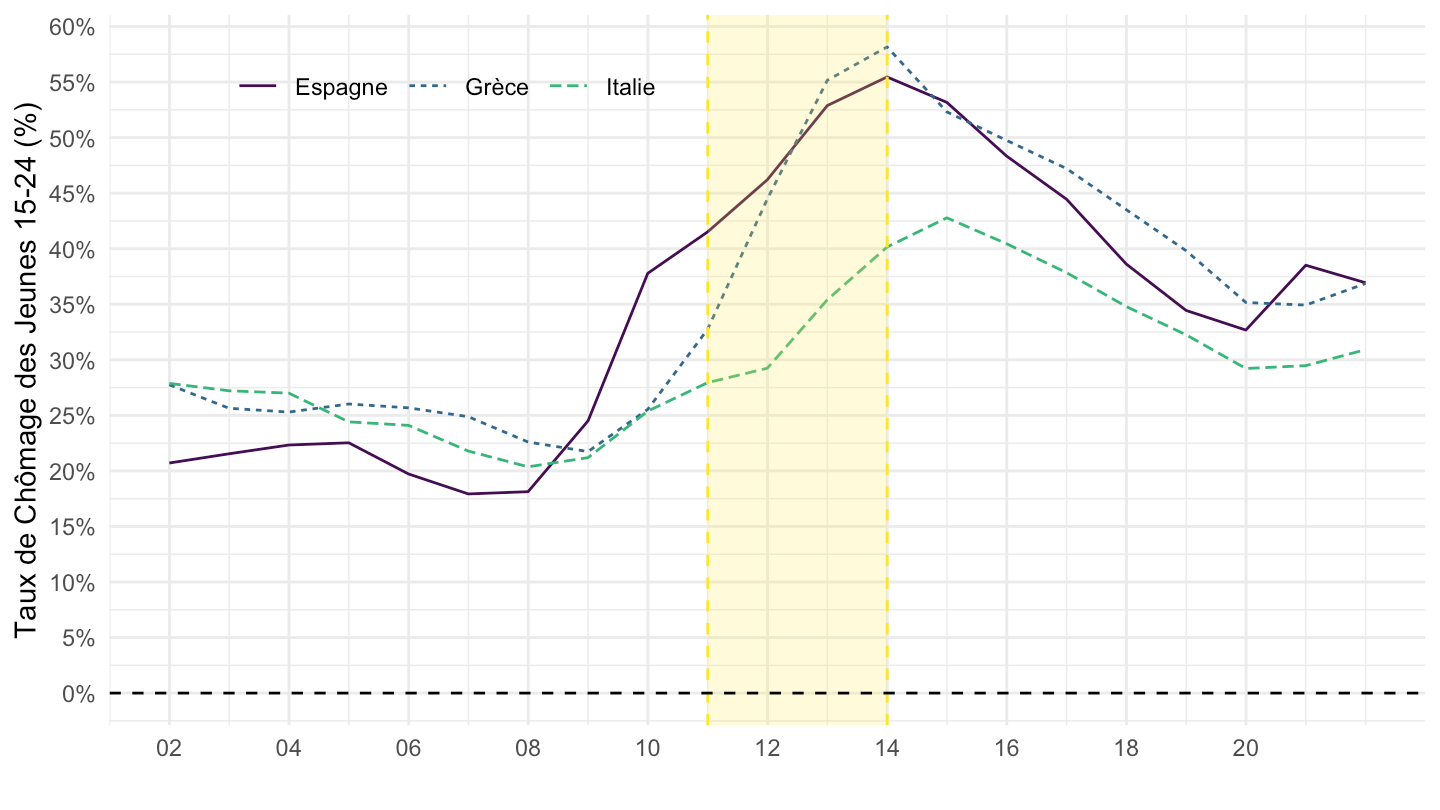
France, Italy, Germany
SL.UEM.1524.ZS %>%
  filter(iso2c %in% c("FR", "DE", "IT")) %>%
  left_join(iso2c, by = "iso2c") %>%
  year_to_enddate() %>%
  ggplot(.) + geom_line() + theme_minimal() +
  aes(x = date, y = SL.UEM.1524.ZS/100, color = Iso2c, linetype = Iso2c) +
  xlab("") + ylab("Unemp., youth total (% of total labor force 15-24)") +
  scale_color_manual(values = viridis(4)[1:3]) +
  theme(legend.title = element_blank(),
        legend.position = c(0.15, 0.25)) +
  scale_x_date(breaks = seq(1900, 2020, 5) %>% paste0("-01-01") %>% as.Date,
               labels = date_format("%y")) +
  scale_y_continuous(breaks = 0.01*seq(-100, 10000, 2),
                     labels = percent_format(a = 1)) +
  geom_hline(yintercept = 0, linetype = "dashed", color = "grey")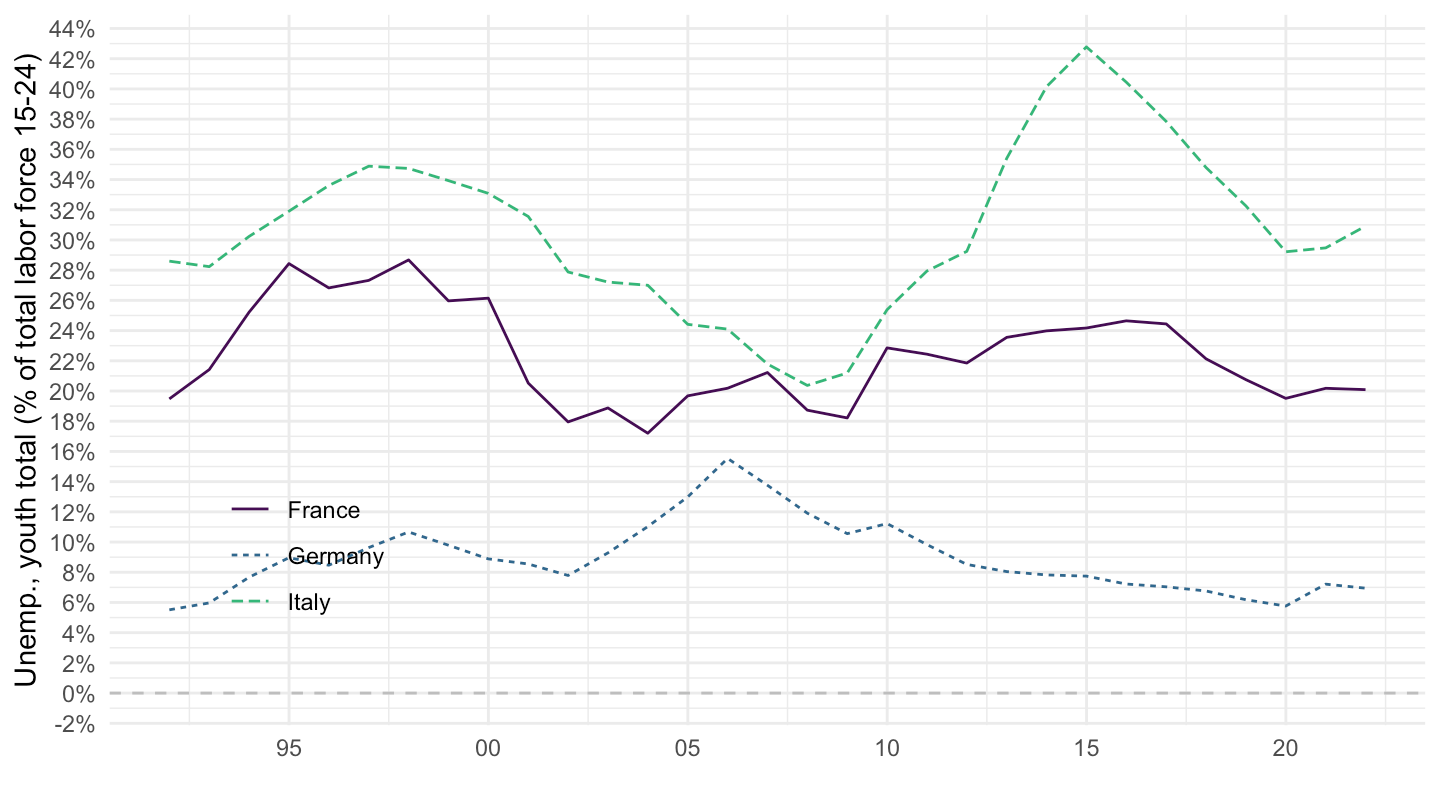
1997 Asian Financial Crisis
Indonesia, Philippines, Singapore
SL.UEM.1524.ZS %>%
  year_to_enddate() %>%
  filter(iso2c %in% c("SG", "PH", "ID"),
         date >= as.Date("1990-01-01"),
         date <= as.Date("2005-01-01")) %>%
  left_join(iso2c, by = "iso2c") %>%
  ggplot(.) + geom_line() + theme_minimal() +
  aes(x = date, y = SL.UEM.1524.ZS/100, color = Iso2c, linetype = Iso2c) +
  xlab("") + ylab("Unemp., youth total (% of total labor force 15-24)") +
  scale_color_manual(values = viridis(4)[1:3]) +
  theme(legend.title = element_blank(),
        legend.position = c(0.85, 0.85)) +
  scale_x_date(breaks = seq(1900, 2020, 1) %>% paste0("-01-01") %>% as.Date,
               labels = date_format("%y")) +
  scale_y_continuous(breaks = 0.01*seq(-100, 10000, 5),
                     labels = percent_format(a = 1)) +
  geom_hline(yintercept = 0, linetype = "dashed", color = "grey")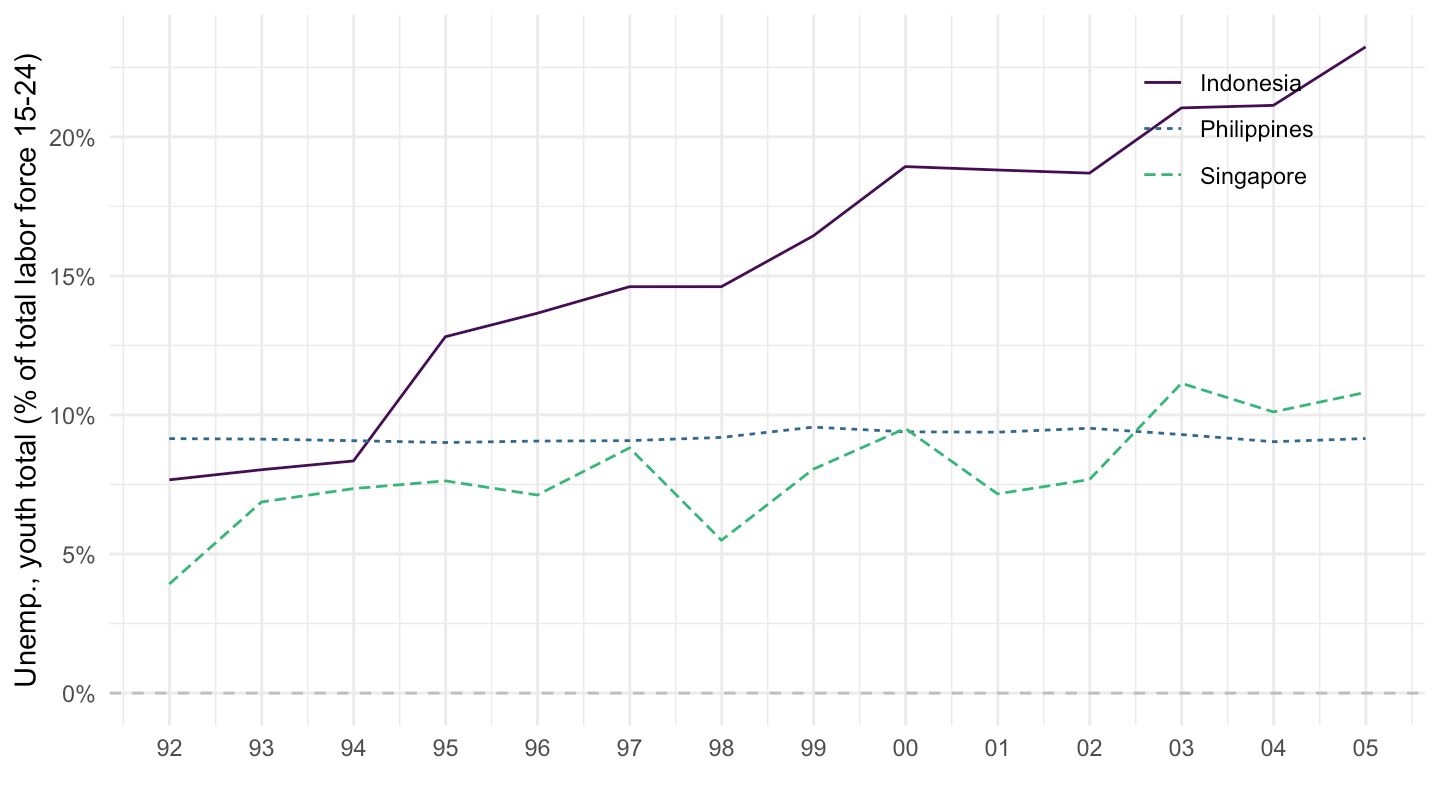
Thailand, Malaysia, South Korea
SL.UEM.1524.ZS %>%
  year_to_enddate() %>%
  filter(iso2c %in% c("TH", "MY", "KR"),
         date >= as.Date("1990-01-01"),
         date <= as.Date("2005-01-01")) %>%
  left_join(iso2c, by = "iso2c") %>%
  ggplot(.) + geom_line() + theme_minimal() +
  aes(x = date, y = SL.UEM.1524.ZS/100, color = Iso2c, linetype = Iso2c) +
  xlab("") + ylab("Unemp., youth total (% of total labor force 15-24)") +
  scale_color_manual(values = viridis(4)[1:3]) +
  theme(legend.title = element_blank(),
        legend.position = c(0.85, 0.85)) +
  scale_x_date(breaks = seq(1900, 2020, 1) %>% paste0("-01-01") %>% as.Date,
               labels = date_format("%y")) +
  scale_y_continuous(breaks = 0.01*seq(-100, 10000, 1),
                     labels = percent_format(a = 1)) +
  geom_hline(yintercept = 0, linetype = "dashed", color = "grey")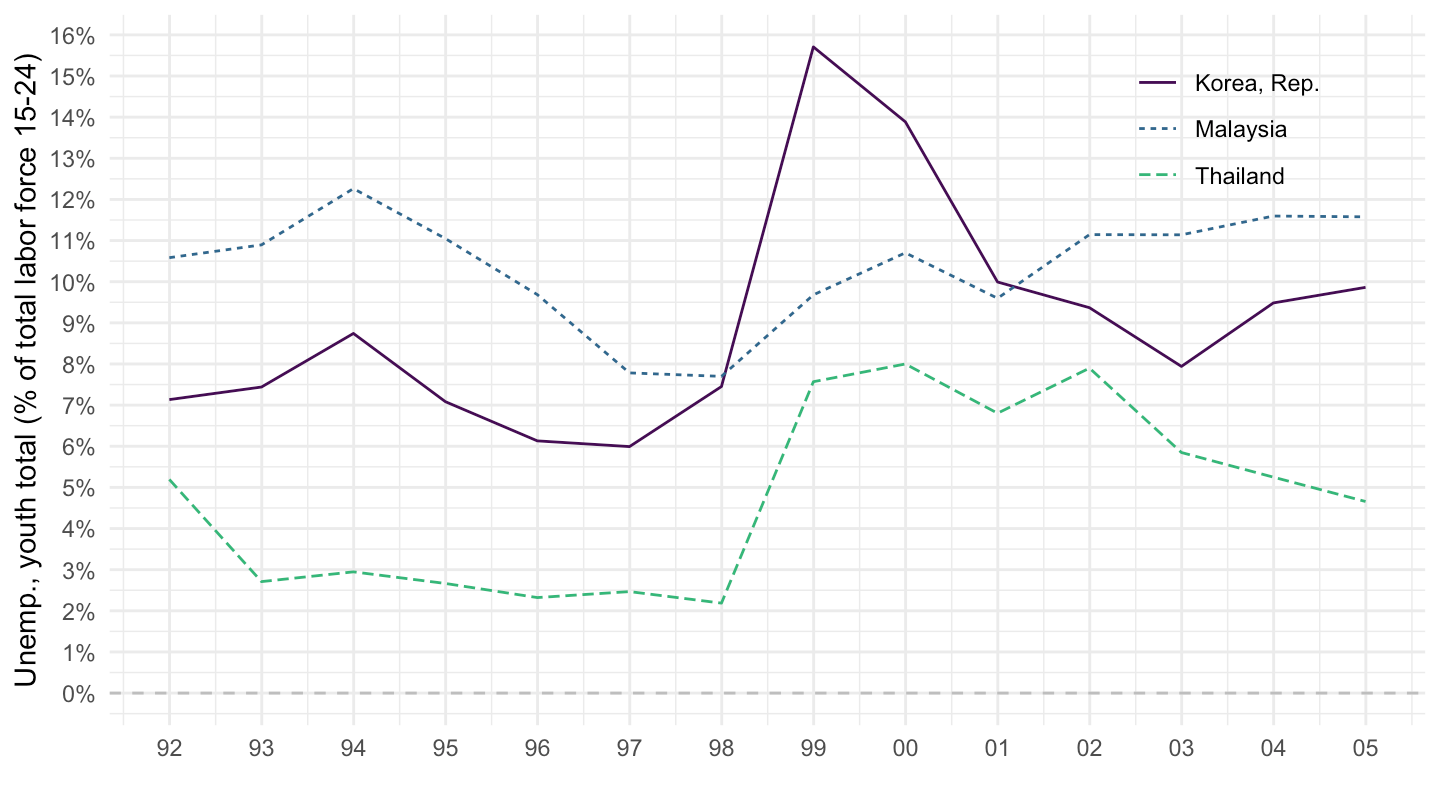
Denmark, Netherlands, Sweden
SL.UEM.1524.ZS %>%
  filter(iso2c %in% c("DK", "SE", "c")) %>%
  left_join(iso2c, by = "iso2c") %>%
  year_to_enddate() %>%
  ggplot(.) + geom_line() + theme_minimal() +
  aes(x = date, y = SL.UEM.1524.ZS/100, color = Iso2c, linetype = Iso2c) +
  xlab("") + ylab("Unemp., youth total (% of total labor force 15-24)") +
  scale_color_manual(values = viridis(4)[1:3]) +
  theme(legend.title = element_blank(),
        legend.position = c(0.85, 0.85)) +
  scale_x_date(breaks = seq(1900, 2020, 5) %>% paste0("-01-01") %>% as.Date,
               labels = date_format("%y")) +
  scale_y_continuous(breaks = 0.01*seq(-100, 10000, 2),
                     labels = percent_format(a = 1)) +
  geom_hline(yintercept = 0, linetype = "dashed", color = "grey")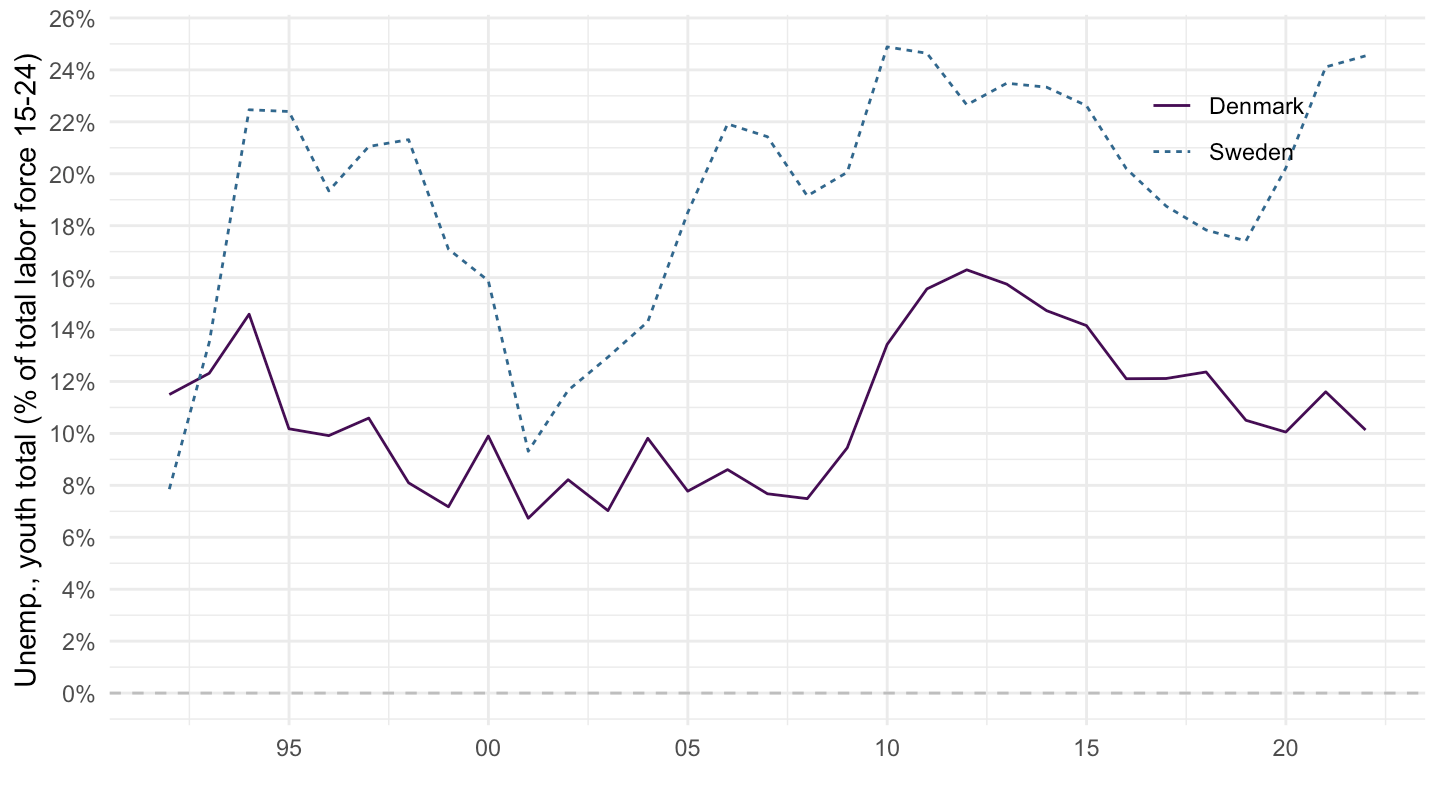
United States, United Kingdom, Japan
SL.UEM.1524.ZS %>%
  filter(iso2c %in% c("JP", "US", "GB")) %>%
  left_join(iso2c, by = "iso2c") %>%
  year_to_enddate() %>%
  ggplot(.) + geom_line() + theme_minimal() +
  aes(x = date, y = SL.UEM.1524.ZS/100, color = Iso2c, linetype = Iso2c) +
  xlab("") + ylab("Unemp., youth total (% of total labor force 15-24)") +
  scale_color_manual(values = viridis(4)[1:3]) +
  theme(legend.title = element_blank(),
        legend.position = c(0.85, 0.85)) +
  scale_x_date(breaks = seq(1900, 2020, 5) %>% paste0("-01-01") %>% as.Date,
               labels = date_format("%y")) +
  scale_y_continuous(breaks = 0.01*seq(-100, 10000, 2),
                     labels = percent_format(a = 1)) +
  geom_hline(yintercept = 0, linetype = "dashed", color = "grey")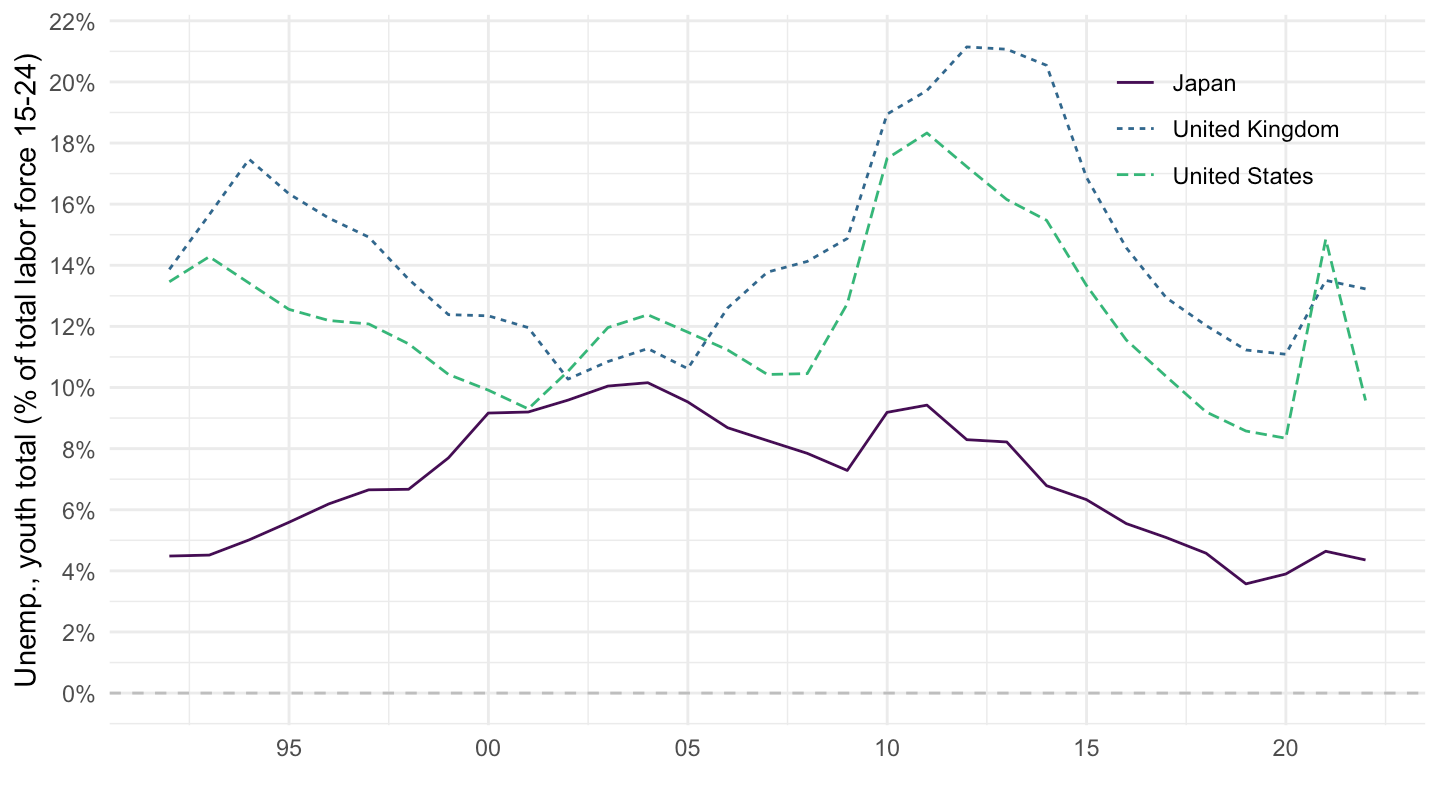
Argentina
1996-2005
SL.UEM.1524.ZS %>%
  year_to_enddate() %>%
  filter(iso2c == "AR",
         date >= as.Date("1996-01-01"),
         date <= as.Date("2005-01-01")) %>%
  ggplot(.) + geom_line() + theme_minimal() +
  aes(x = date, y = SL.UEM.1524.ZS/100) + xlab("") + ylab("Unemp., youth total (% of total labor force 15-24)") +
  scale_x_date(breaks = seq(1900, 2020, 1) %>% paste0("-01-01") %>% as.Date,
               labels = date_format("%y")) +
  scale_y_continuous(breaks = 0.01*seq(-100, 10000, 5),
                     labels = percent_format(a = 1)) +
  geom_hline(yintercept = 0, linetype = "dashed", color = "grey")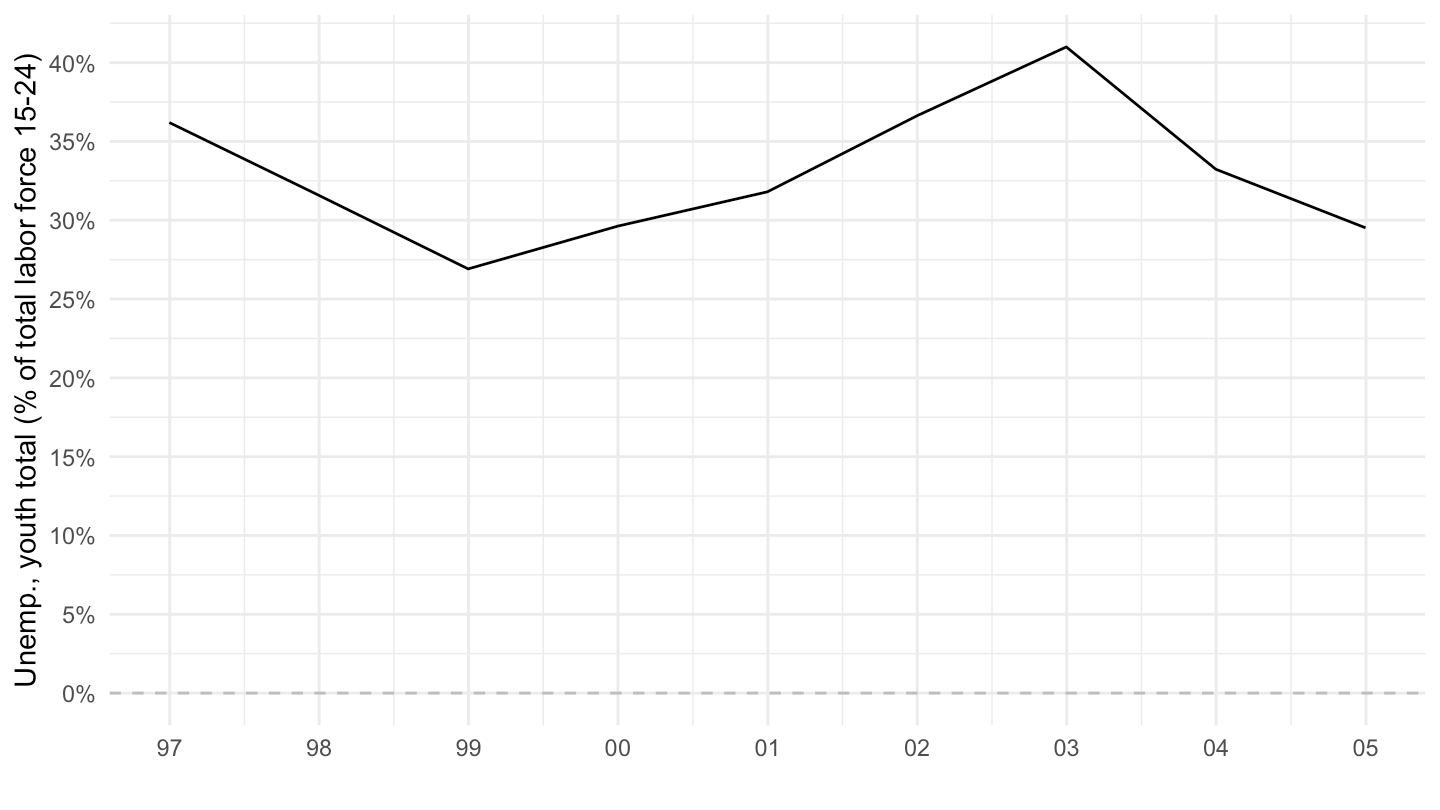
1996-2020
SL.UEM.1524.ZS %>%
  year_to_enddate() %>%
  filter(iso2c == "AR",
         date >= as.Date("1996-01-01"),
         date <= as.Date("2020-01-01")) %>%
  ggplot(.) + geom_line() + theme_minimal() +
  aes(x = date, y = SL.UEM.1524.ZS/100) + xlab("") + ylab("Unemp., youth total (% of total labor force 15-24)") +
  scale_x_date(breaks = seq(1900, 2020, 1) %>% paste0("-01-01") %>% as.Date,
               labels = date_format("%y")) +
  scale_y_continuous(breaks = 0.01*seq(-100, 10000, 5),
                     labels = percent_format(a = 1)) +
  geom_hline(yintercept = 0, linetype = "dashed", color = "grey")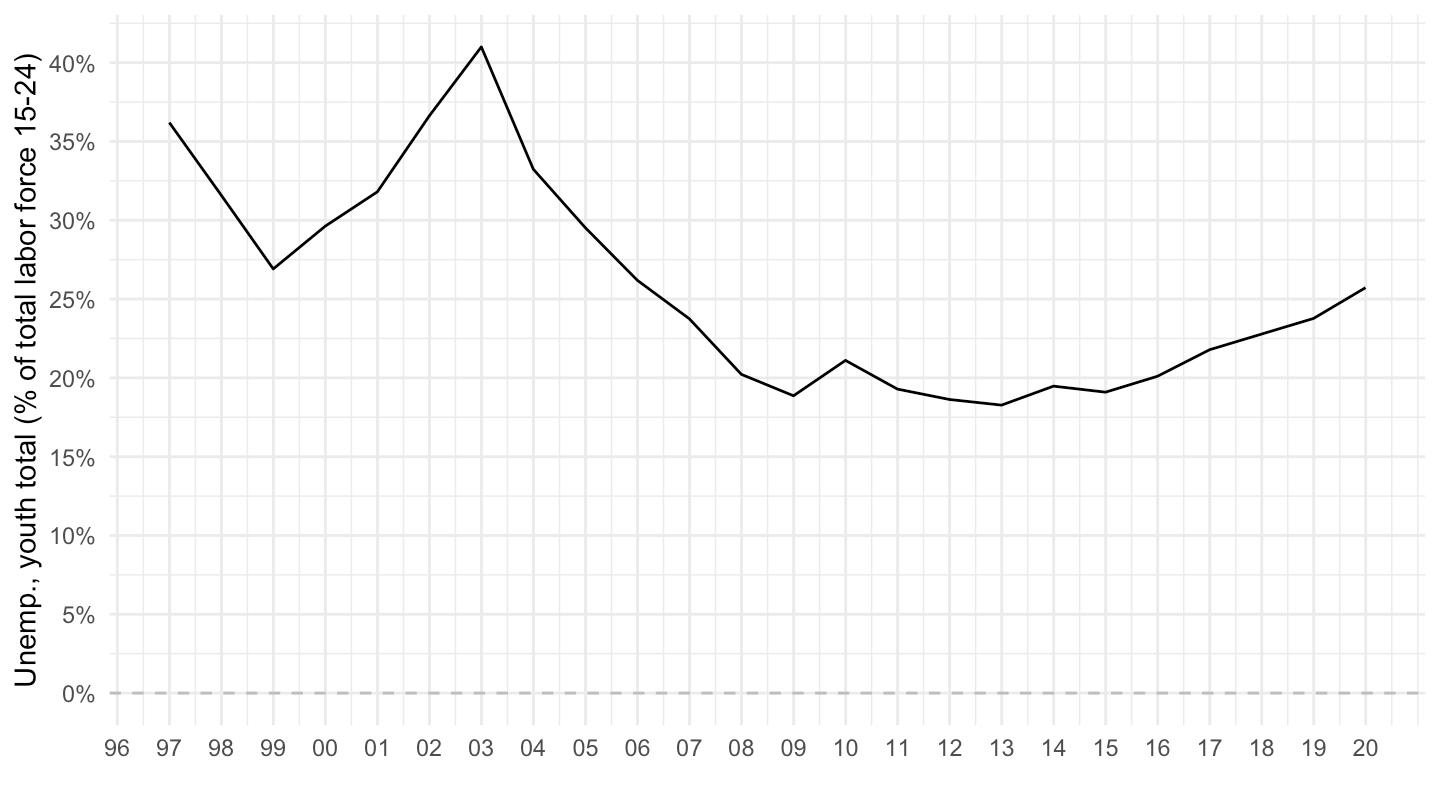
China
SL.UEM.1524.ZS %>%
  filter(iso2c == "CN") %>%
  year_to_enddate() %>%
  ggplot(.) + geom_line() + theme_minimal() +
  aes(x = date, y = SL.UEM.1524.ZS/100) + xlab("") + ylab("Unemp., youth total (% of total labor force 15-24)") +
  scale_x_date(breaks = seq(1900, 2020, 5) %>% paste0("-01-01") %>% as.Date,
               labels = date_format("%y")) +
  scale_y_continuous(breaks = 0.01*seq(-100, 10000, 5),
                     labels = percent_format(a = 1)) +
  geom_hline(yintercept = 0, linetype = "dashed", color = "grey")