Last data update: 25 oct. 2026, 23:54
Last compile: 25 oct. 2026, 23:55
(ref:house-prices-2000) U.S. Real House Prices (1990-2013). Source: Shiller.
data_house_prices_qtr |>
  select(date, real_house_index) |>
  filter(date >= as.Date("1990-01-01"),
         date <= as.Date("2013-01-01")) |>
  na.omit() |>
  ggplot() +
  geom_line(aes(x = date, y = real_house_index)) +
  ylab("Real House Price Index") +
  geom_rect(data = nber_recessions,
            aes(xmin = Peak, xmax = Trough, ymin = -Inf, ymax = +Inf),
            fill = 'grey', alpha = 0.3) +
  scale_y_continuous(breaks = seq(50, 200, 20)) +
  scale_x_date(breaks = as.Date(paste0(c(1990, 1991, 1998, 2001, 2006, 2007, 2009, 2013), "-01-01")),
               labels = date_format("%Y"),
               limits = c(as.Date("1990-01-01"), as.Date("2013-01-01"))) +
  theme_minimal() + xlab("")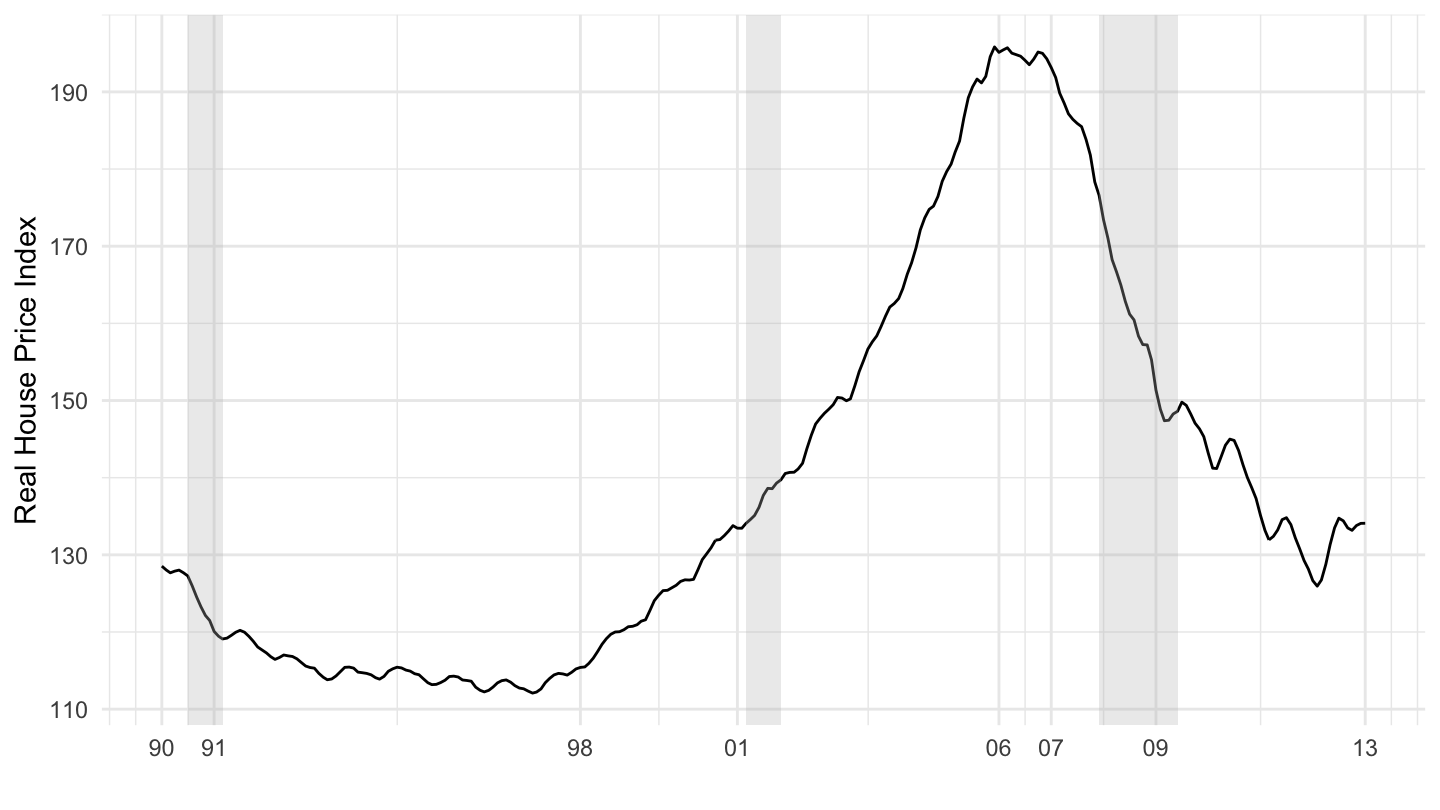
(ref:house-prices-long-run) U.S. Real House Prices (1890-2019). Source: Shiller.
data_house_prices_qtr |>
  select(date, real_house_index) |>
  na.omit() |>
  ggplot() +
  geom_line(aes(x = date, y = real_house_index)) +
  ylab("Real House Price Index") +
  geom_rect(data = nber_recessions,
            aes(xmin = Peak, xmax = Trough, ymin = -Inf, ymax = +Inf),
            fill = 'grey', alpha = 0.3) +
  scale_y_continuous(breaks = seq(50, 200, 20)) +
  scale_x_date(breaks = as.Date(paste0(seq(1890, 2100, 10), "-01-01")),
               labels = date_format("%Y"),
               limits = c(as.Date("1890-01-01"), as.Date("2021-08-01"))) +
  theme_minimal() + xlab("")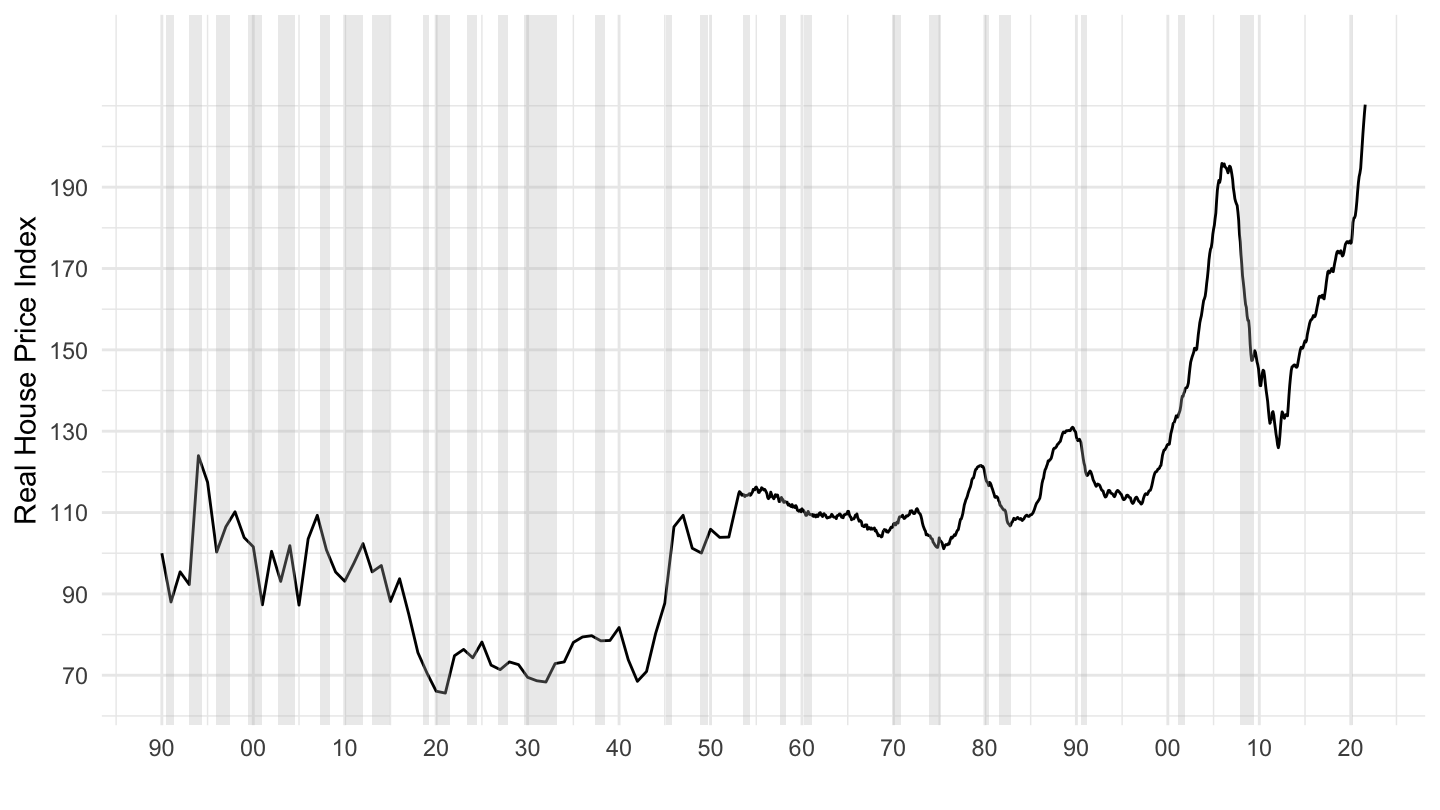
data |>
  select(date, CAPE) |>
  na.omit() |>
  ggplot() + geom_line(aes(x = date, y = CAPE)) +
  ylab("Cyclically Adjusted P/E Ratio") +
  scale_x_date(breaks = as.Date(paste0(seq(1800, 2025, 20), "-01-01")),
               labels = date_format("%Y")) +
  geom_rect(data = nber_recessions |>
              filter(Peak >= as.Date("1880-01-01")),
            aes(xmin = Peak, xmax = Trough, ymin = -Inf, ymax = +Inf),
            fill = 'grey', alpha = 0.5) +
  scale_y_continuous(breaks = seq(5, 90, 5)) +
  theme_minimal() + xlab("") +
  geom_vline(xintercept = as.Date("1929-10-24"), linetype = "dashed", color = viridis(3)[2])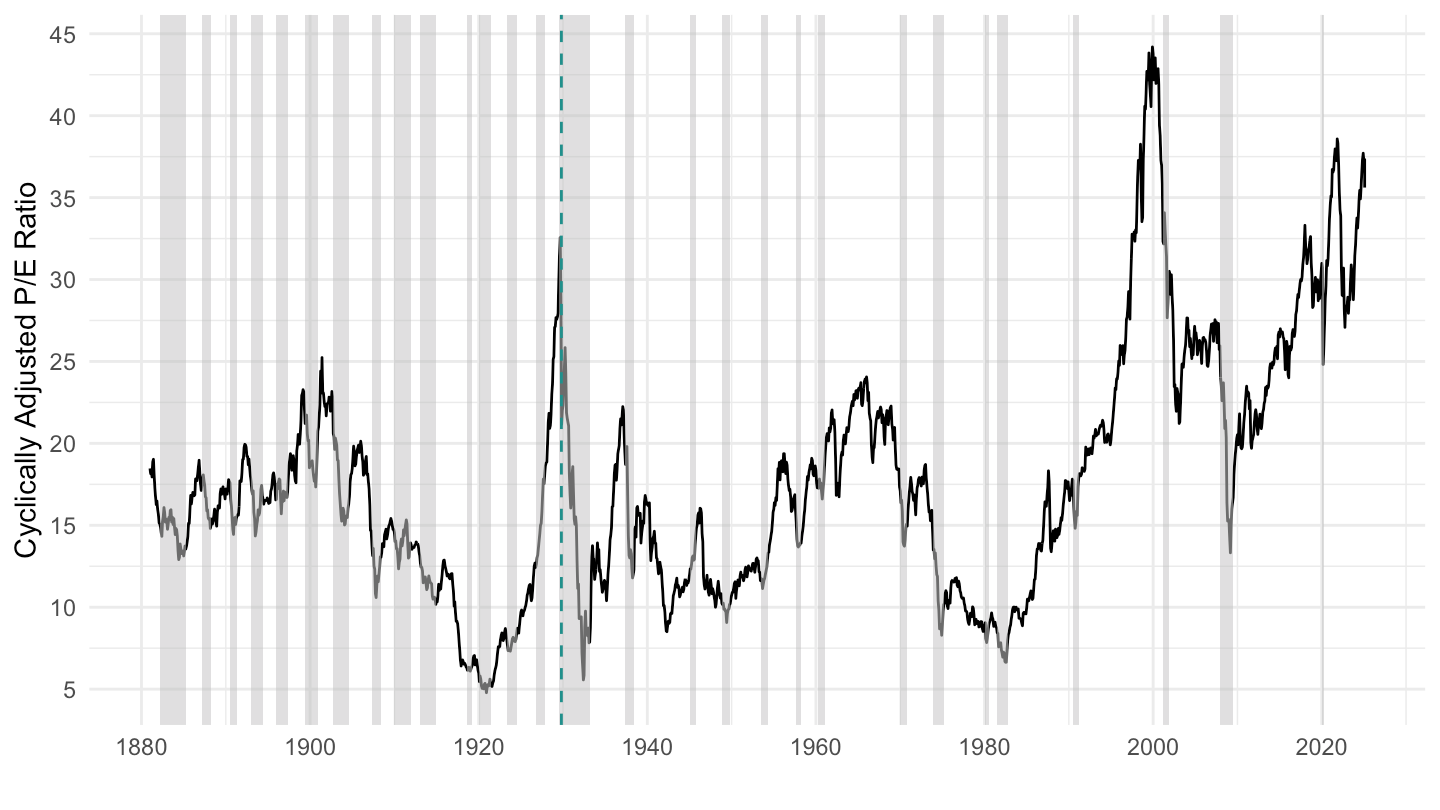
data |>
  select(date, CAPE) |>
  filter(date >= as.Date("1995-01-01")) |>
  na.omit() |>
  ggplot() + geom_line(aes(x = date, y = CAPE)) +
  ylab("Cyclically Adjusted P/E Ratio") +
  scale_x_date(breaks = as.Date(paste0(seq(1800, 2025, 2), "-01-01")),
               labels = date_format("%Y")) +
  geom_rect(data = nber_recessions |>
              filter(Peak >= as.Date("1995-01-01")),
            aes(xmin = Peak, xmax = Trough, ymin = -Inf, ymax = +Inf),
            fill = 'grey', alpha = 0.5) +
  scale_y_continuous(breaks = seq(5, 90, 5)) +
  theme_minimal() + xlab("")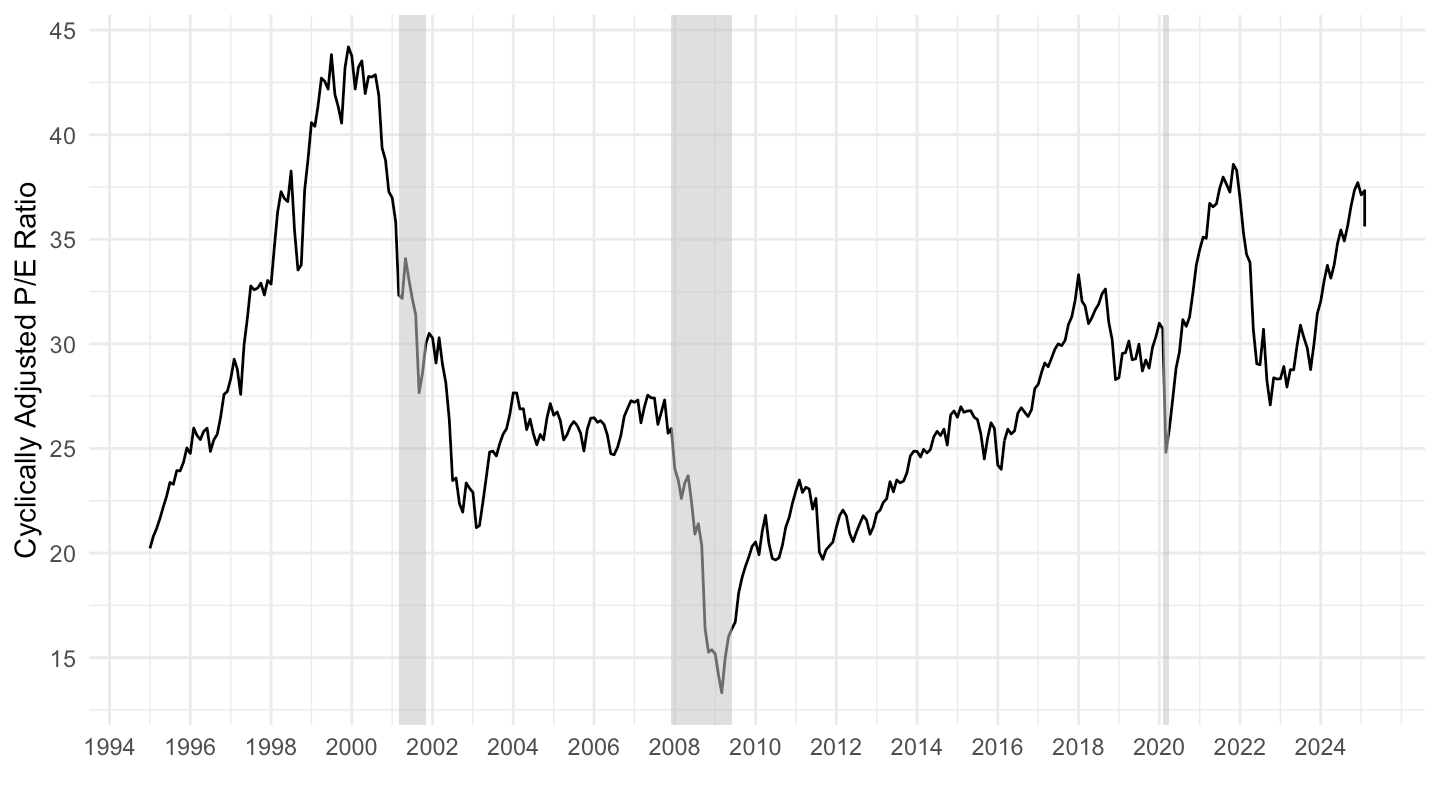
data |>
  select(date, CAPE) |>
  filter(date >= as.Date("1920-01-01"),
         date <= as.Date("1942-01-01")) |>
  na.omit() |>
  ggplot() + geom_line(aes(x = date, y = CAPE)) +
  ylab("Cyclically Adjusted P/E Ratio") +
  scale_x_date(breaks = as.Date(paste0(seq(1920, 1942, 2), "-01-01")),
               labels = date_format("%Y")) +
  geom_rect(data = nber_recessions |>
              filter(Peak > as.Date("1920-01-01"), Peak < as.Date("1942-01-01")),
            aes(xmin = Peak, xmax = Trough, ymin = -Inf, ymax = +Inf),
            fill = 'grey', alpha = 0.5) +
  scale_y_continuous(breaks = seq(5, 30, 5)) +
  theme_minimal() + xlab("") +
  geom_vline(xintercept = as.Date("1929-10-24"), linetype = "dashed", color = viridis(3)[2])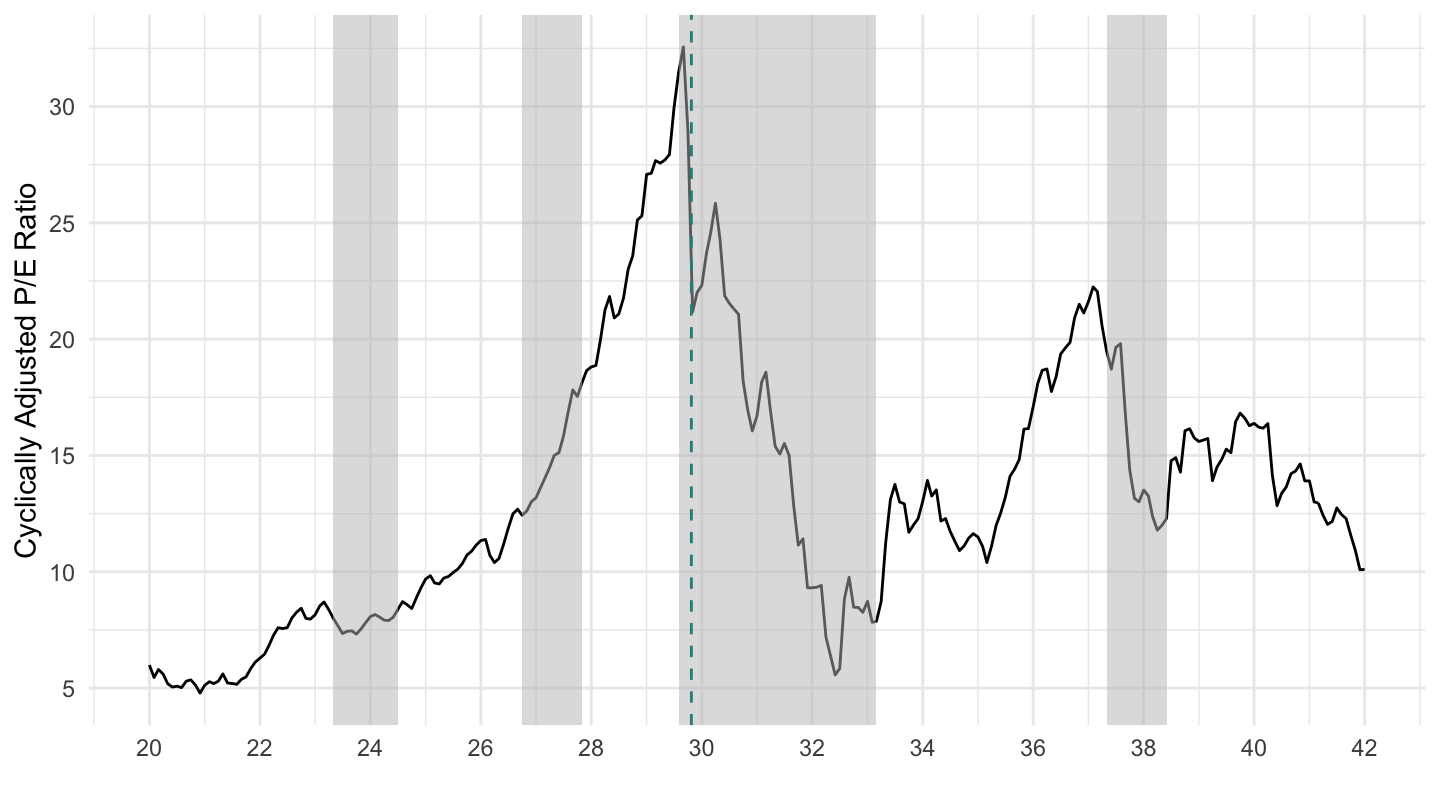
data |>
  filter(date <= as.Date("1940-01-01")) |>
  mutate(CPI = 100*CPI / CPI[date == as.Date("1923-01-01")]) |>
  ggplot() + geom_line(aes(x = date, y = CPI)) +
  ylab("U.S. Price Level (1871-1940)") + theme_minimal() + xlab("") +
  scale_x_date(breaks = c(nber_recessions$Peak),
               labels = date_format("%Y"),
               limits = c(1871, 1940) |> paste0("-01-01") |> as.Date()) +
  geom_rect(data = nber_recessions,
            aes(xmin = Peak, xmax = Trough, ymin = -Inf, ymax = +Inf),
            fill = 'grey', alpha = 0.5) +
  scale_y_continuous(breaks = seq(30, 150, 10)) +
  geom_vline(xintercept = as.Date("1933-04-20"), linetype = "dashed", color = viridis(3)[2])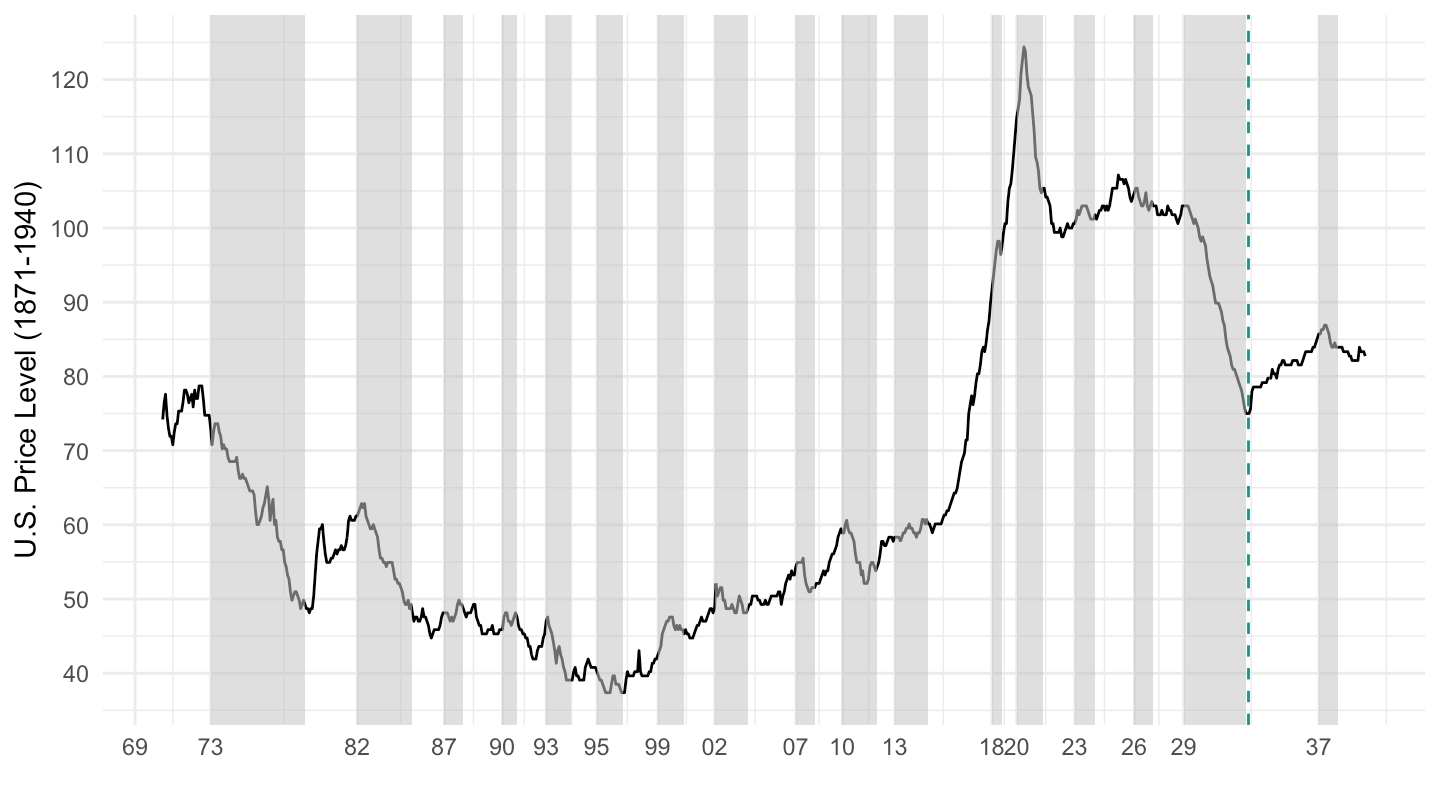
(ref:gold-standard-1920-1942) U.S. Prices (1920-1942)
data |>
  filter(date >= as.Date("1920-01-01"),
         date <= as.Date("1942-01-01")) |>
  mutate(CPI = 100*CPI / CPI[date == as.Date("1923-01-01")]) |>
  ggplot() + geom_line(aes(x = date, y = CPI)) +
  ylab("Price Level") + theme_minimal() + xlab("") +
  scale_x_date(breaks = c(nber_recessions$Peak, nber_recessions$Trough),
               labels = date_format("%Y"),
               limits = c(as.Date("1920-01-01"), as.Date("1942-01-01"))) +
  geom_rect(data = nber_recessions,
            aes(xmin = Peak, xmax = Trough, ymin = -Inf, ymax = +Inf),
            fill = 'grey', alpha = 0.5) +
  scale_y_continuous(breaks = seq(50, 400, 5)) +
  geom_vline(xintercept = as.Date("1933-04-20"), linetype = "dashed", color = viridis(3)[2])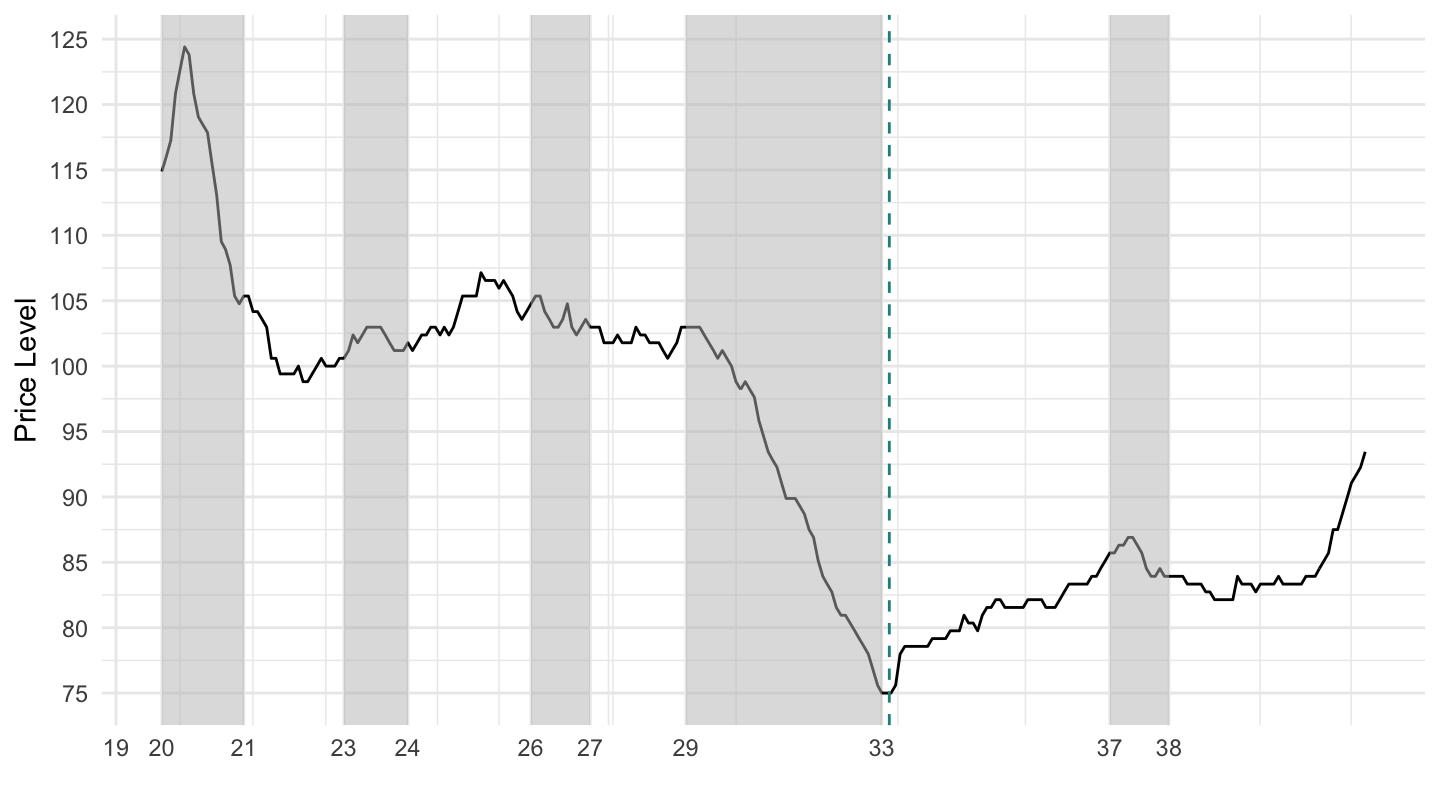
data |>
  select(date, CAPE) |>
  na.omit() |>
  filter(date >= as.Date("1980-01-01")) |>
  na.omit() |>
  ggplot() + geom_line(aes(x = date, y = 1/CAPE)) +
  ylab("Cyclically Adjusted Eearnings / Price Ratio") +
  scale_x_date(breaks = as.Date(paste0(seq(1980, 2100, 5), "-01-01")),
               labels = date_format("%Y"),) +
  geom_rect(data = nber_recessions |>
              filter(Peak > as.Date("1980-01-01")),
            aes(xmin = Peak, xmax = Trough, ymin = -Inf, ymax = +Inf),
            fill = 'grey', alpha = 0.5) +
  scale_y_continuous(breaks = 0.01*seq(0, 30, 1),
                     labels = scales::percent_format(accuracy = 1)) +
  theme_minimal() + xlab("")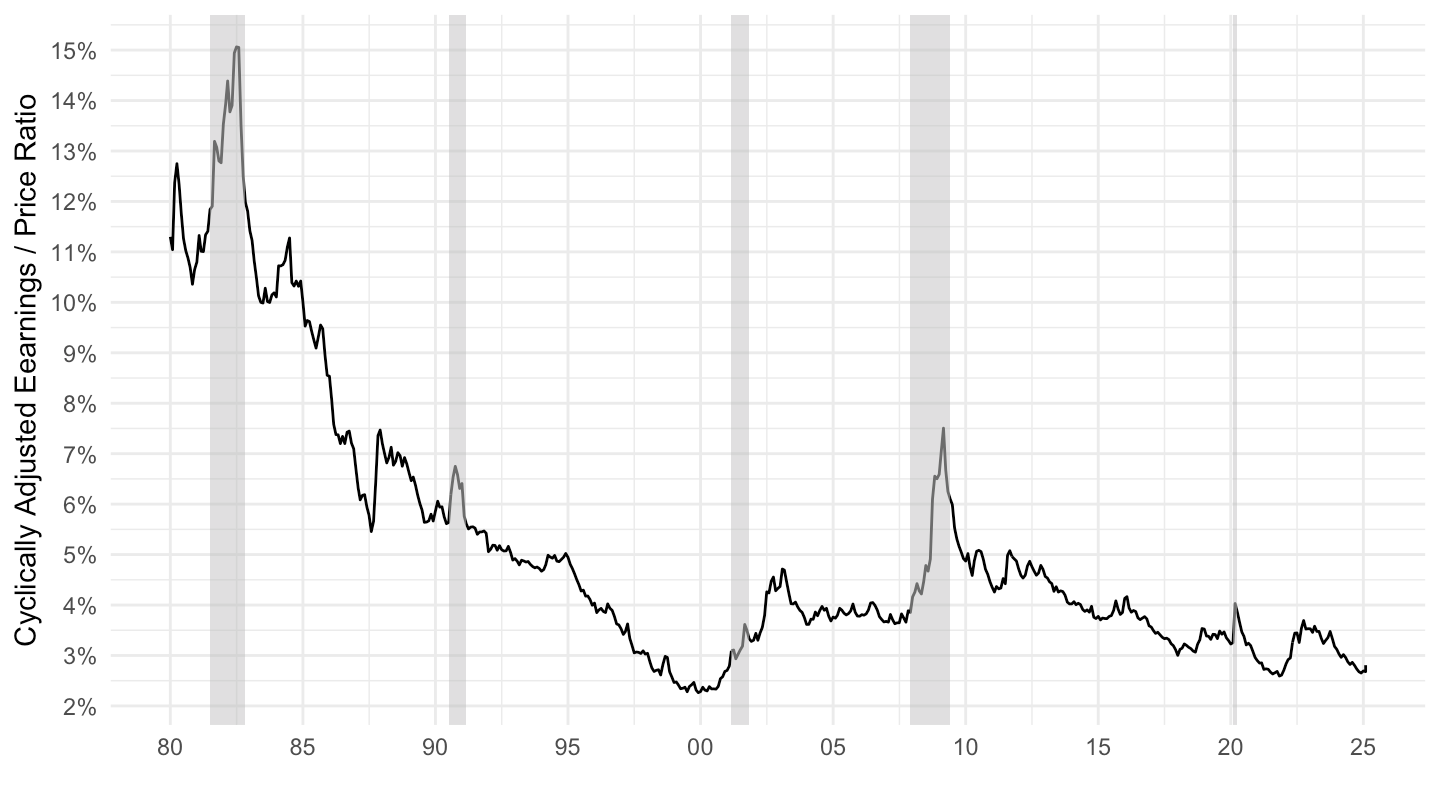
data |>
  mutate(dividend_yield = dividend / s_p_price,
         earnings_yield = earnings / s_p_price) |>
  select(date, dividend_yield, earnings_yield) |>
  gather(variable, value, -date) |>
  na.omit() |>
  filter(date >= as.Date("1980-01-01")) |>
  mutate(variable_desc = case_when(variable == "dividend_yield" ~ "Dividend Yield (%)",
                                   variable == "earnings_yield" ~ "Earnings Yield (%)")) |>
  na.omit() |>
  ggplot() + geom_line(aes(x = date, y = value, color = variable_desc)) +
  ylab("Dividend / Earnings Yield (%)") + xlab("") + theme_minimal() +
  scale_color_manual(values = viridis(3)[1:2]) +
  scale_x_date(breaks = as.Date(paste0(seq(1980, 2100, 5), "-01-01")),
               labels = date_format("%Y"),) +
  geom_rect(data = nber_recessions |>
              filter(Peak > as.Date("1980-01-01")),
            aes(xmin = Peak, xmax = Trough, ymin = -Inf, ymax = +Inf),
            fill = 'grey', alpha = 0.5) +
  theme(legend.position = c(0.45, 0.9),
        legend.title = element_blank()) +
  scale_y_continuous(breaks = 0.01*seq(0, 30, 1),
                     labels = scales::percent_format(accuracy = 1))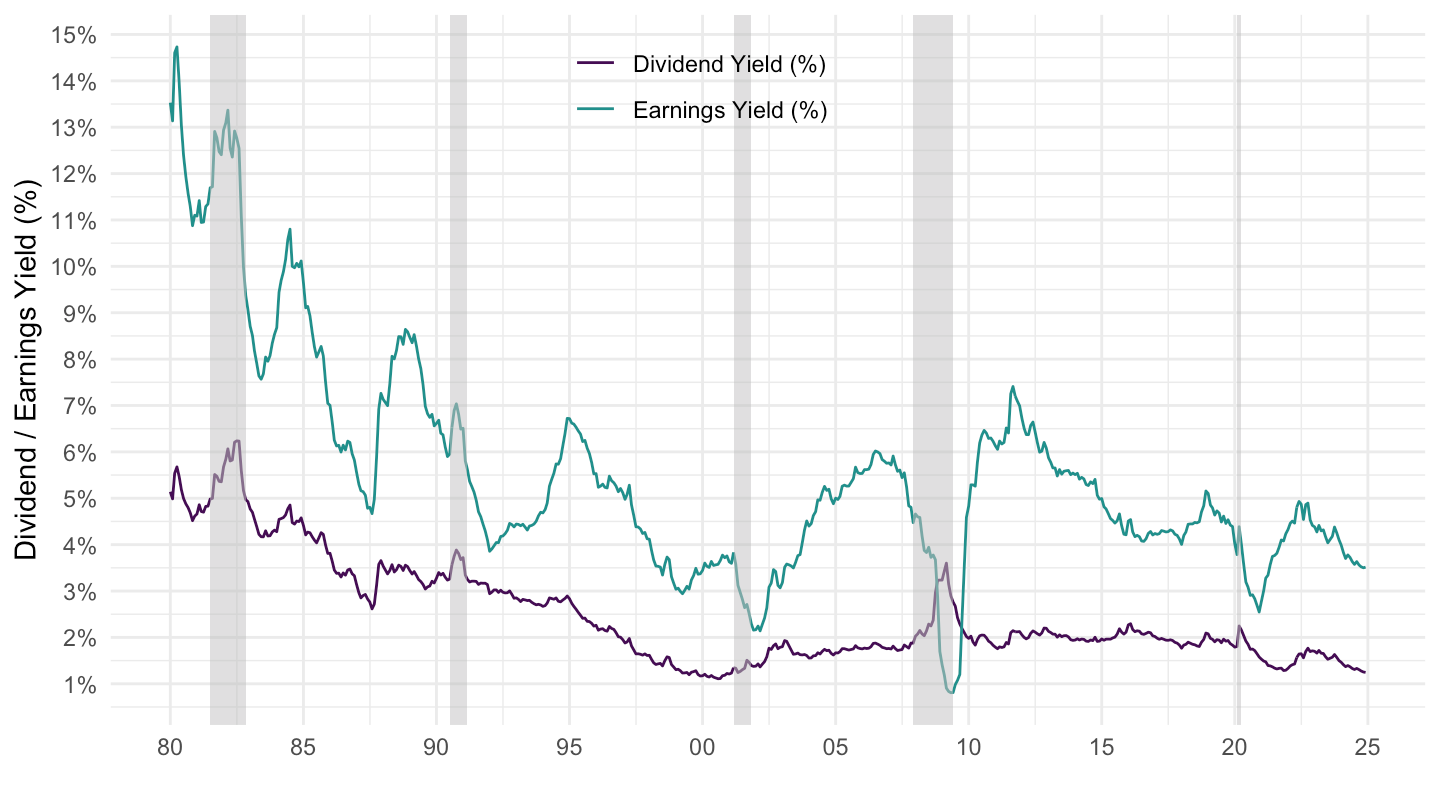
data |>
  select(date, CAPE) |>
  filter(date >= as.Date("1939-01-01"), date <= as.Date("1955-01-01")) |>
  na.omit() |>
  ggplot() + geom_line(aes(x = date, y = CAPE)) +
  ylab("Cyclically Adjusted P/E Ratio") +
  scale_x_date(breaks = as.Date(paste0(seq(1920, 1960, 2), "-01-01")),
               labels = date_format("%Y")) +
  geom_rect(data = nber_recessions |>
              filter(Peak > as.Date("1939-01-01"), Peak < as.Date("1955-01-01")),
            aes(xmin = Peak, xmax = Trough, ymin = -Inf, ymax = +Inf),
            fill = 'grey', alpha = 0.5) +
  scale_y_continuous(breaks = seq(5, 30, 1)) +
  theme_minimal() + xlab("")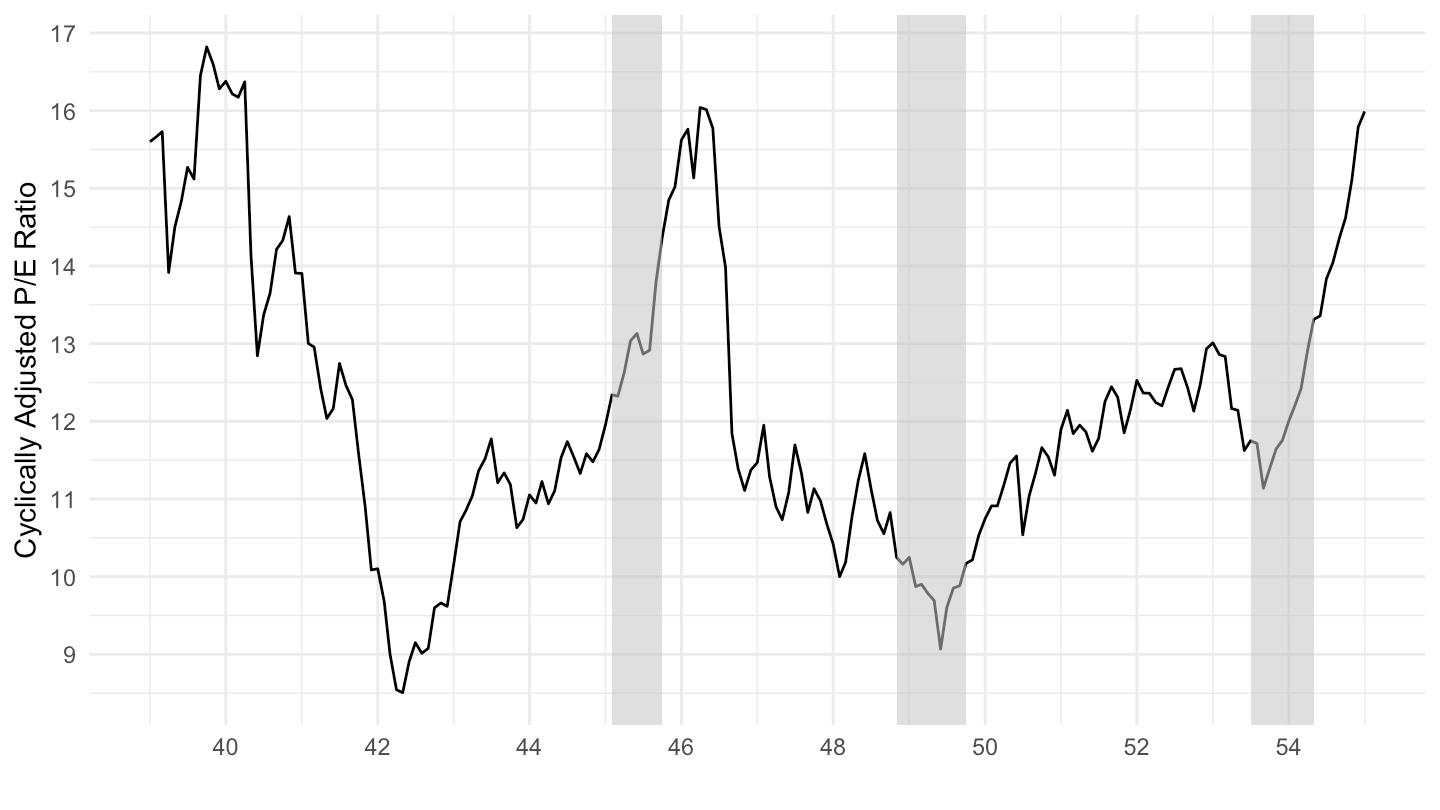
data |>
  select(date, CAPE) |>
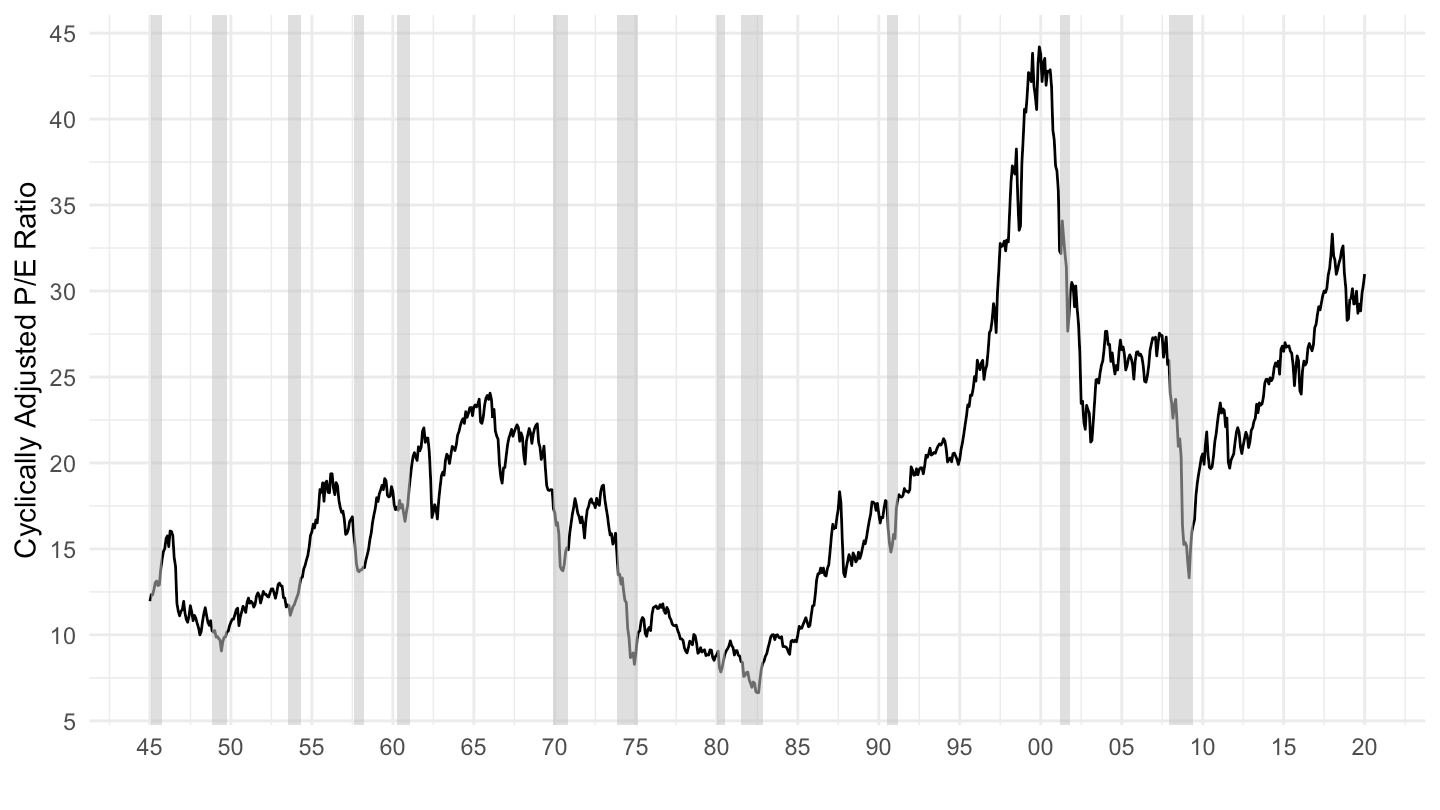
  filter(date >= as.Date("1945-01-01"), date <= as.Date("2020-01-01")) |>
  na.omit() |>
  ggplot() + geom_line(aes(x = date, y = CAPE)) +
  ylab("Cyclically Adjusted P/E Ratio") +
  scale_x_date(breaks = as.Date(paste0(seq(1920, 2100, 5), "-01-01")),
               labels = date_format("%Y")) +
  scale_y_continuous(breaks = seq(0, 100, 5)) +
  geom_rect(data = nber_recessions |>
              filter(Peak > as.Date("1945-01-01"), Peak < as.Date("2020-01-01")),
            aes(xmin = Peak, xmax = Trough, ymin = -Inf, ymax = +Inf),
            fill = 'grey', alpha = 0.5) +
  theme_minimal() + xlab("")