M² d’espaces verts supplémentaires

Données - Ville de Paris

Code
source(here::here("_rinit.R"))
invisible(Sys.setlocale("LC_TIME", "fr_FR.UTF-8"))
# cd ~/iCloud/website/data/paris; /usr/local/bin/R -e 'quarto::quarto_render("espaces_verts_supplementaires.qmd")'

knitr::opts_chunk$set(echo = TRUE, message = FALSE, warning = FALSE,
                      fig.width = 8, fig.height = 4.6, dpi = 150)

evs_path <- here::here("data", "paris", "espaces_verts_supplementaires.parquet")
evs <- arrow::read_parquet(evs_path) |>
  dplyr::mutate(
    annee   = as.integer(format(date_fin_t, "%Y")),
    ha      = ind_ev_suppl / 1e4,
    arrond  = as.integer(arrond)
  )

n_tot     <- nrow(evs)
total_ha  <- sum(evs$ha)
objectif  <- 30

theme_barres <- theme_minimal(base_size = 12) +
  theme(plot.title = element_text(face = "bold"),
        plot.subtitle = element_text(colour = "grey35"),
        panel.grid.major.y = element_blank())

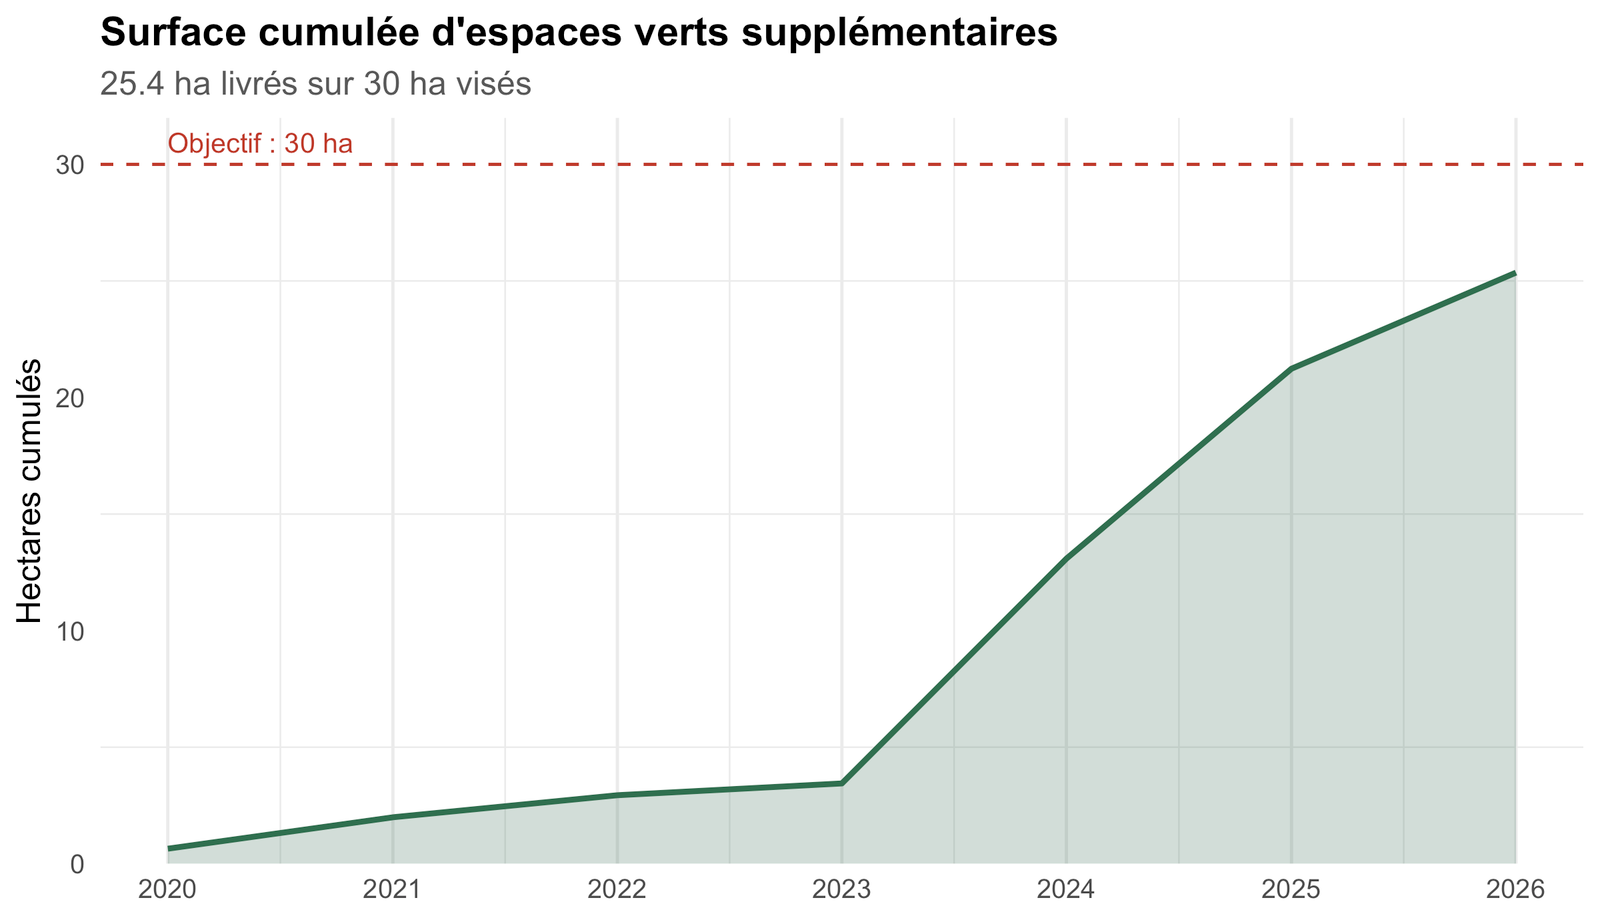
Cet indicateur suit l’objectif de mandature de la Ville de Paris : créer 30 hectares d’espaces verts supplémentaires. Chaque ligne est un projet (ouverture au public d’une friche, transformation d’une cour en jardin, extension d’un square…) avec sa surface nouvellement végétalisée et sa date de livraison.

Code
cat(sprintf(
  "\n**%d projets** ont livré **%.1f ha** au total, soit **%s de l'objectif de %d ha**.\n",
  n_tot, total_ha, scales::percent(total_ha / objectif, 1), objectif))

64 projets ont livré 25.4 ha au total, soit 85% de l’objectif de 30 ha.

Code
evs |>
  dplyr::arrange(dplyr::desc(date_fin_t)) |>
  dplyr::transmute(Projet = nom_projet, Arrondissement = arrond,
                   `Livraison` = date_fin_t, `Surface (m²)` = ind_ev_suppl) |>
  head(8) |>
  gt::gt() |>
  gt::fmt_number(columns = `Surface (m²)`, decimals = 0, sep_mark = " ") |>
  gt::tab_header(title = "8 projets les plus récents") |>
  gt::tab_options(table.width = "100%")
8 projets les plus récents
Projet Arrondissement Livraison Surface (m²)
Jardin parvis devant le lycée Paul Valéry 12 2026-01-01 5 340
Ouverture au public du jardin de la place Nationale 13 2026-01-01 1 574
Ouverture au public des jardins du Val de Grâce 5 2026-01-01 16 151
Rénovation parvis Olympe de Gouge et square Marcel Rajman 11 2026-01-01 511
Ouverture au public PC19 - Ferme du Rail / Petit 19 2026-01-01 5 040
Extension de la promenade Péreire 17 2026-01-01 2 148
Végétalisation du CS Georges Carpentier - phase 1 13 2026-01-01 2 486
Végétalisation - Réservoir de Grenelle 15 2026-01-01 2 000

Vers l’objectif des 30 hectares

Code
# Les dates de livraison sont au 1er janvier de l'année (pas de jour réel) --
# plusieurs projets partagent donc le même x ; agréger par année avant de
# cumuler évite un polygone en dents de scie côté geom_area().
evs |>
  dplyr::group_by(date_fin_t) |>
  dplyr::summarise(ha = sum(ha), .groups = "drop") |>
  dplyr::arrange(date_fin_t) |>
  dplyr::mutate(cumul_ha = cumsum(ha)) |>
  ggplot(aes(date_fin_t, cumul_ha)) +
  geom_area(fill = "#2f6f4f", alpha = 0.25) +
  geom_line(colour = "#2f6f4f", linewidth = 1) +
  geom_hline(yintercept = objectif, linetype = "dashed", colour = "#c0392b") +
  annotate("text", x = min(evs$date_fin_t), y = objectif, label = "Objectif : 30 ha",
           colour = "#c0392b", vjust = -0.6, hjust = 0, size = 3.5) +
  scale_x_date(date_labels = "%Y", date_breaks = "1 year") +
  scale_y_continuous(limits = c(0, objectif + 2), expand = expansion(mult = c(0, 0))) +
  labs(title = "Surface cumulée d'espaces verts supplémentaires",
       subtitle = paste0(scales::number(total_ha, 0.1), " ha livrés sur ", objectif, " ha visés"),
       x = NULL, y = "Hectares cumulés") +
  theme_barres

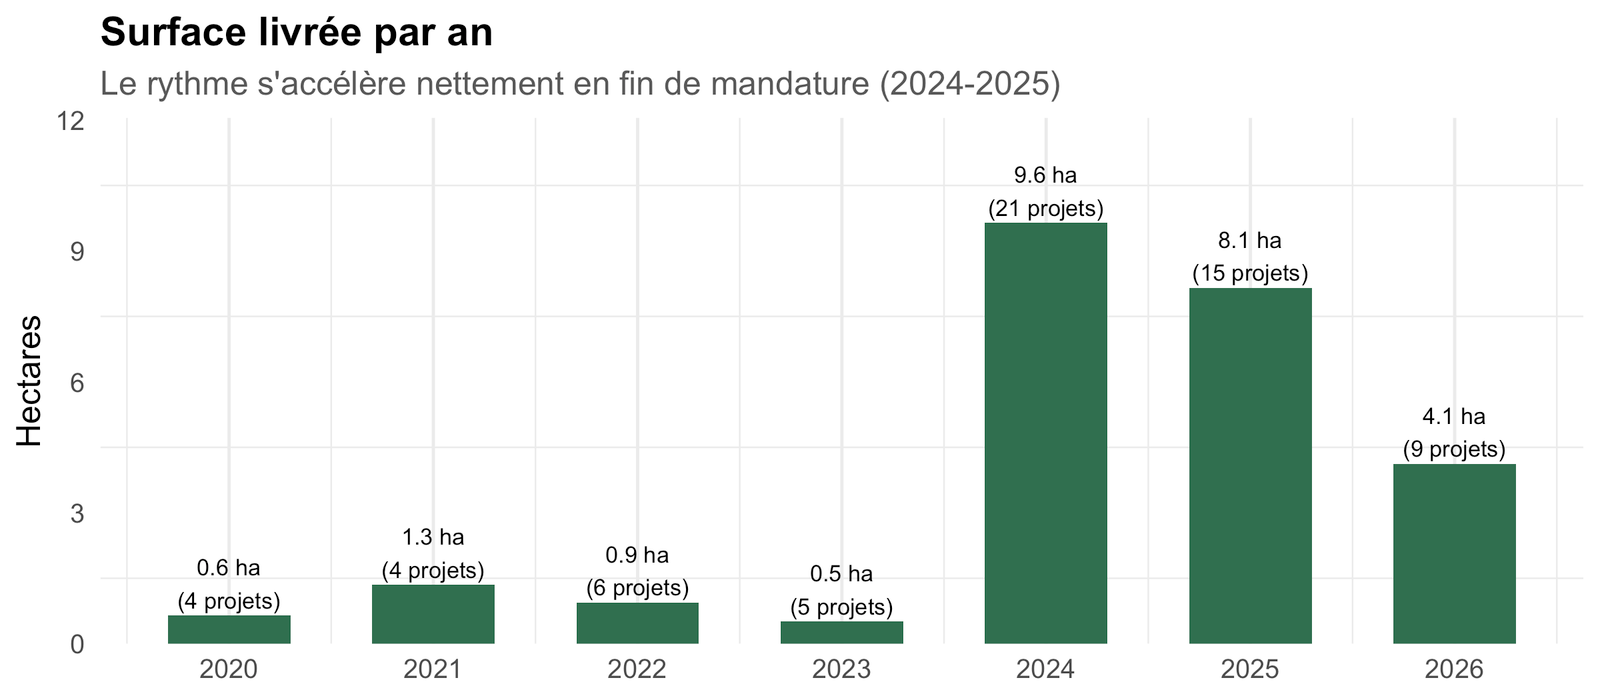
Par an

Code
evs |>
  dplyr::group_by(annee) |>
  dplyr::summarise(ha = sum(ha), n = dplyr::n(), .groups = "drop") |>
  ggplot(aes(annee, ha)) +
  geom_col(fill = "#2f6f4f", width = 0.6) +
  geom_text(aes(label = sprintf("%.1f ha\n(%d projets)", ha, n)), vjust = -0.15, size = 2.9) +
  scale_x_continuous(breaks = scales::breaks_width(1)) +
  scale_y_continuous(expand = expansion(mult = c(0, 0.25))) +
  labs(title = "Surface livrée par an",
       subtitle = "Le rythme s'accélère nettement en fin de mandature (2024-2025)",
       x = NULL, y = "Hectares") +
  theme_barres

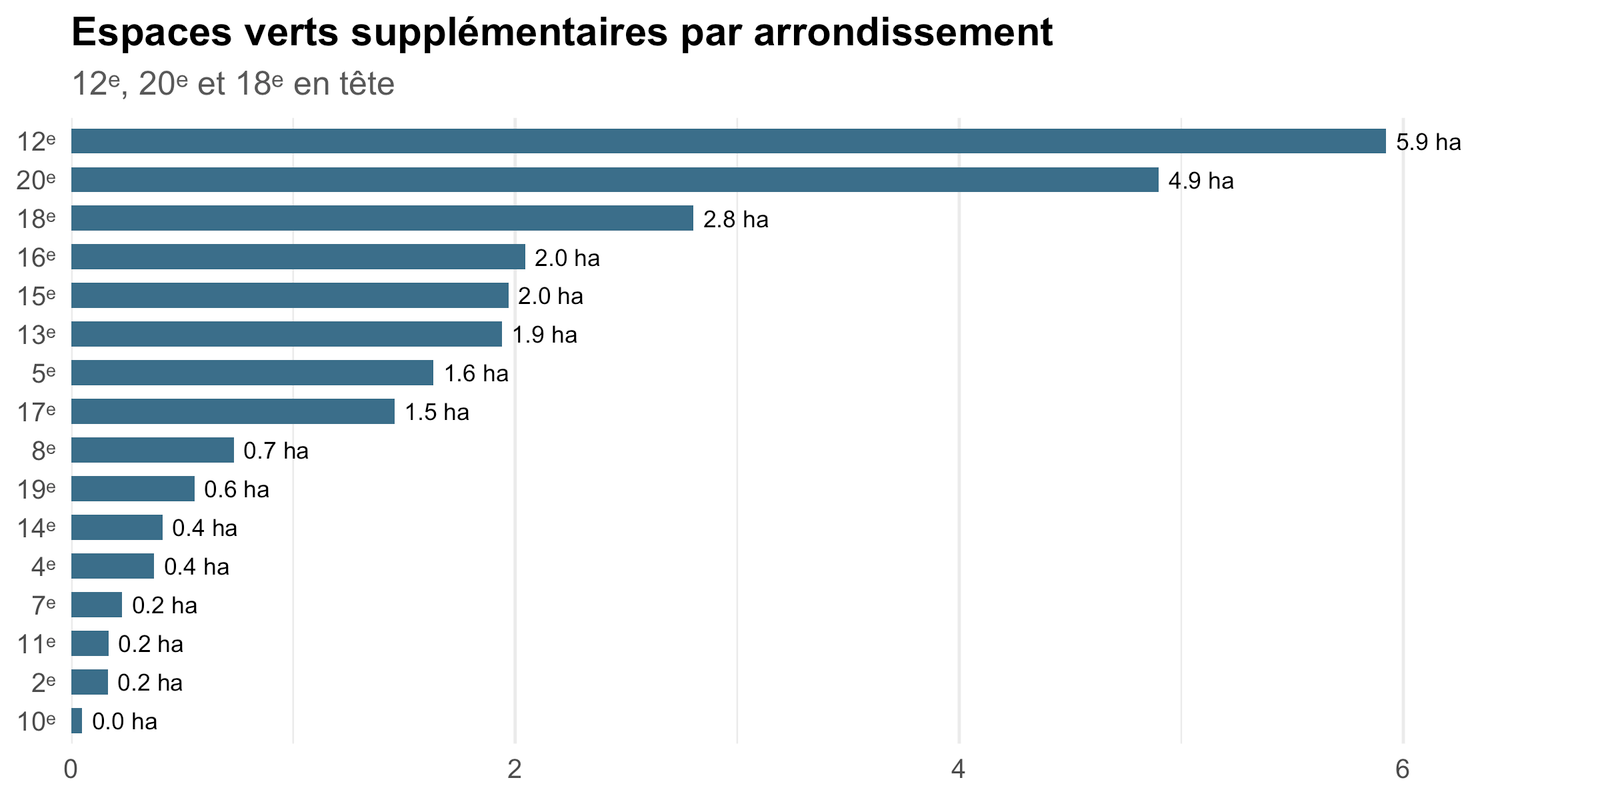
Par arrondissement

Code
evs |>
  dplyr::group_by(arrond) |>
  dplyr::summarise(ha = sum(ha), n = dplyr::n(), .groups = "drop") |>
  dplyr::mutate(arrond = forcats::fct_reorder(paste0(arrond, "ᵉ"), ha)) |>
  ggplot(aes(ha, arrond)) +
  geom_col(fill = "#3b6f8a", width = 0.65) +
  geom_text(aes(label = sprintf("%.1f ha", ha)), hjust = -0.15, size = 3) +
  scale_x_continuous(expand = expansion(mult = c(0, 0.15))) +
  labs(title = "Espaces verts supplémentaires par arrondissement",
       subtitle = "12ᵉ, 20ᵉ et 18ᵉ en tête",
       x = NULL, y = NULL) +
  theme_barres

Tous les projets

Code
evs |>
  dplyr::arrange(dplyr::desc(date_fin_t)) |>
  dplyr::transmute(Projet = nom_projet, Arrondissement = arrond,
                   Livraison = date_fin_t, `Surface (m²)` = ind_ev_suppl) |>
  reactable::reactable(
    searchable = TRUE,
    filterable = TRUE,
    pagination = TRUE,
    defaultPageSize = 20,
    compact = TRUE,
    resizable = TRUE,
    highlight = TRUE,
    wrap = TRUE,
    defaultColDef = reactable::colDef(
      align = "left",
      headerStyle = list(fontWeight = "bold"),
      style = list(whiteSpace = "normal", wordBreak = "break-word")
    ),
    columns = list(
      Projet = reactable::colDef(minWidth = 260),
      Arrondissement = reactable::colDef(minWidth = 70, maxWidth = 120),
      Livraison = reactable::colDef(minWidth = 90, maxWidth = 110),
      `Surface (m²)` = reactable::colDef(minWidth = 90, maxWidth = 120, align = "right",
                                        format = reactable::colFormat(separators = TRUE))
    )
  )

Source & données

Code
tibble::tibble(
  ` ` = c("Jeu de données", "Producteur", "Licence", "Fichier", "Mise à jour", "Observations"),
  `  ` = c(
    "[M² d'espaces verts supplémentaires](https://opendata.paris.fr/explore/dataset/espaces_verts_supplementaires/information/)",
    "Direction des Espaces Verts et de l'Environnement (DEVE) — Ville de Paris",
    "Licence Ouverte (Etalab)",
    sprintf("`data/paris/espaces_verts_supplementaires.parquet` (%s ko)", round(file.size(evs_path) / 1024)),
    format(as.Date(file.mtime(evs_path)), "%d %B %Y"),
    sprintf("%d projets, %.1f ha au total (%s de l'objectif de %d ha)",
            n_tot, total_ha, scales::percent(total_ha / objectif, 1), objectif)
  )
) |>
  gt::gt() |> gt::fmt_markdown(columns = `  `) |>
  gt::tab_options(table.width = "100%", column_labels.hidden = TRUE)
Jeu de données M² d’espaces verts supplémentaires
Producteur Direction des Espaces Verts et de l’Environnement (DEVE) — Ville de Paris
Licence Licence Ouverte (Etalab)
Fichier data/paris/espaces_verts_supplementaires.parquet (4 ko)
Mise à jour 04 septembre 2026
Observations 64 projets, 25.4 ha au total (85% de l’objectif de 30 ha)