Arbres plantés par la Ville de Paris, par projet

Données - Ville de Paris

Code
source(here::here("_rinit.R"))
invisible(Sys.setlocale("LC_TIME", "fr_FR.UTF-8"))
invisible(Sys.setenv(TZ = "Europe/Paris"))
# cd ~/iCloud/website/data/paris; /usr/local/bin/R -e 'quarto::quarto_render("arbres-plantes-par-projet.qmd")'

source(here::here("data", "paris", "_paris.R"))   # wkb2sfc(), paris_basemap()

knitr::opts_chunk$set(echo = TRUE, message = FALSE, warning = FALSE,
                      fig.width = 8, fig.height = 4.6, dpi = 150)

P <- here::here("data", "paris")
plantes <- arrow::read_parquet(file.path(P, "arbres-plantes-par-projet.parquet"))
arrondissements <- arrow::read_parquet(file.path(P, "arrondissements.parquet"))

plantes <- plantes |>
  dplyr::mutate(
    arbres  = dplyr::coalesce(ind_arb_plant, 0),
    budget  = budget_prev,
    type    = ope_type
  )

n_proj  <- nrow(plantes)
n_arbre <- sum(plantes$arbres, na.rm = TRUE)

arr_sf <- arrondissements |>
  dplyr::transmute(c_ar, nom = l_aroff, geometry = wkb2sfc(geom)) |>
  sf::st_as_sf(crs = 4326)
proj_sf <- plantes |>
  dplyr::mutate(geometry = wkb2sfc(geo_point_2d)) |>
  sf::st_as_sf(crs = 4326)

theme_carte <- theme_void(base_size = 12) +
  theme(plot.title = element_text(face = "bold"),
        plot.subtitle = element_text(colour = "grey35"), legend.position = "right")
theme_barres <- theme_minimal(base_size = 12) +
  theme(plot.title = element_text(face = "bold"),
        plot.subtitle = element_text(colour = "grey35"),
        panel.grid.major.y = element_blank())

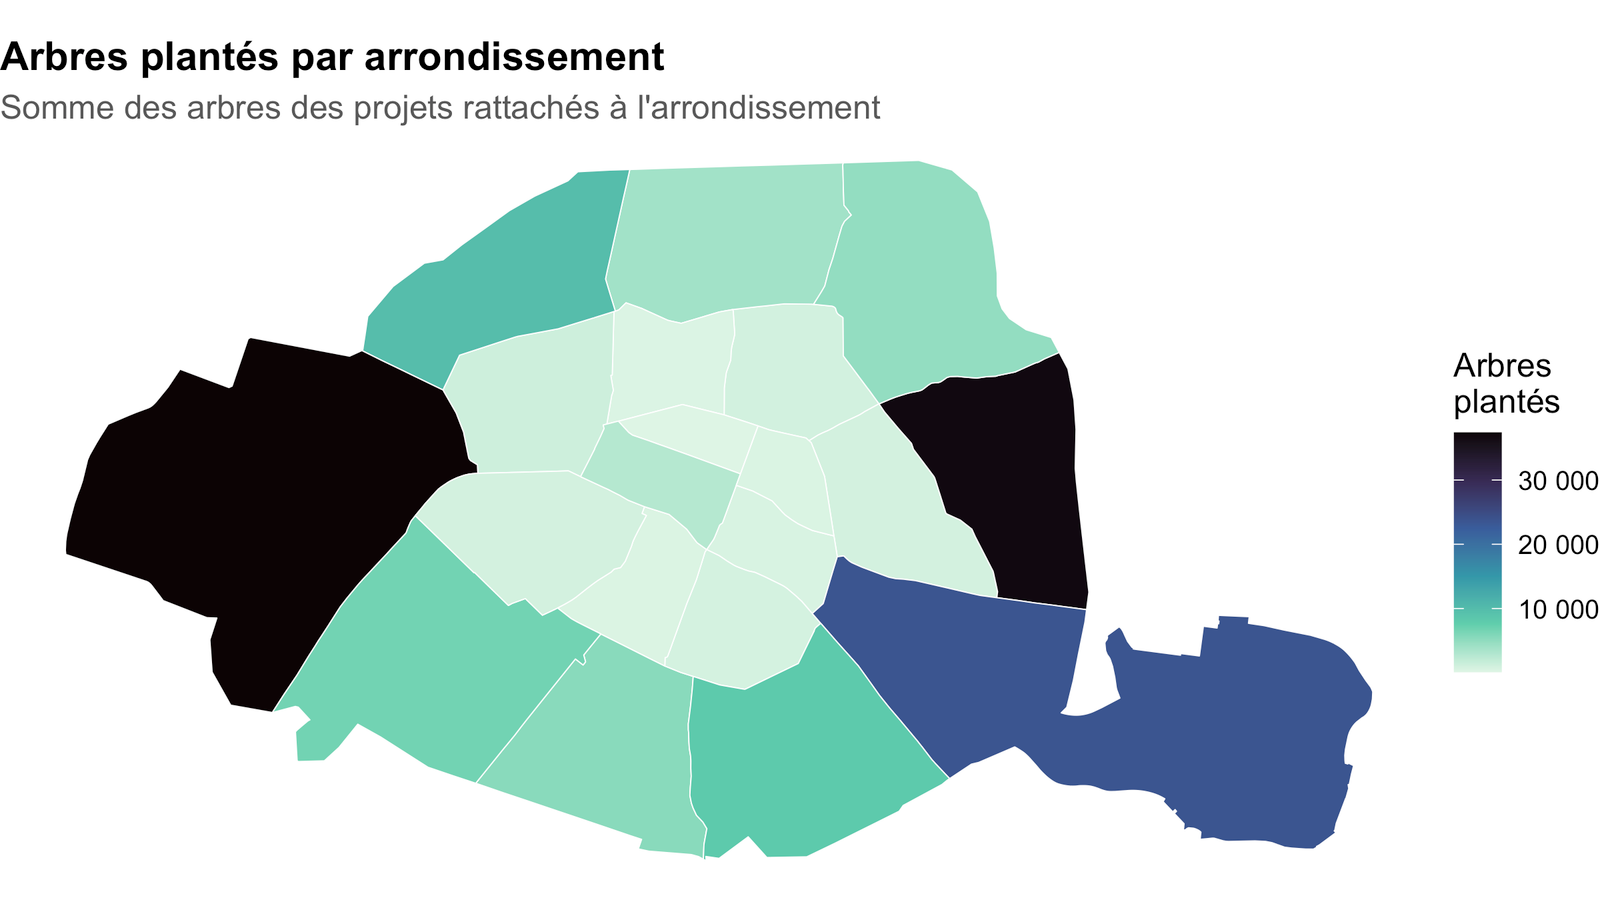
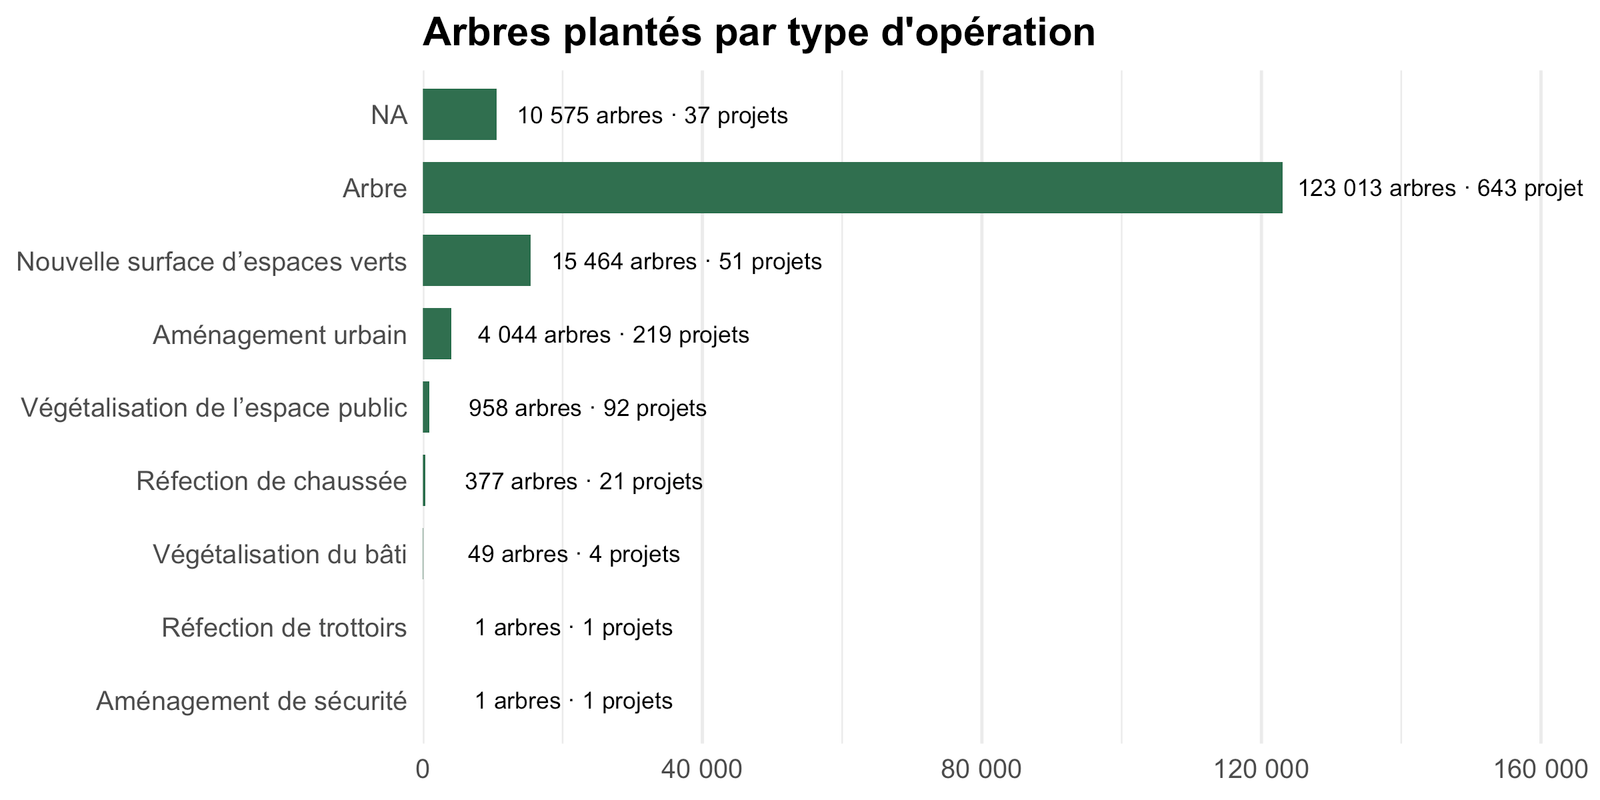
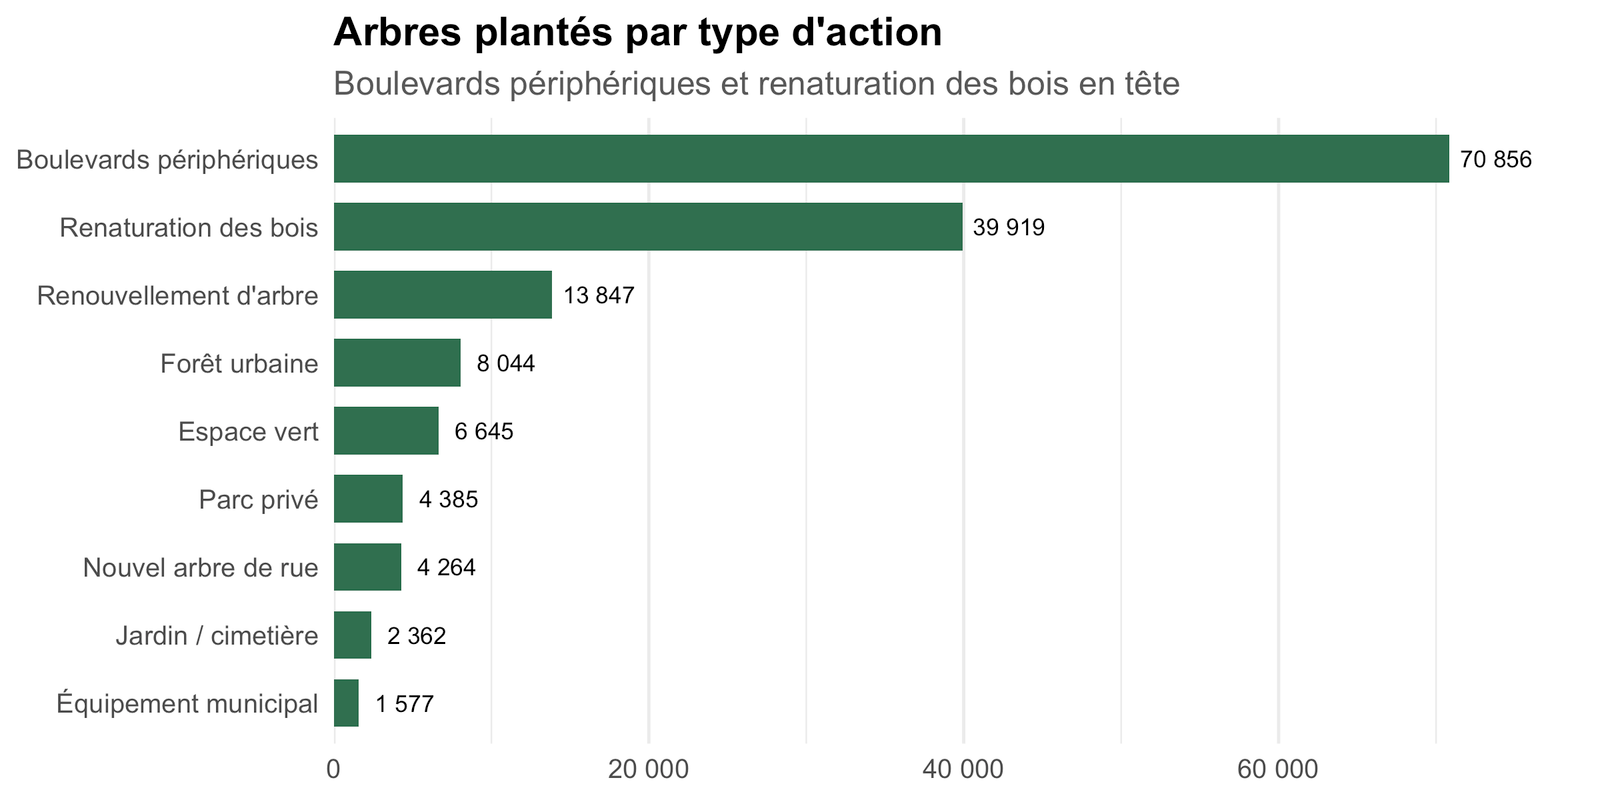
1 069 projets de plantation de la Direction des Espaces Verts et de l’Environnement, totalisant 154 482 arbres plantés. Chaque projet a une emprise géographique, un type d’opération (plantation d’arbres, végétalisation, aménagement…), un budget prévisionnel et une ventilation par type d’action (rue, forêt urbaine, espace vert, boulevards périphériques, renaturation des bois…).

C’est le pendant « plantation » du jeu arbres abattus pour raisons sanitaires.

Code
plantes |>
  dplyr::arrange(dplyr::desc(arbres)) |>
  dplyr::transmute(
    Projet = nom_projet, Arrondissement = arrond, `Type d'opération` = type,
    `Arbres plantés` = arbres, `Budget prév. (€)` = budget, Statut = ope_statut
  ) |>
  head(12) |>
  gt::gt() |>
  gt::fmt_number(columns = c(`Arbres plantés`, `Budget prév. (€)`), decimals = 0, sep_mark = " ") |>
  gt::sub_missing(missing_text = "—") |>
  gt::tab_options(table.width = "100%")
Projet Arrondissement Type d'opération Arbres plantés Budget prév. (€) Statut
Ouverture au public PC20 - Cours de Vincennes / rue du Volga 20 Nouvelle surface d’espaces verts 7 519 Réalisé
Replantations Bois de Boulogne 2023-2024 - Beauregard 21 Arbre 7 000 Réalisé
ARB - TALUS BP 30-03 ZAC PYTHON-DUVERNOIS 20 Arbre 6 000 Réalisé
Replantations Bois de Boulogne 2021-2022 16 3 830 Réalisé
Replantations Bois de Vincennes 2022- 2023 12 3 500 Réalisé
Replantations Bois de Boulogne 2023-2024 16 Arbre 3 121 Réalisé
ARB - TALUS BP 12-01 16 Arbre 3 100 Réalisé
ARB - TALUS BP 02-03 Porte de Choisy 13 Arbre 3 000 Réalisé
ARB - TALUS BP 28-03 - 23 / 24 20 Arbre 2 850 Réalisé
Parc André Citroën (rénovation des serres et du grand canal) 15 Nouvelle surface d’espaces verts 2 716 Réalisé
ARB - TALUS BP 17-01 Bd d'Aurelle de Paladines 17 Arbre 2 700 Réalisé
Replantations Bois de Boulogne 2024-2025 16 Arbre 2 660 Réalisé

Carte des projets

Code
cnt <- plantes |>
  dplyr::filter(!is.na(arrond), arrond %in% 1:20) |>
  dplyr::group_by(arrond) |>
  dplyr::summarise(arbres = sum(arbres, na.rm = TRUE), .groups = "drop")

arr_sf |>
  dplyr::left_join(cnt, by = c("c_ar" = "arrond")) |>
  ggplot() +
  geom_sf(aes(fill = arbres), colour = "white", linewidth = 0.2) +
  scale_fill_viridis_c(option = "mako", direction = -1, na.value = "grey92",
                       labels = scales::label_number(big.mark = " "), name = "Arbres\nplantés") +
  labs(title = "Arbres plantés par arrondissement",
       subtitle = "Somme des arbres des projets rattachés à l'arrondissement") +
  theme_carte

Carte interactive

Code
pal <- colorFactor("Dark2", domain = sort(unique(proj_sf$type)))

leaflet(proj_sf, options = leafletOptions(minZoom = 11)) |>
  paris_basemap() |>
  addPolygons(data = arr_sf, fill = FALSE, color = "#999", weight = 1) |>
  addCircleMarkers(
    radius = ~pmax(3, pmin(18, sqrt(arbres))), stroke = FALSE, fillOpacity = 0.75,
    fillColor = ~pal(type),
    label = ~sprintf("%s — %s arbres", nom_projet, format(arbres, big.mark = " ")),
    popup = ~sprintf("<b>%s</b><br>%s<br>Arbres plantés : <b>%s</b><br>Budget prév. : %s",
                     nom_projet, type, format(arbres, big.mark = " "),
                     ifelse(is.na(budget), "n.c.",
                            paste0(format(round(budget), big.mark = " "), " €")))
  ) |>
  addLegend("bottomright", pal = pal, values = ~type, title = "Type d'opération", opacity = 0.9)

Rayon des cercles ∝ √(nombre d’arbres du projet).

Ce que disent les projets

Code
plantes |>
  dplyr::group_by(type) |>
  dplyr::summarise(projets = dplyr::n(), arbres = sum(arbres, na.rm = TRUE), .groups = "drop") |>
  dplyr::mutate(type = forcats::fct_reorder(type, arbres)) |>
  ggplot(aes(arbres, type)) +
  geom_col(fill = "#2f6f4f", width = 0.7) +
  geom_text(aes(label = sprintf("%s arbres · %d projets", format(arbres, big.mark = " "), projets)),
            hjust = -0.05, size = 3) +
  scale_x_continuous(labels = scales::label_number(big.mark = " "),
                     expand = expansion(mult = c(0, 0.35))) +
  labs(title = "Arbres plantés par type d'opération",
       x = NULL, y = NULL) +
  theme_barres

Code
plantes |>
  dplyr::summarise(dplyr::across(dplyr::starts_with("act_"), \(x) sum(x, na.rm = TRUE))) |>
  tidyr::pivot_longer(dplyr::everything(), names_to = "action", values_to = "arbres") |>
  dplyr::mutate(action = dplyr::recode(action,
    act_new_arbre_rue    = "Nouvel arbre de rue",
    act_foret_urb        = "Forêt urbaine",
    act_esp_vert         = "Espace vert",
    act_bd_periph        = "Boulevards périphériques",
    act_renaturer_bois   = "Renaturation des bois",
    act_arbre_jard_cim   = "Jardin / cimetière",
    act_arbre_eq_municip = "Équipement municipal",
    act_arbre_parc_priv  = "Parc privé",
    act_renew_arbre      = "Renouvellement d'arbre"),
    action = forcats::fct_reorder(action, arbres)) |>
  ggplot(aes(arbres, action)) +
  geom_col(fill = "#2f6f4f", width = 0.7) +
  geom_text(aes(label = format(arbres, big.mark = " ")), hjust = -0.15, size = 3) +
  scale_x_continuous(labels = scales::label_number(big.mark = " "),
                     expand = expansion(mult = c(0, 0.12))) +
  labs(title = "Arbres plantés par type d'action",
       subtitle = "Boulevards périphériques et renaturation des bois en tête",
       x = NULL, y = NULL) +
  theme_barres

Code
b <- dplyr::filter(plantes, !is.na(budget))
cat(sprintf(
  "\nUn **budget prévisionnel** est renseigné pour %s des %s projets, pour un total de **%s** (les grosses opérations d'aménagement, souvent sans arbres comptabilisés ici, pèsent le plus).\n",
  format(nrow(b), big.mark = " "), format(n_proj, big.mark = " "),
  scales::dollar(sum(b$budget), prefix = "", suffix = " €", big.mark = " ", accuracy = 1e5)))

Un budget prévisionnel est renseigné pour 229 des 1 069 projets, pour un total de 235 600 000 € (les grosses opérations d’aménagement, souvent sans arbres comptabilisés ici, pèsent le plus).

Source & données

Code
plantes_path <- file.path(P, "arbres-plantes-par-projet.parquet")
tibble::tibble(
  ` ` = c("Jeu de données", "Producteur", "Licence", "Fichiers", "Mise à jour", "Observations"),
  `  ` = c(
    "[Arbres plantés](https://opendata.paris.fr/explore/dataset/arbres-plantes-par-projet/)",
    "Direction des Espaces Verts et de l'Environnement (DEVE) — Ville de Paris",
    "Open Database License (ODbL)",
    sprintf("`data/paris/arbres-plantes-par-projet.parquet` (%s ko) + `arrondissements.parquet`",
            round(file.size(plantes_path) / 1024)),
    format(as.Date(file.mtime(plantes_path)), "%d %B %Y"),
    sprintf("%s projets, %s arbres", format(n_proj, big.mark = " "), format(n_arbre, big.mark = " "))
  )
) |>
  gt::gt() |> gt::fmt_markdown(columns = `  `) |>
  gt::tab_options(table.width = "100%", column_labels.hidden = TRUE)
Jeu de données Arbres plantés
Producteur Direction des Espaces Verts et de l’Environnement (DEVE) — Ville de Paris
Licence Open Database License (ODbL)
Fichiers data/paris/arbres-plantes-par-projet.parquet (332 ko) + arrondissements.parquet
Mise à jour 04 septembre 2026
Observations 1 069 projets, 154 482 arbres