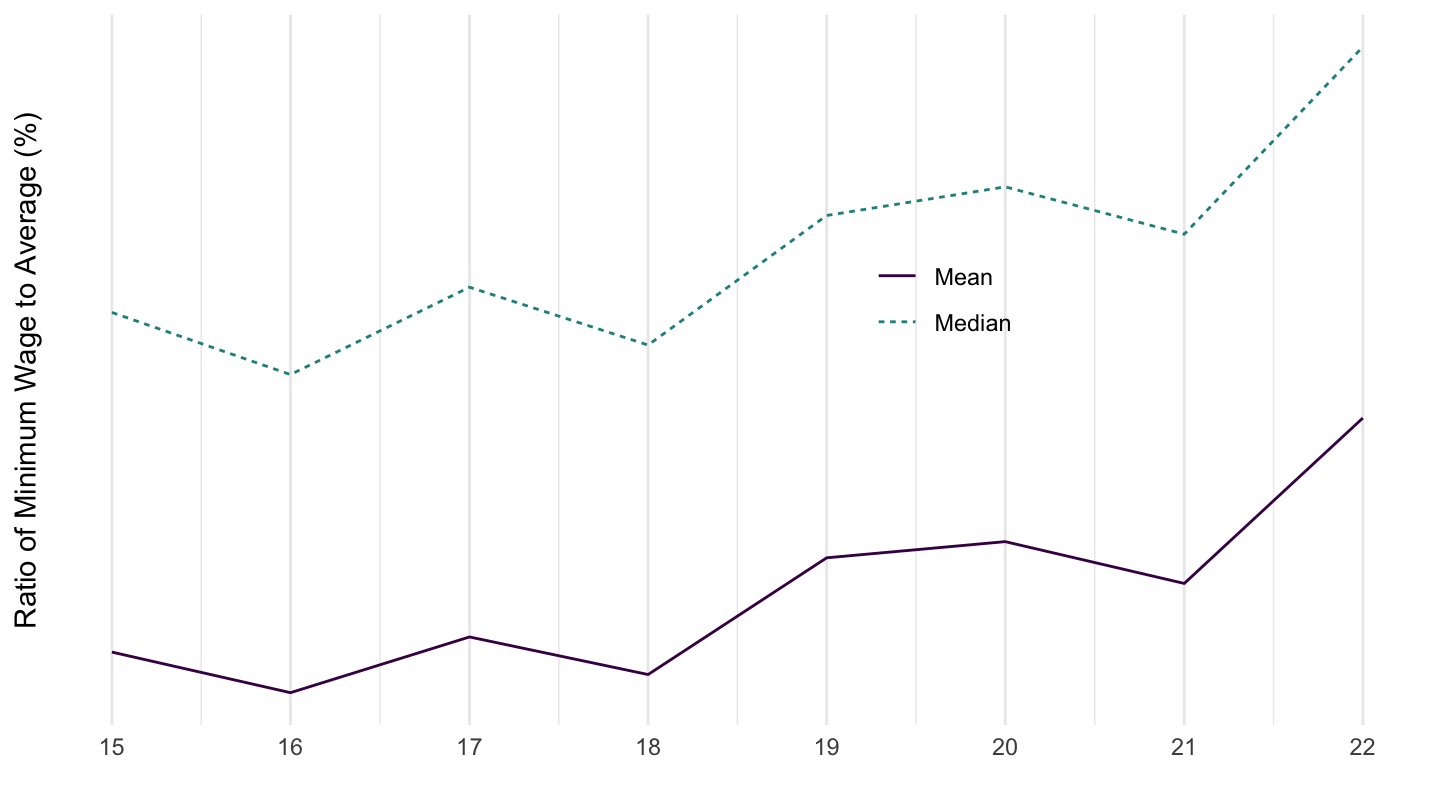
Last observation: 2022 (N = 64)
First observation: 1960 (N = 10)
Last data update: 02 août 2026, 09:01
Last compile: 20 oct. 2026, 01:38
SMIC Brut: 1.709,28€ / mois
Net: 1.353,07€ / mois
Selon le calculateur URSSAF. html
SMIC / Médian (Net) = 1204€ / 1940€ = 62%
SMIC / Médian (Brut) = 1549€ / 2478€ = 62.5%
SMIC / Médian (Super Brut) = 1616€ / 3320€ = 48.6%
SMIC / Moyen (Net) = 1204€ / 2424€ = 49.6%
SMIC / Moyen (Brut) = 1549€ / 3090€ = 50.1%
SMIC / Moyen (Super Brut) = 1616€ / 4191€ = 38.5%
i_g("bib/oecd/Minimum-wages-in-times-of-rising-inflation/figure2.png")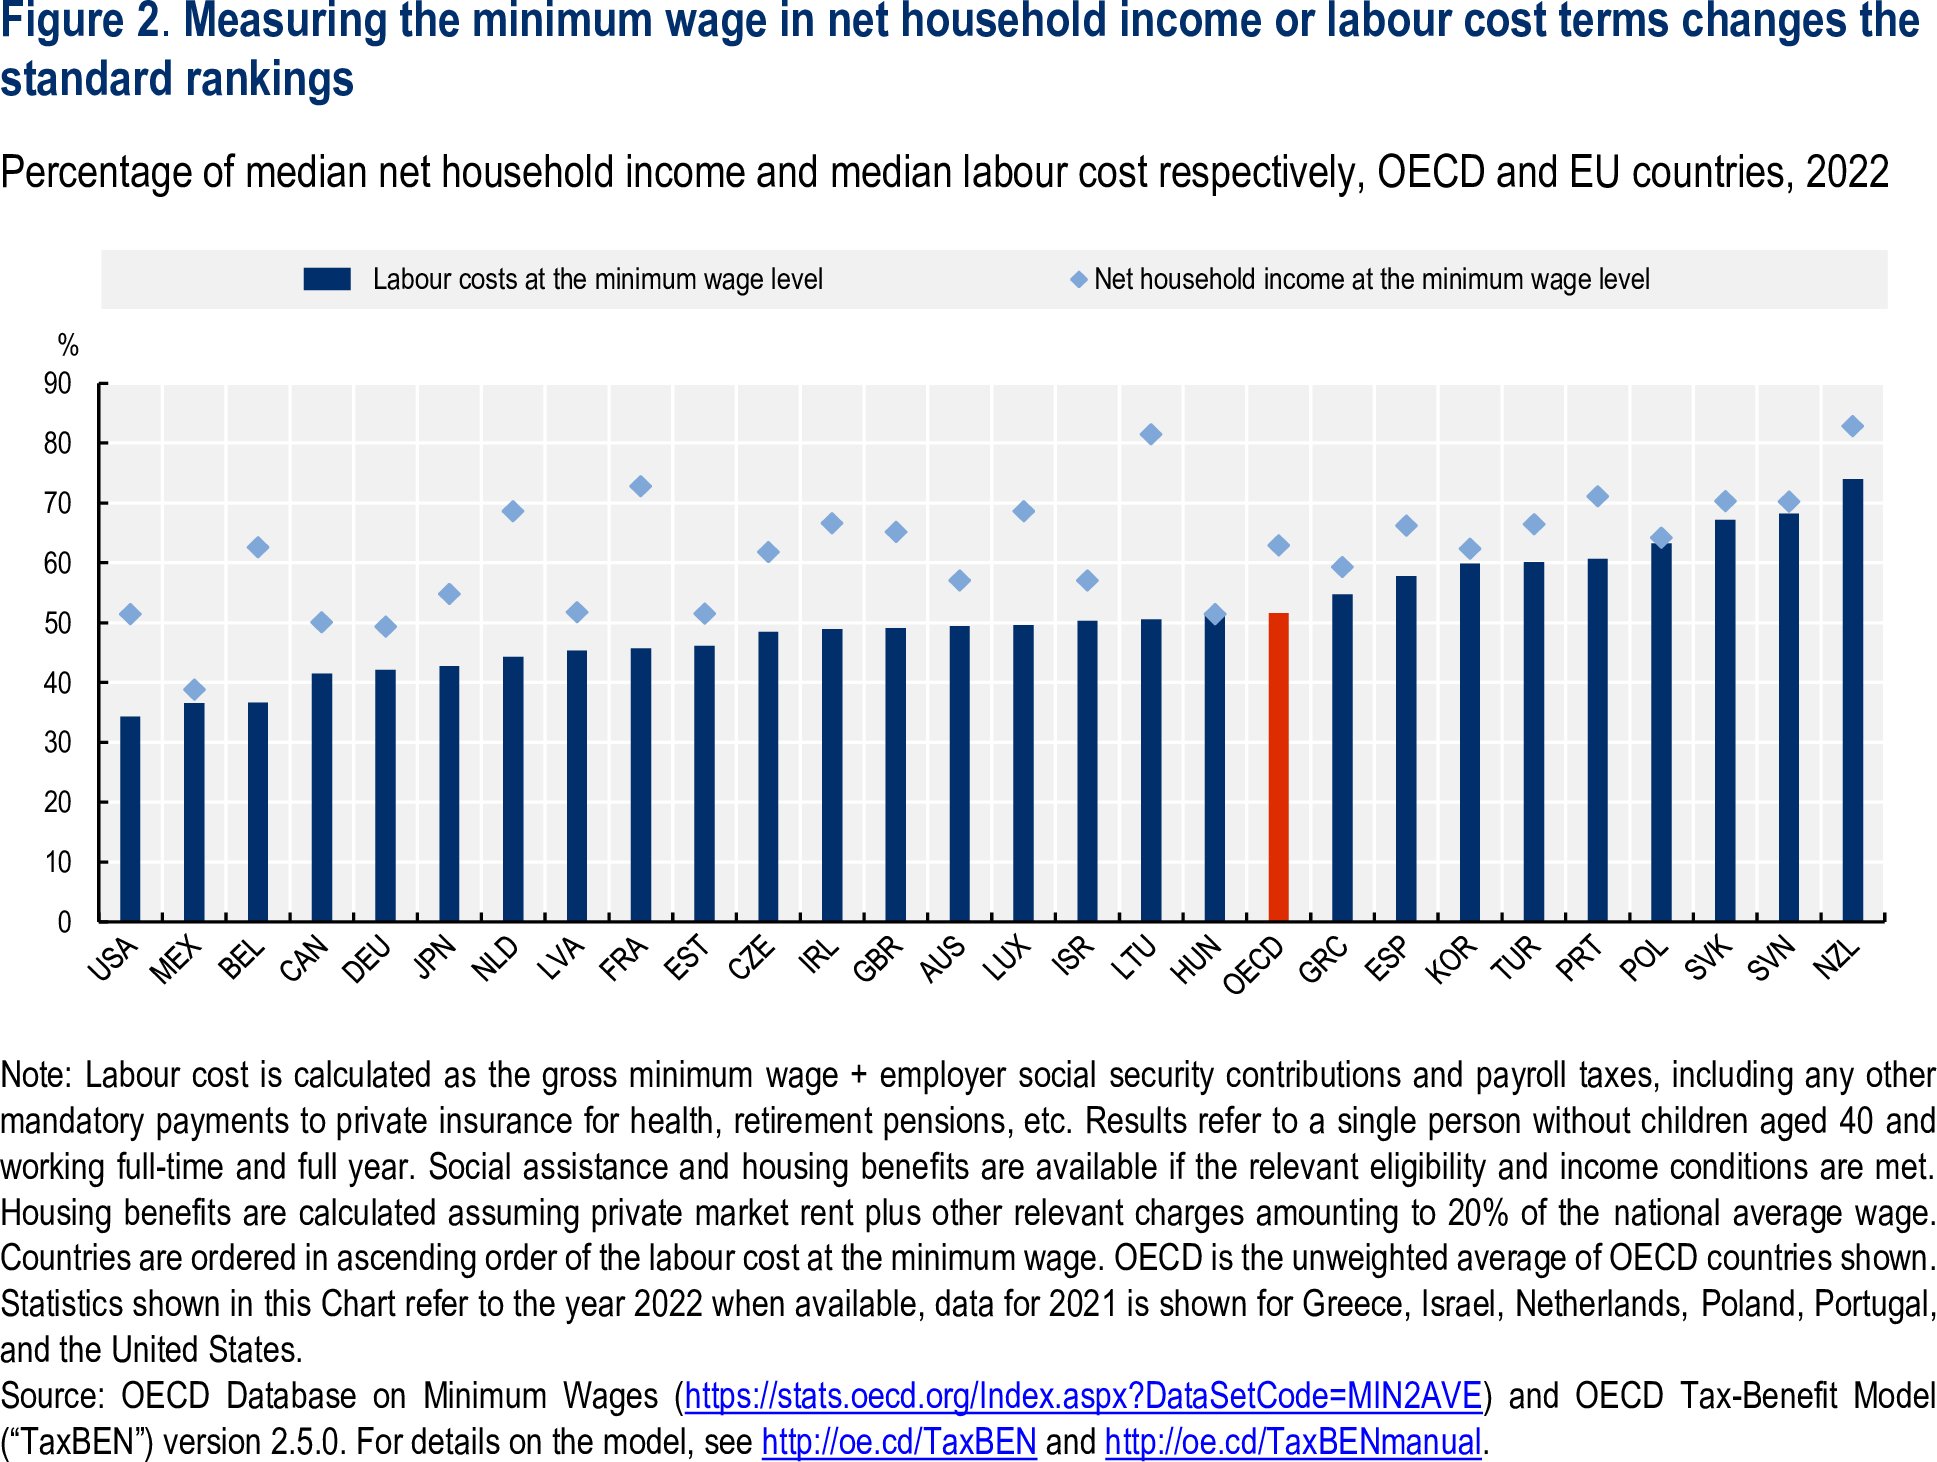
i_g("bib/france/SMIC-salaire.jpeg")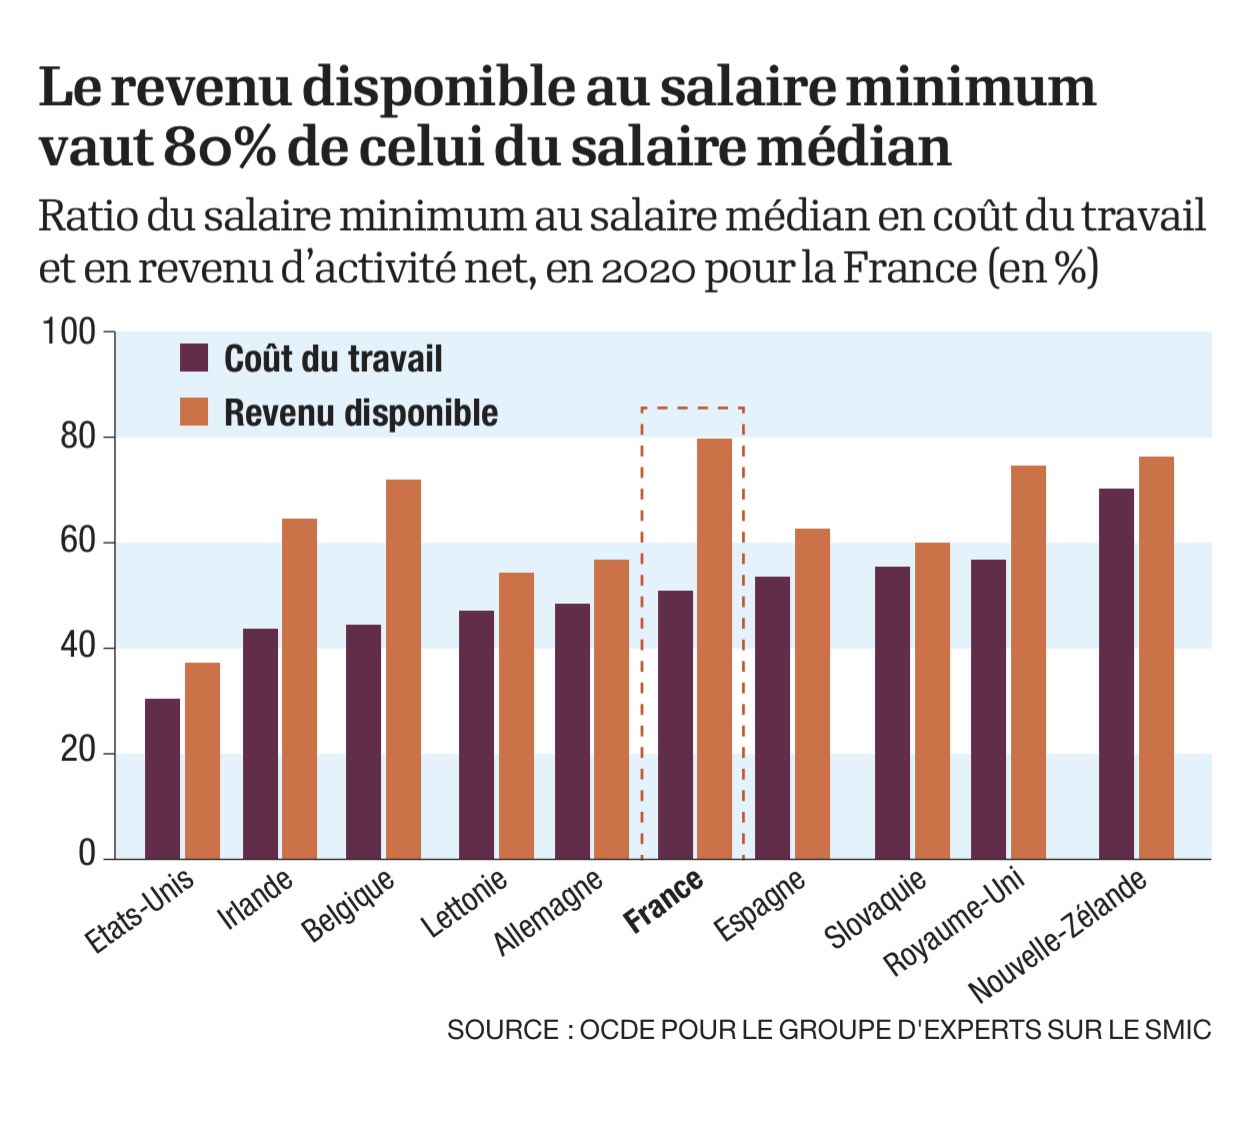
i_g("bib/Tresor/SMIC_Rapport_2020/rapport-cout.png")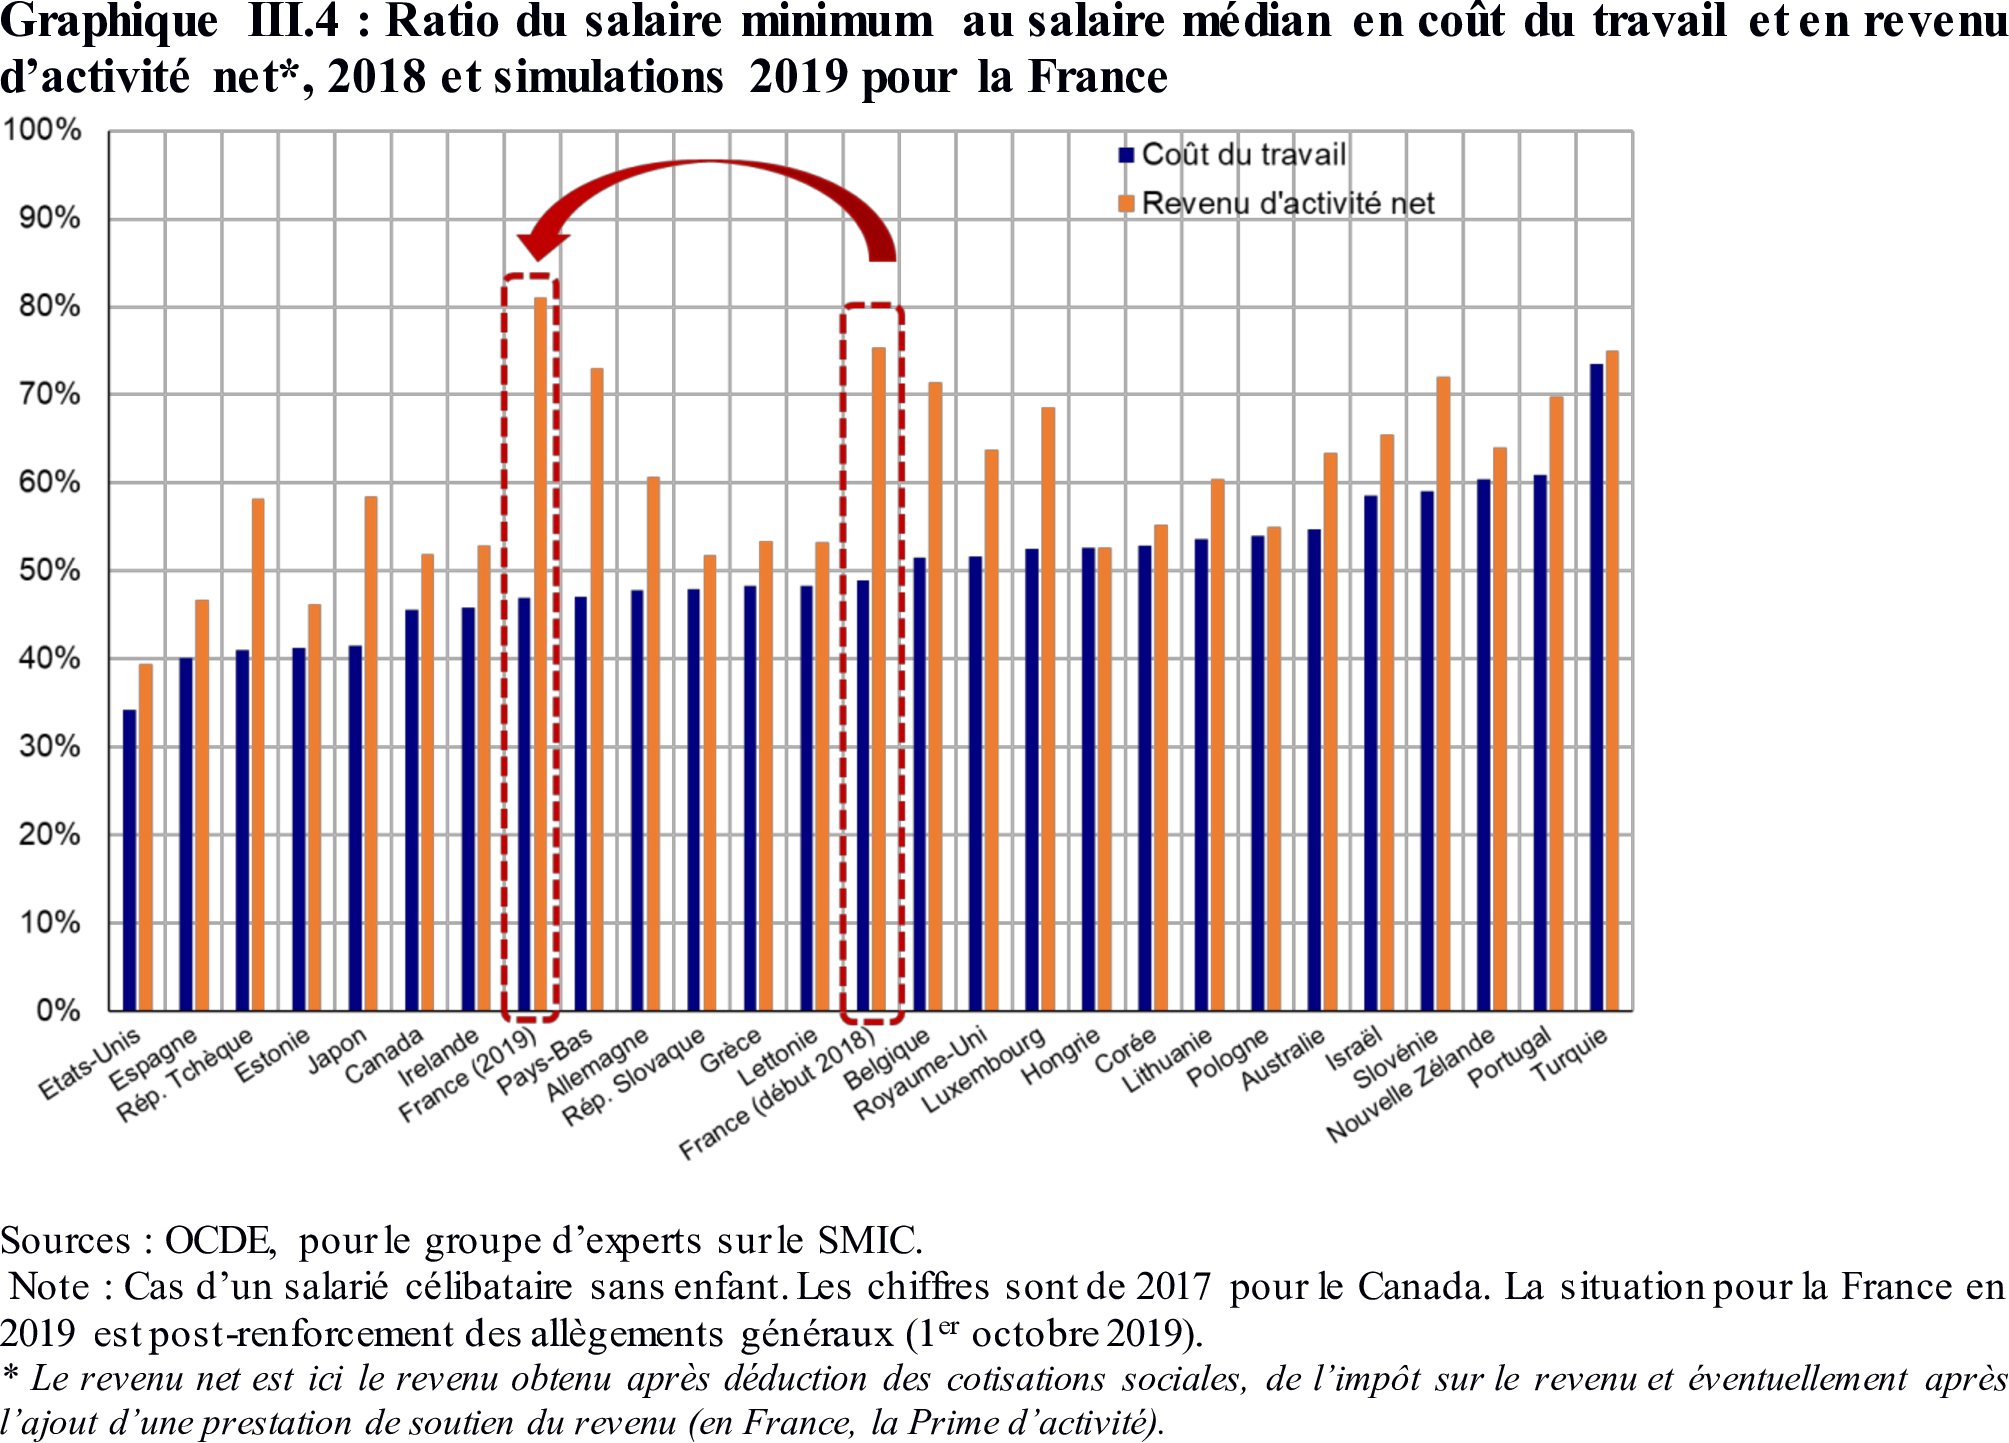
i_g("bib/france/URSSAF-1204.png")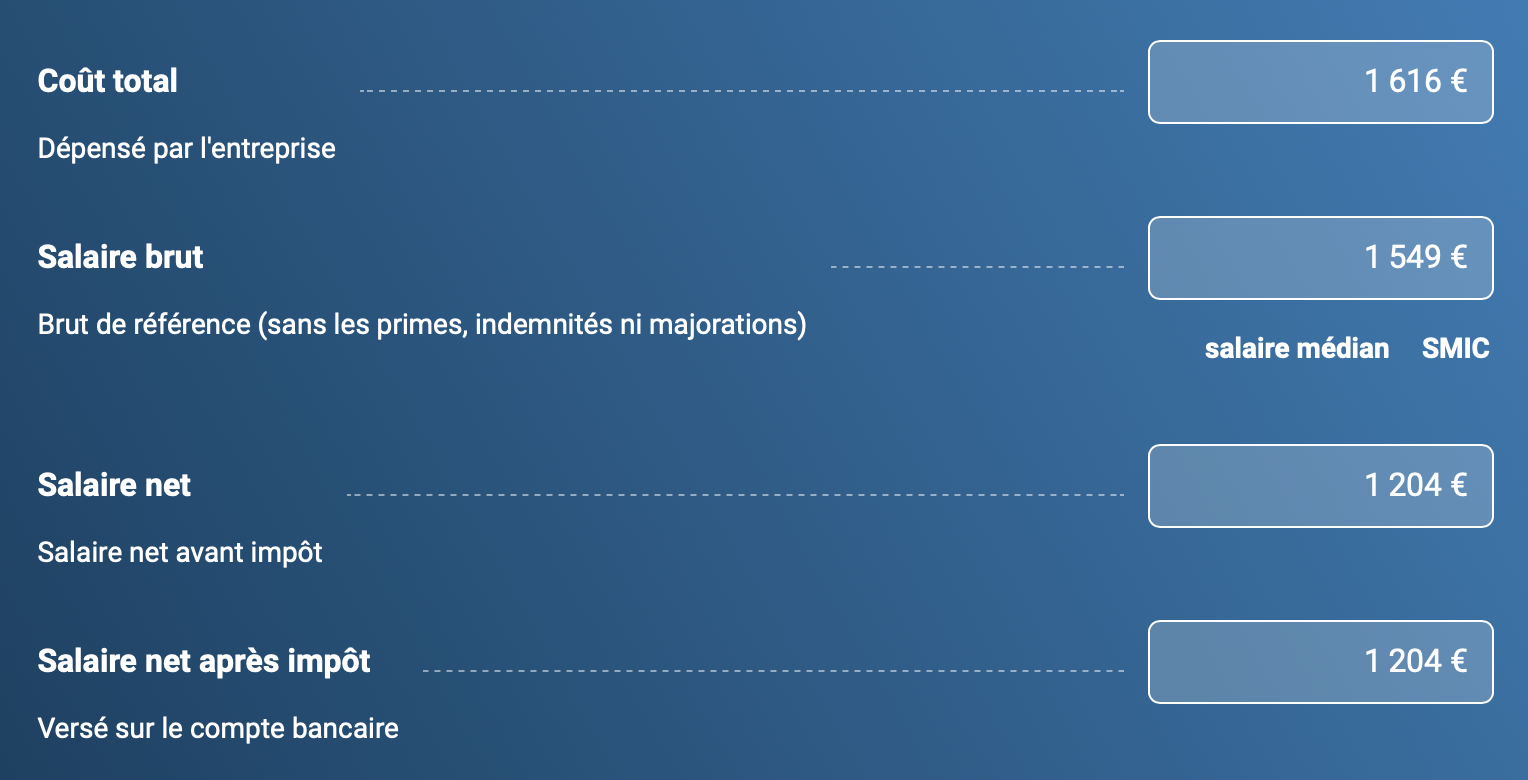
i_g("bib/france/URSSAF-1940.png")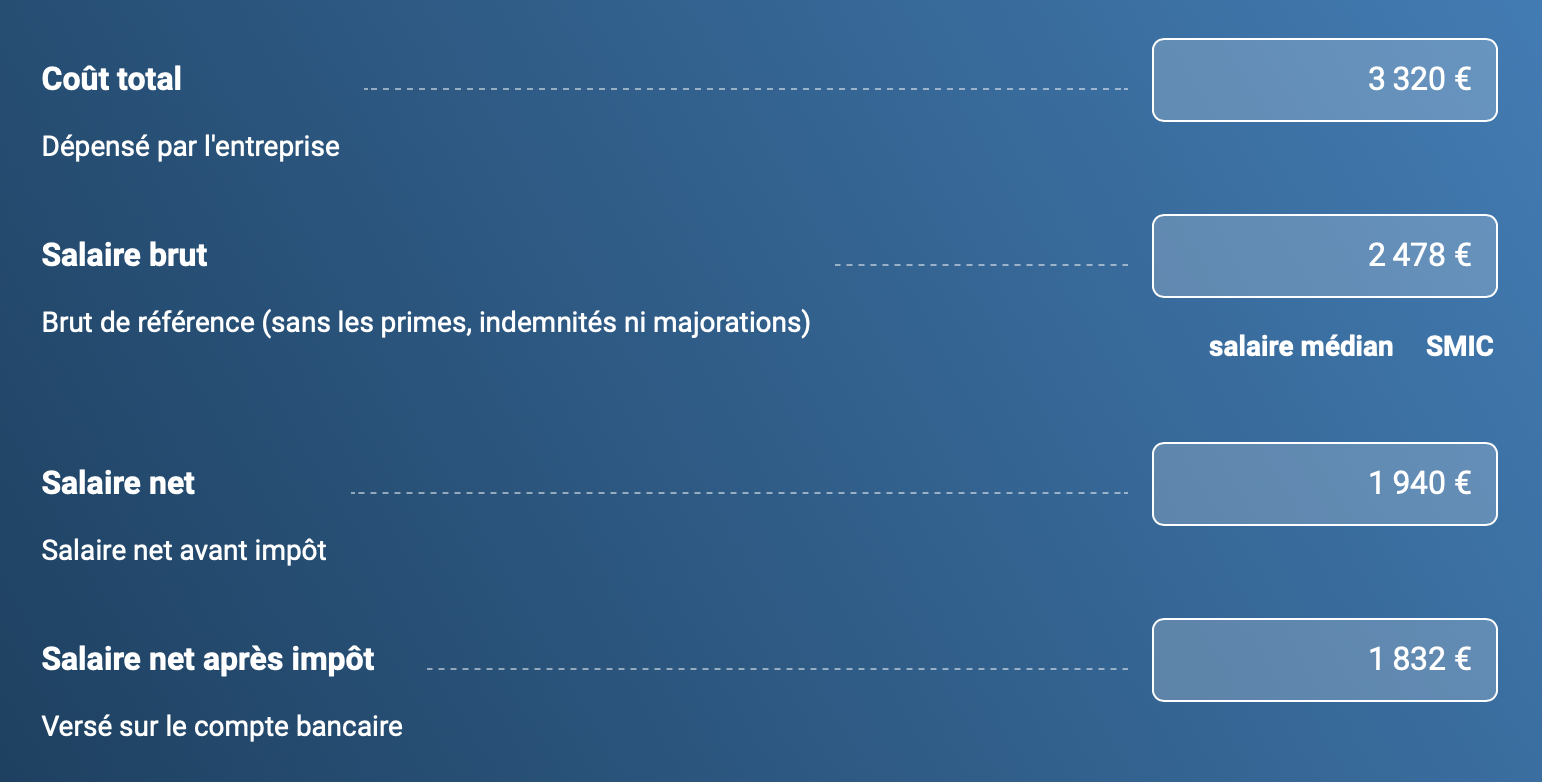
i_g("bib/france/URSSAF-2424.png")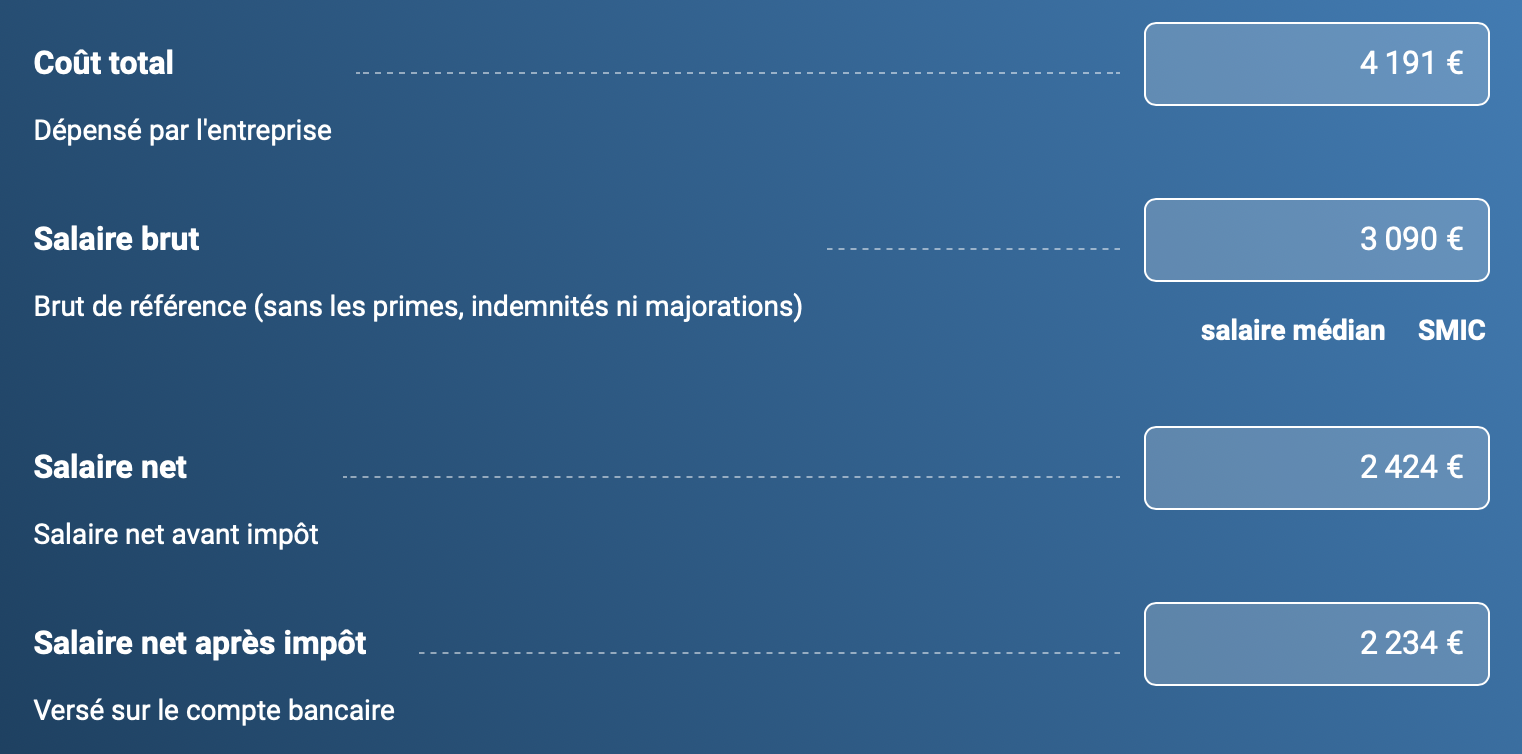
MIN2AVE |>
  left_join(MIN2AVE_var$SERIES, by = "SERIES") |>
  group_by(SERIES, Series) |>
  summarise(Nobs = n()) |>
  arrange(-Nobs) |>
print_table_conditional()| SERIES | Series | Nobs |
|---|---|---|
| MEAN | Mean | 1220 |
| MEDIAN | Median | 1197 |
MIN2AVE |>
  filter(SERIES == "MEDIAN") |>
  left_join(MIN2AVE_var$COUNTRY, by = "COUNTRY") |>
  group_by(COUNTRY, Country) |>
  summarise(Nobs = n(),
            `1999` = ifelse(any(obsTime == "1999"), obsValue[obsTime == "1999"], NA_real_),
            `2009` = ifelse(any(obsTime == "2009"), obsValue[obsTime == "2009"], NA_real_),
            `2019` = ifelse(any(obsTime == "2019"), obsValue[obsTime == "2019"], NA_real_)) |>
  mutate(Flag = gsub(" ", "-", str_to_lower(Country)),
         Flag = paste0('<img src="../../icon/flag/vsmall/', Flag, '.png" alt="Flag">')) |>
  select(Flag, everything()) %>%
{if (is_html_output()) datatable(., filter = 'top', rownames = F, escape = F) else .}MIN2AVE |>
filter(SERIES == "MEDIAN",
COUNTRY %in% c("USA", "JPN", "GBR", "CAN")) |>
year_to_date() |>
left_join(MIN2AVE_var$COUNTRY, by = "COUNTRY") |>
add_flag_color("Country") |>
rename(Location = Country) |>
ggplot() + scale_color_identity() + theme_minimal() +
geom_line(aes(x = date, y = obsValue, color = color)) + add_4flags +
scale_x_date(breaks = seq(1920, 2100, 5) |> paste0("-01-01") |> as.Date(),
labels = date_format("%Y")) +
theme(legend.position = c(0.2, 0.8),
legend.title = element_blank()) +
scale_y_continuous(breaks = 0.01*seq(0, 100, 5),
labels = percent_format(accuracy = 1)) +
ylab("Ratio of Minimum Wage to Average (%)") + xlab("")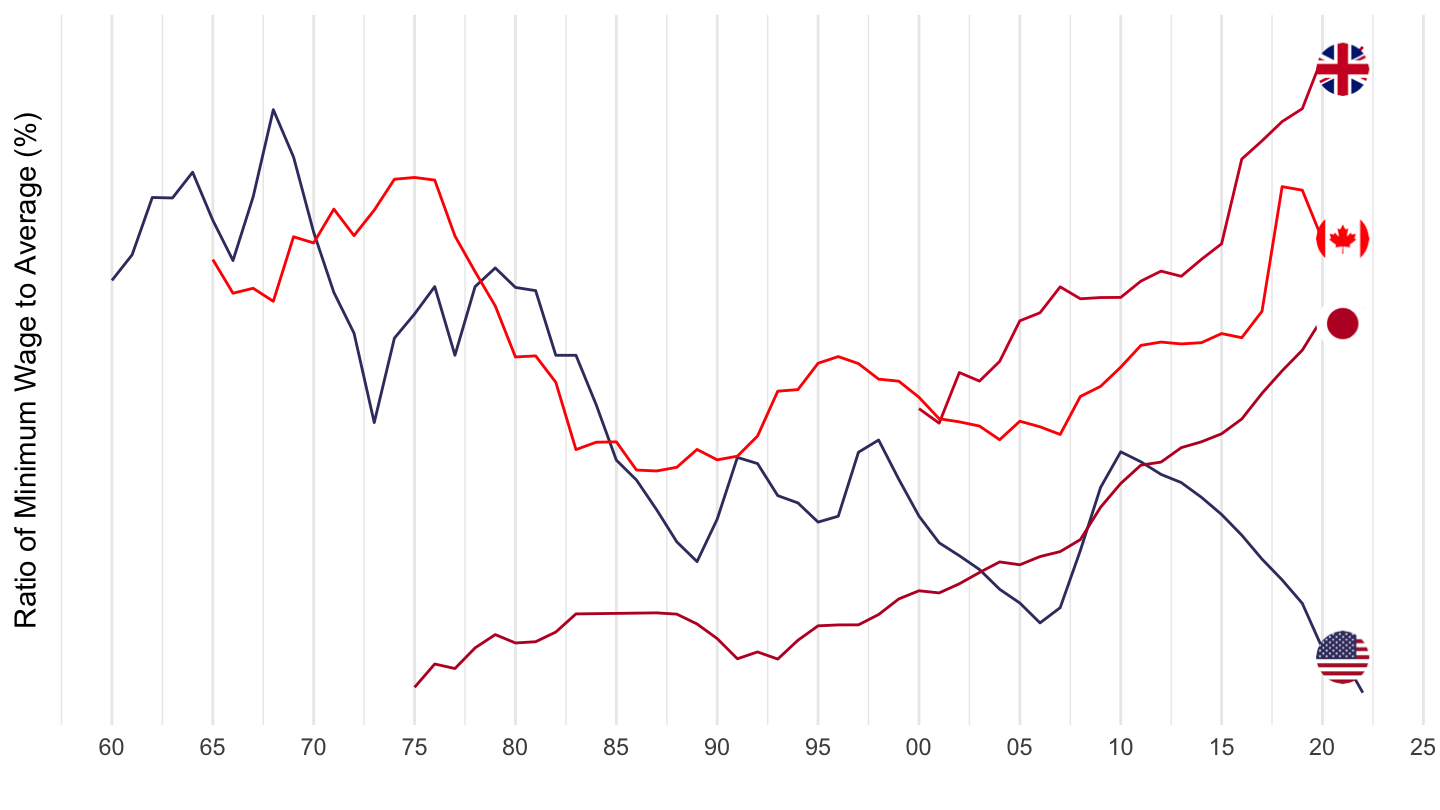
MIN2AVE |>
  filter(SERIES == "MEDIAN",
         COUNTRY %in% c("FRA", "ESP", "DEU", "PRT")) |>
  year_to_date() |>
  left_join(MIN2AVE_var$COUNTRY, by = "COUNTRY") |>
  add_flag_color("Country") |>
  rename(Location = Country) |>
  ggplot() +  scale_color_identity() + theme_minimal() +
  geom_line(aes(x = date, y = obsValue, color = color)) + add_4flags +
  scale_x_date(breaks = seq(1920, 2100, 5) |> paste0("-01-01") |> as.Date(),
               labels = date_format("%Y")) +
  theme(legend.position = c(0.2, 0.8),
        legend.title = element_blank()) +
  scale_y_continuous(breaks = 0.01*seq(0, 100, 5),
                     labels = percent_format(accuracy = 1)) +
  ylab("Ratio of Minimum Wage to Average (%)") + xlab("")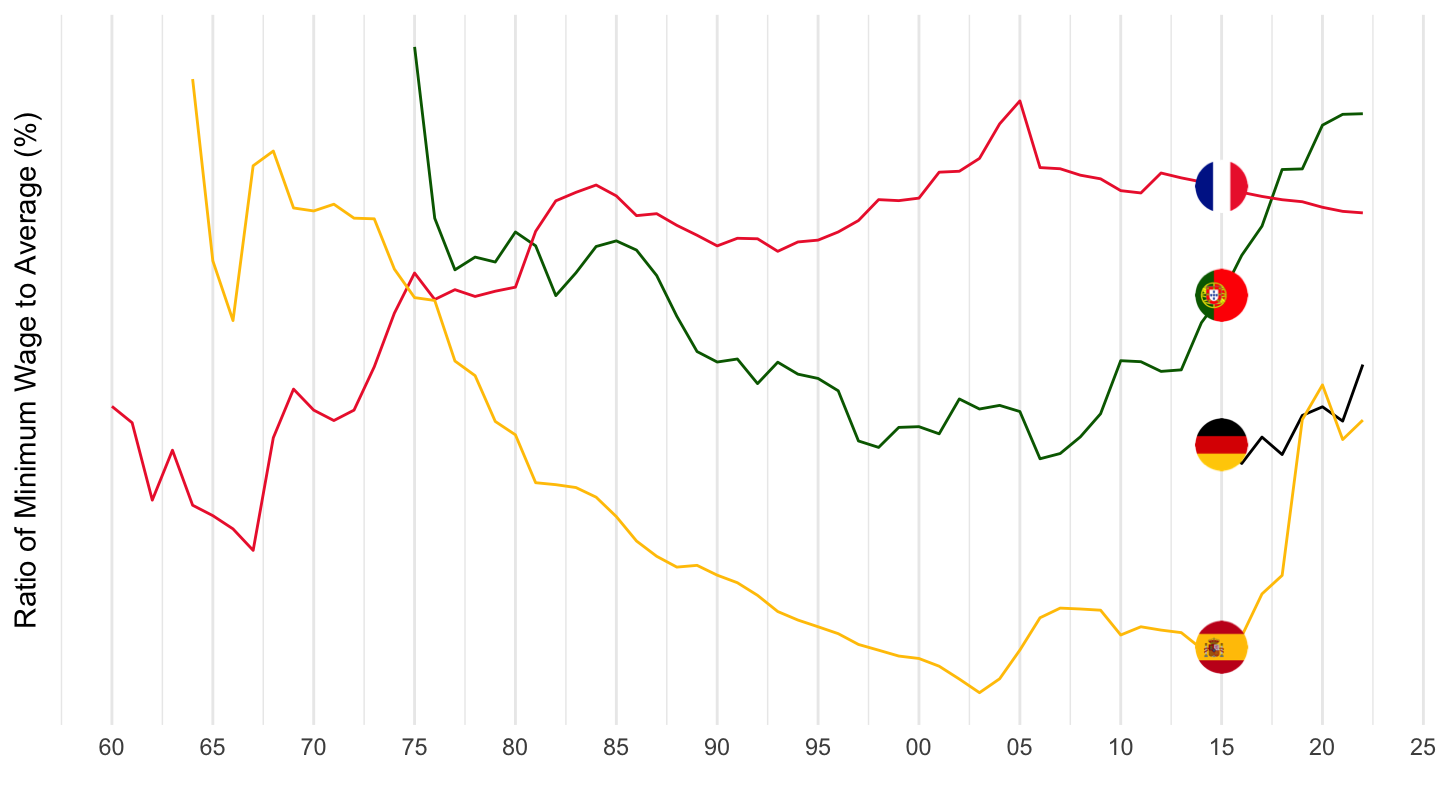
MIN2AVE |>
  filter(COUNTRY == "FRA") |>
  year_to_date() |>
  left_join(MIN2AVE_var$SERIES, by = "SERIES") |>
  ggplot() +
  geom_line(aes(x = date, y = obsValue, color = Series, linetype = Series)) +
  scale_color_manual(values = viridis(3)[1:2]) +
  theme_minimal() +
  scale_x_date(breaks = seq(1920, 2100, 5) |> paste0("-01-01") |> as.Date(),
               labels = date_format("%Y")) +
  theme(legend.position = c(0.2, 0.8),
        legend.title = element_blank()) +
  scale_y_continuous(breaks = 0.01*seq(0, 100, 5),
                     labels = percent_format(accuracy = 1)) +
  ylab("Ratio of Minimum Wage to Average (%)") + xlab("")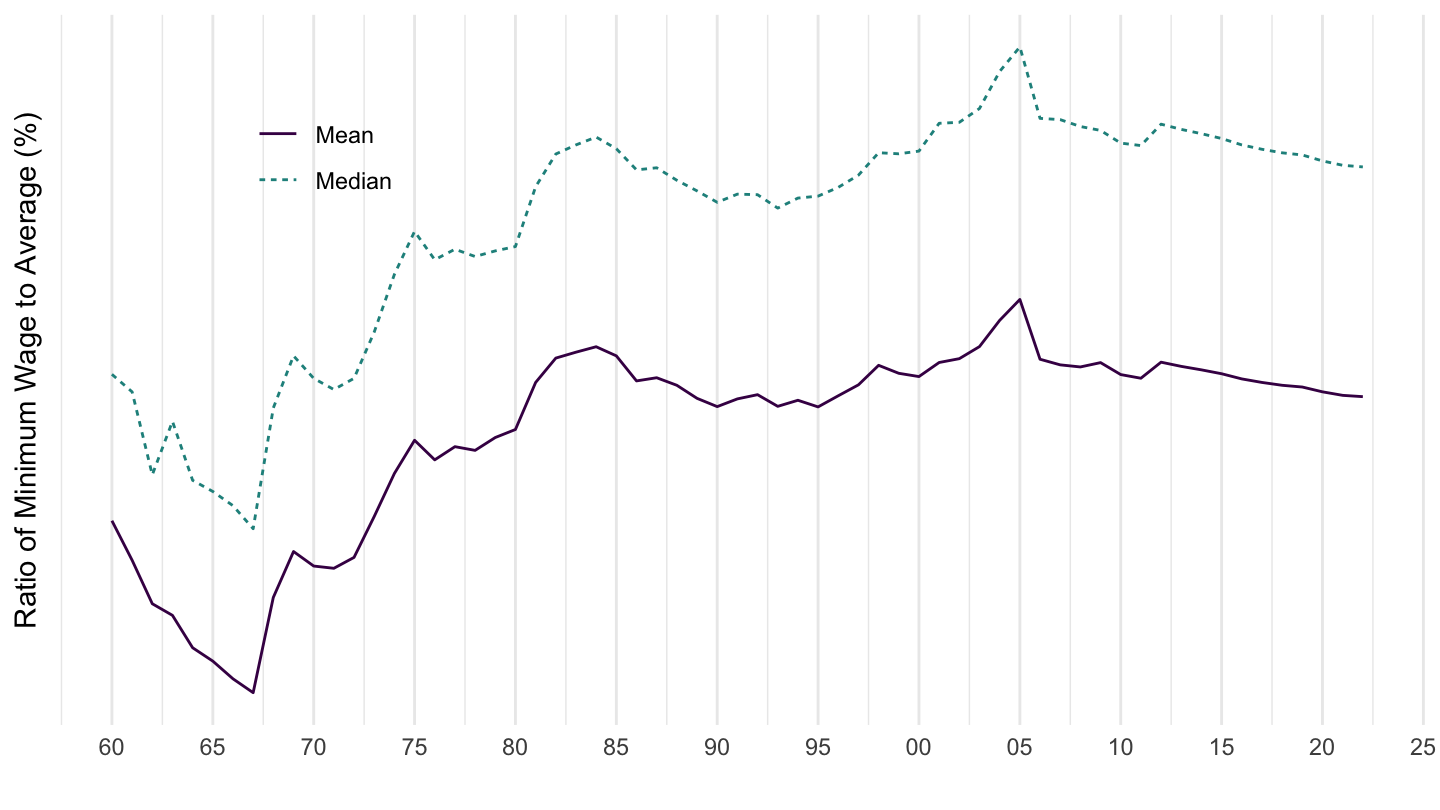
MIN2AVE |>
  filter(COUNTRY == "DEU") |>
  year_to_date() |>
  left_join(MIN2AVE_var$SERIES, by = "SERIES") |>
  ggplot() +
  geom_line(aes(x = date, y = obsValue, color = Series, linetype = Series)) +
  scale_color_manual(values = viridis(3)[1:2]) + theme_minimal() +
  scale_x_date(breaks = seq(1920, 2100, 1) |> paste0("-01-01") |> as.Date(),
               labels = date_format("%Y")) +
  theme(legend.position = c(0.65, 0.6),
        legend.title = element_blank()) +
  scale_y_continuous(breaks = 0.01*seq(0, 100, 1),
                     labels = percent_format(accuracy = 1)) +
  ylab("Ratio of Minimum Wage to Average (%)") + xlab("")