Taxing Wages - Comparative tables

Data - OECD

Info

Data on wages

Code
wages %>%
  arrange(-(dataset == "earn_mw_cur")) %>%
  mutate(Title = read_lines(paste0("~/Library/Mobile\ Documents/com~apple~CloudDocs/website/data/", source, "/",dataset, ".qmd"), skip = 1, n_max = 1) %>% gsub("title: ", "", .) %>% gsub("\"", "", .)) %>%
  mutate(Download = as.Date(file.info(paste0("~/Library/Mobile\ Documents/com~apple~CloudDocs/website/data/", source, "/", dataset, ".RData"))$mtime),
         Compile = as.Date(file.info(paste0("~/Library/Mobile\ Documents/com~apple~CloudDocs/website/data/", source, "/", dataset, ".html"))$mtime)) %>%
  mutate(Compile = paste0("[", Compile, "](https://fgeerolf.com/data/", source, "/", dataset, '.html)')) %>%
  print_table_conditional()
source dataset Title Download Compile
eurostat earn_mw_cur Monthly minimum wages - bi-annual data 2024-09-14 [2024-09-14]
eurostat ei_lmlc_q Labour cost index, nominal value - quarterly data 2024-09-14 [2024-09-14]
eurostat lc_lci_lev Labour cost levels by NACE Rev. 2 activity 2024-09-14 [2024-09-14]
eurostat lc_lci_r2_q Labour cost index by NACE Rev. 2 activity - nominal value, quarterly data 2024-08-20 [2024-09-14]
eurostat nama_10_lp_ulc Labour productivity and unit labour costs 2024-09-14 [2024-09-14]
eurostat namq_10_lp_ulc Labour productivity and unit labour costs 2024-09-14 [2024-09-14]
eurostat tps00155 Minimum wages 2024-09-14 [2024-09-15]
fred wage Wage 2024-09-14 [2024-09-14]
ilo EAR_4MTH_SEX_ECO_CUR_NB_A Mean nominal monthly earnings of employees by sex and economic activity -- Harmonized series 2023-06-01 [2024-06-20]
ilo EAR_XEES_SEX_ECO_NB_Q Mean nominal monthly earnings of employees by sex and economic activity -- Harmonized series 2023-06-01 [2024-06-20]
oecd AV_AN_WAGE Average annual wages 2024-09-15 [2024-04-16]
oecd AWCOMP Taxing Wages - Comparative tables 2023-09-09 [2024-09-11]
oecd EAR_MEI Hourly Earnings (MEI) 2024-04-16 [2024-04-16]
oecd HH_DASH Household Dashboard 2023-09-09 [2024-09-11]
oecd MIN2AVE Minimum relative to average wages of full-time workers - MIN2AVE 2023-09-09 [2024-09-11]
oecd RMW Real Minimum Wages - RMW 2024-03-12 [2024-09-11]
oecd ULC_EEQ Unit labour costs and labour productivity (employment based), Total economy 2024-04-15 [2024-09-11]

LAST_COMPILE

LAST_COMPILE
2024-09-15

Last

obsTime Nobs
2022 4768

INDICATOR

Code
AWCOMP %>%
  left_join(AWCOMP_var$INDICATOR, by = c("INDICATOR")) %>%
  group_by(INDICATOR, Indicator) %>%
  summarise(Nobs = n()) %>%
  arrange(-Nobs) %>%
  print_table_conditional()
INDICATOR Indicator Nobs
2_1 Average income tax rate (% gross wage earnings) 7360
2_2 Average rate of employees' social security contributions (% gross wage earnings) 7360
2_3 Average rate of employer's social security contributions (% gross wage earnings) 7360
2_4 Average rate of income tax and employees' social security contributions (% gross wage earnings) 7360
2_5 Net personal average tax rate (% gross wage earnings) 7360
2_6 Average tax wedge (% labour costs) 7360
3_1 Net personal marginal tax rate: Principal earner (% gross wage earnings) 7360
3_2 Marginal tax wedge: Principal earner (% labour costs) 7360
4_1 Increase in net income after an increase of 1 currency unit in gross wages 7360
4_2 Increase in net income after an increase of 1 currency unit in gross labour cost 7360
5_1 Total gross earnings before taxes in US dollars using PPP exchange rates 7360
5_2 Net income after taxes in US dollars using PPP exchange rates 7360
5_3 Total gross labour costs before taxes in US dollars using PPP exchange rates 7360
1_1 Total gross earnings before taxes in national currency 6992
1_2 Net income after taxes in national currency 6992

FAM_TYPE

Code
AWCOMP %>%
  left_join(AWCOMP_var$FAM_TYPE, by = c("FAM_TYPE")) %>%
  group_by(FAM_TYPE, Fam_type) %>%
  summarise(Nobs = n()) %>%
  arrange(-Nobs) %>%
  print_table_conditional()
FAM_TYPE Fam_type Nobs
MARRIED1 One-earner married couple at 100% of average earnings, with two children 13708
MARRIED2 Two-earner married couple, one at 100% of average earnings and the other at 67%, with two children 13708
MARRIED3 Two-earner married couple, one at 100% of average earnings and the other at 100%, with two children 13708
MARRIED4 Two-earner married couple, one at 100% of average earnings and the other at 67%, without child 13708
SINGLE1 Single person at 67% of average earnings, without child 13708
SINGLE2 Single person at 100% of average earnings, without child 13708
SINGLE3 Single person at 167% of average earnings, without child 13708
SINGLE4 Single person at 67% of average earnings, with two children 13708

COU

Code
AWCOMP %>%
  left_join(AWCOMP_var$COU, by = "COU") %>%
  group_by(COU, Cou) %>%
  summarise(Nobs = n()) %>%
  arrange(-Nobs) %>%
  mutate(Flag = gsub(" ", "-", str_to_lower(gsub(" ", "-", Cou))),
         Flag = paste0('<img src="../../icon/flag/vsmall/', Flag, '.png" alt="Flag">')) %>%
  select(Flag, everything()) %>%
  {if (is_html_output()) datatable(., filter = 'top', rownames = F, escape = F) else .}

obsTime

Code
AWCOMP %>%
  group_by(obsTime) %>%
  summarise(Nobs = n()) %>%
  arrange(desc(obsTime)) %>%
  print_table_conditional()
obsTime Nobs
2022 4768
2021 4768
2020 4768
2019 4768
2018 4768
2017 4768
2016 4768
2015 4768
2014 4768
2013 4768
2012 4768
2011 4768
2010 4768
2009 4768
2008 4768
2007 4768
2006 4768
2005 4768
2004 4768
2003 4768
2002 4768
2001 4768
2000 4768

Countries

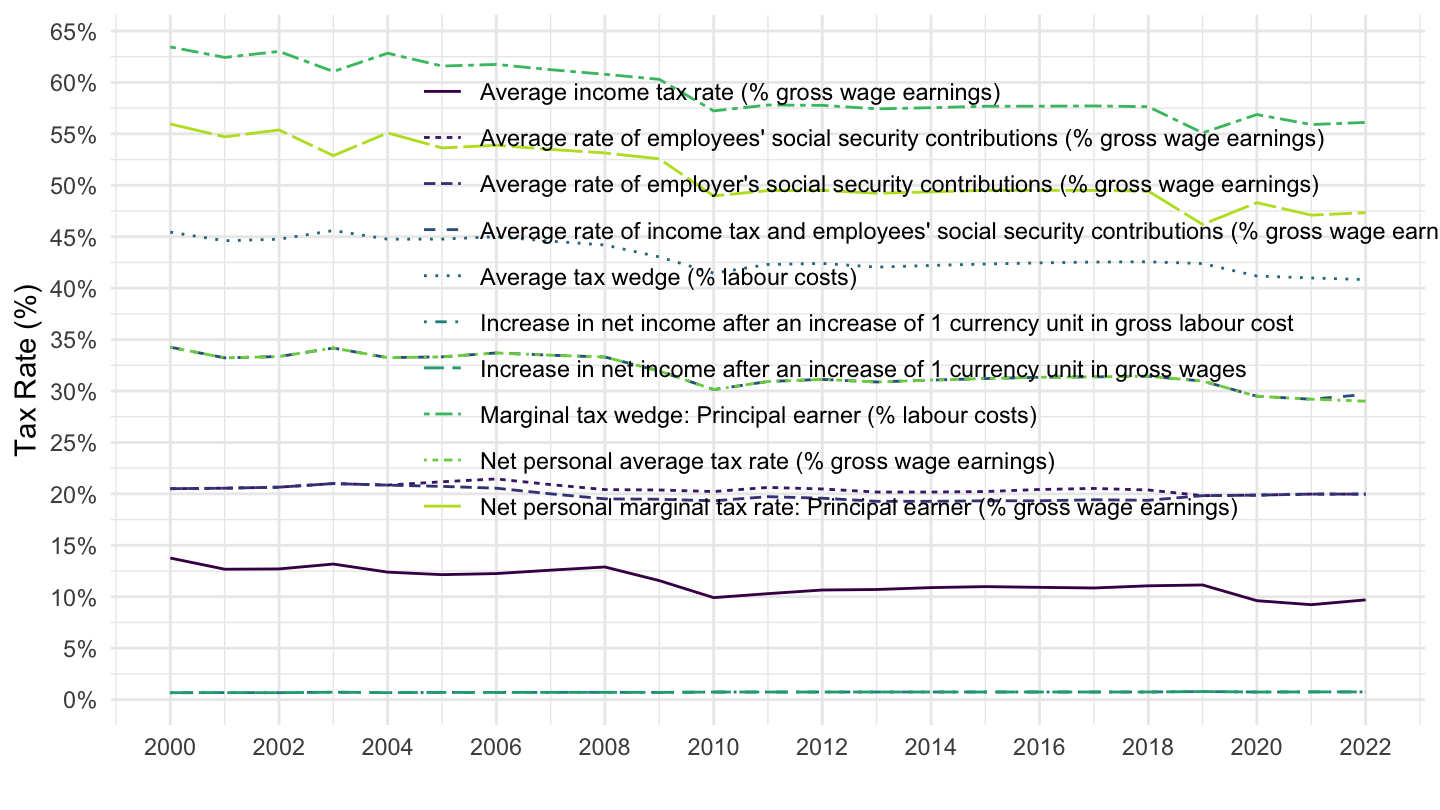
Germany

Code
AWCOMP %>%
  filter(COU == "DEU",
         UNIT == "PC",
         FAM_TYPE == "MARRIED2") %>%
  year_to_date %>%
  left_join(AWCOMP_var$INDICATOR, by = c("INDICATOR")) %>%
  mutate(obsValue = obsValue/100) %>%
  ggplot() + 
  geom_line(aes(x = date, y = obsValue, color = Indicator, linetype = Indicator)) +
  scale_color_manual(values = viridis(11)[1:10]) +
  theme_minimal() +
  scale_x_date(breaks = seq(1920, 2025, 2) %>% paste0("-01-01") %>% as.Date,
               labels = date_format("%Y")) +
  theme(legend.position = c(0.65, 0.6),
        legend.title = element_blank()) +
  scale_y_continuous(breaks = 0.01*seq(0, 100, 5),
                     labels = percent_format(accuracy = 1)) + 
  ylab("Tax Rate (%)") + xlab("")

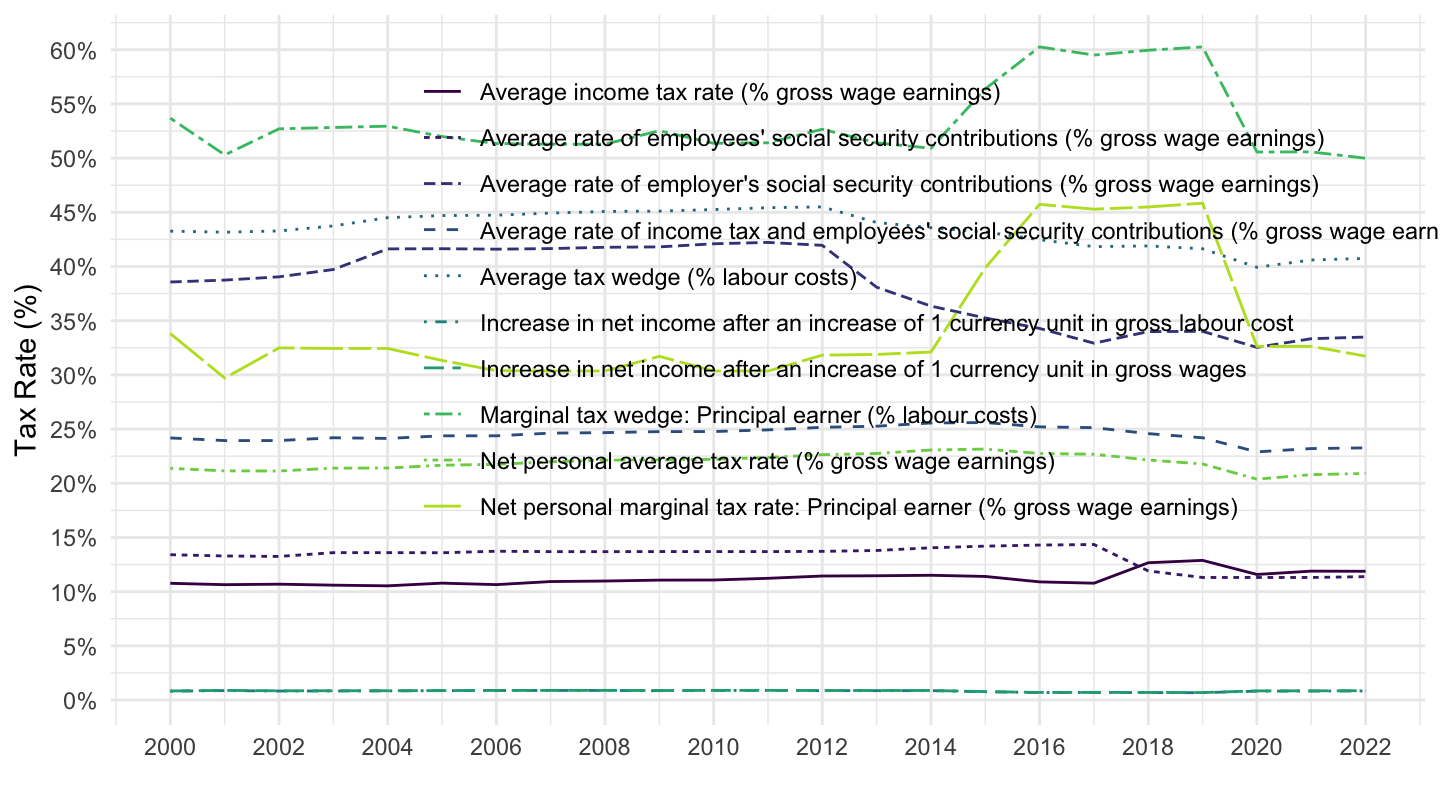
France

Code
AWCOMP %>%
  filter(COU == "FRA",
         UNIT == "PC",
         FAM_TYPE == "MARRIED2") %>%
  year_to_date %>%
  left_join(AWCOMP_var$INDICATOR, by = c("INDICATOR")) %>%
  mutate(obsValue = obsValue/100) %>%
  ggplot() + 
  geom_line(aes(x = date, y = obsValue, color = Indicator, linetype = Indicator)) +
  scale_color_manual(values = viridis(11)[1:10]) +
  theme_minimal() +
  scale_x_date(breaks = seq(1920, 2025, 2) %>% paste0("-01-01") %>% as.Date,
               labels = date_format("%Y")) +
  theme(legend.position = c(0.65, 0.6),
        legend.title = element_blank()) +
  scale_y_continuous(breaks = 0.01*seq(0, 100, 5),
                     labels = percent_format(accuracy = 1)) + 
  ylab("Tax Rate (%)") + xlab("")

Wages: Gross vs. Net

2021

Code
AWCOMP %>%
  filter(obsTime == "2021",
         INDICATOR %in% c("5_1", "5_2"),
         FAM_TYPE == "SINGLE2") %>%
  left_join(AWCOMP_var$COU, by = "COU") %>%
  left_join(AWCOMP_var$INDICATOR, by = "INDICATOR") %>%
  select(COU, Cou, Indicator, obsValue) %>%
  spread(Indicator, obsValue) %>%
  mutate(Flag = gsub(" ", "-", str_to_lower(gsub(" ", "-", Cou))),
         Flag = paste0('<img src="../../icon/flag/vsmall/', Flag, '.png" alt="Flag">')) %>%
  select(Flag, everything()) %>%
  arrange(-`Total gross earnings before taxes in US dollars using PPP exchange rates`) %>%
  {if (is_html_output()) datatable(., filter = 'top', rownames = F, escape = F) else .}

2020

Code
AWCOMP %>%
  filter(obsTime == "2020",
         INDICATOR %in% c("5_1", "5_2"),
         FAM_TYPE == "SINGLE2") %>%
  left_join(AWCOMP_var$COU, by = "COU") %>%
  left_join(AWCOMP_var$INDICATOR, by = "INDICATOR") %>%
  select(COU, Cou, Indicator, obsValue) %>%
  spread(Indicator, obsValue) %>%
  mutate(Flag = gsub(" ", "-", str_to_lower(gsub(" ", "-", Cou))),
         Flag = paste0('<img src="../../icon/flag/vsmall/', Flag, '.png" alt="Flag">')) %>%
  select(Flag, everything()) %>%
  arrange(-`Total gross earnings before taxes in US dollars using PPP exchange rates`) %>%
  {if (is_html_output()) datatable(., filter = 'top', rownames = F, escape = F) else .}

2000

Code
AWCOMP %>%
  filter(obsTime == "2000",
         INDICATOR %in% c("5_1", "5_2"),
         FAM_TYPE == "SINGLE2") %>%
  left_join(AWCOMP_var$COU, by = "COU") %>%
  left_join(AWCOMP_var$INDICATOR, by = "INDICATOR") %>%
  select(COU, Cou, Indicator, obsValue) %>%
  spread(Indicator, obsValue) %>%
  mutate(Flag = gsub(" ", "-", str_to_lower(gsub(" ", "-", Cou))),
         Flag = paste0('<img src="../../icon/flag/vsmall/', Flag, '.png" alt="Flag">')) %>%
  select(Flag, everything()) %>%
  arrange(-`Net income after taxes in US dollars using PPP exchange rates`) %>%
  {if (is_html_output()) datatable(., filter = 'top', rownames = F, escape = F) else .}

France, Germany, Italy, United States

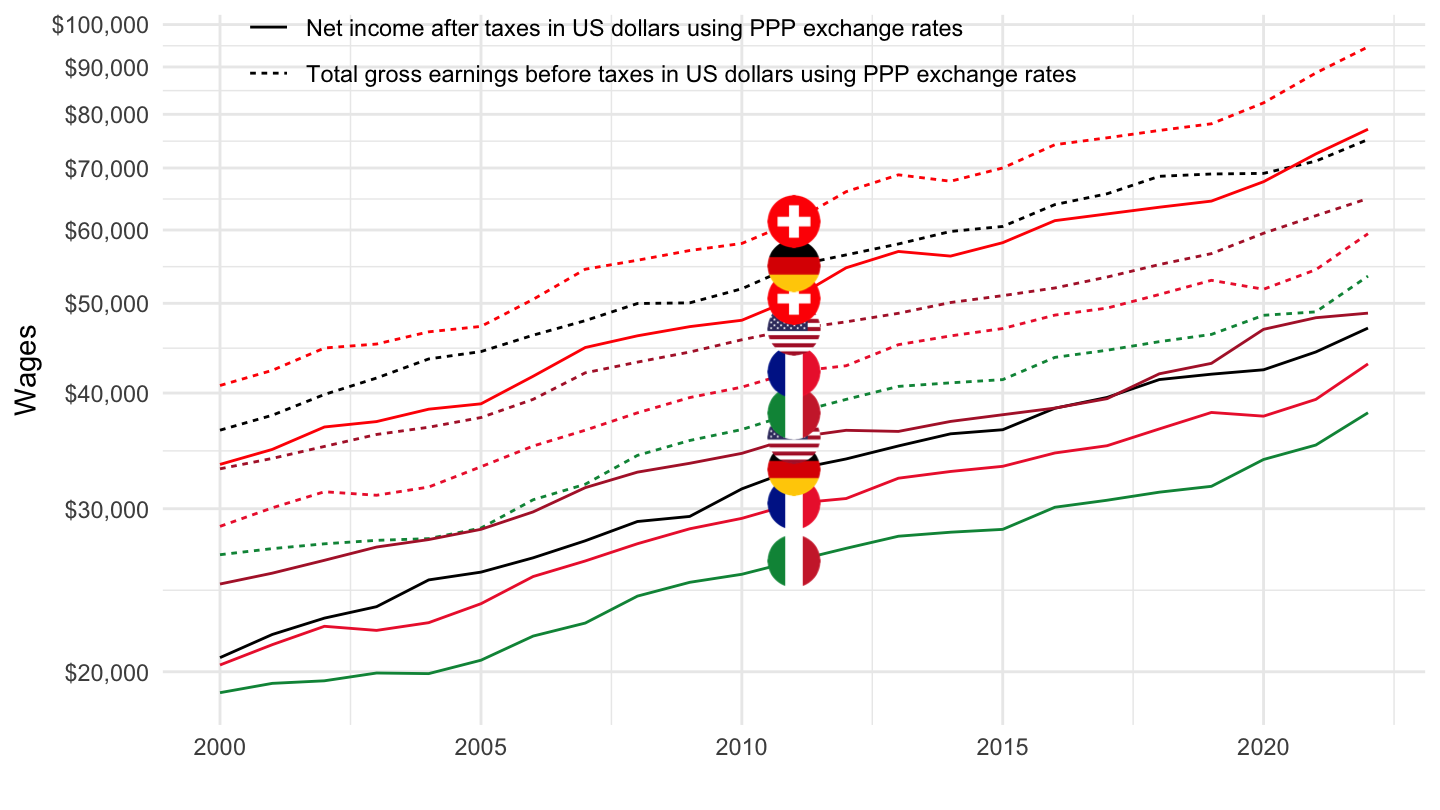
Gross/net

Code
AWCOMP %>%
  filter(COU %in% c("FRA", "DEU", "ITA", "USA", "CHE"),
         INDICATOR %in% c("5_1", "5_2"),
         FAM_TYPE == "SINGLE2") %>%
  left_join(AWCOMP_var$COU, by = "COU") %>%
  left_join(AWCOMP_var$INDICATOR, by = c("INDICATOR")) %>%
  year_to_date %>%
  group_by(Cou) %>%
  left_join(colors, by = c("Cou" = "country")) %>%
  mutate(color = ifelse(COU == "USA", color2, color)) %>%
  rename(Location = Cou) %>%
  ggplot(.) + geom_line(aes(x = date, y = obsValue, color = color, linetype = Indicator)) + 
  scale_color_identity() + add_10flags +
  theme_minimal() + xlab("") + ylab("Wages") +
  scale_x_date(breaks = seq(1910, 2030, 5) %>% paste0("-01-01") %>% as.Date,
               labels = date_format("%Y")) +
  theme(legend.position = c(0.4, 0.95),
        legend.title = element_blank()) +
  scale_y_log10(breaks = 1000*seq(-10, 300, 10),
                     labels = dollar_format(accuracy = 1))

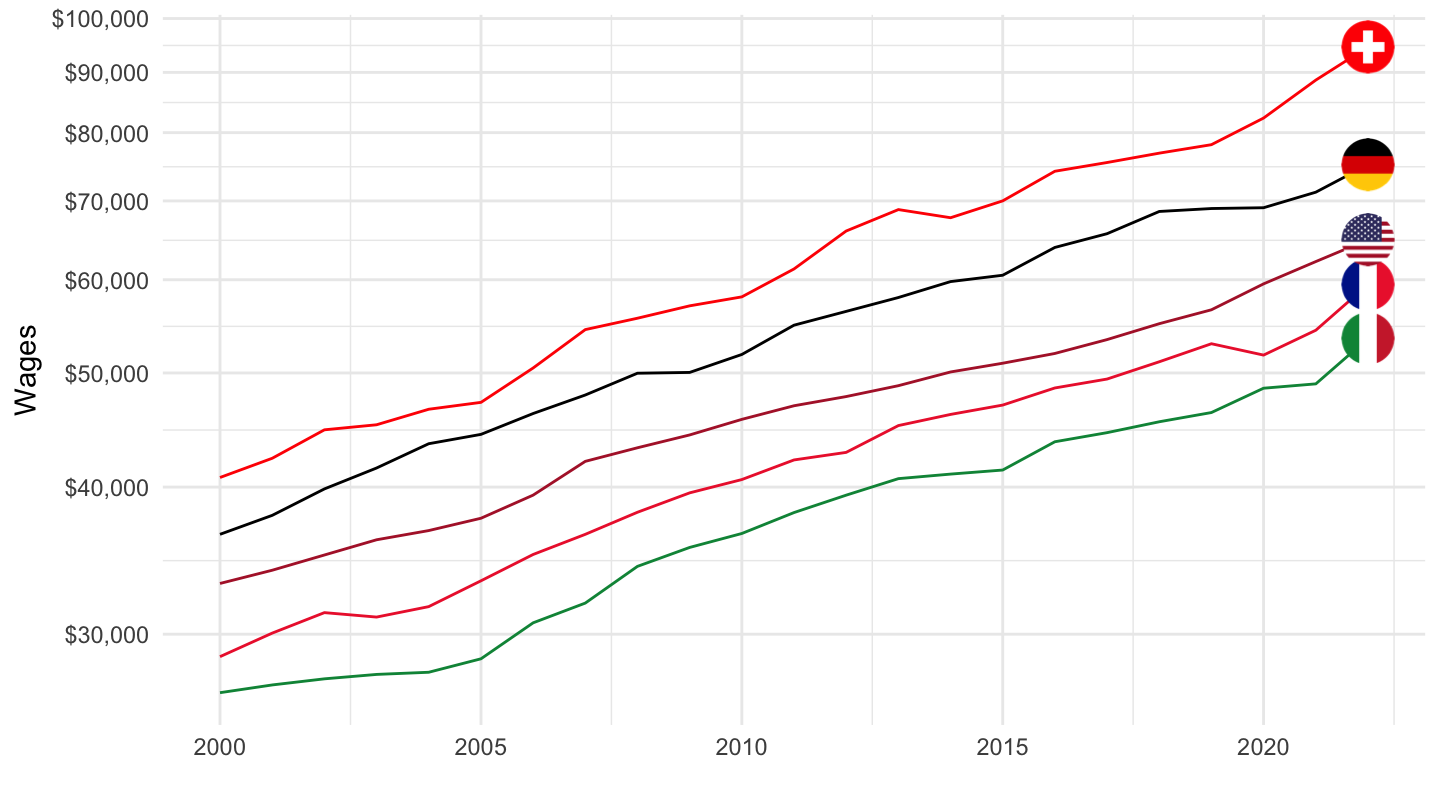
Gross

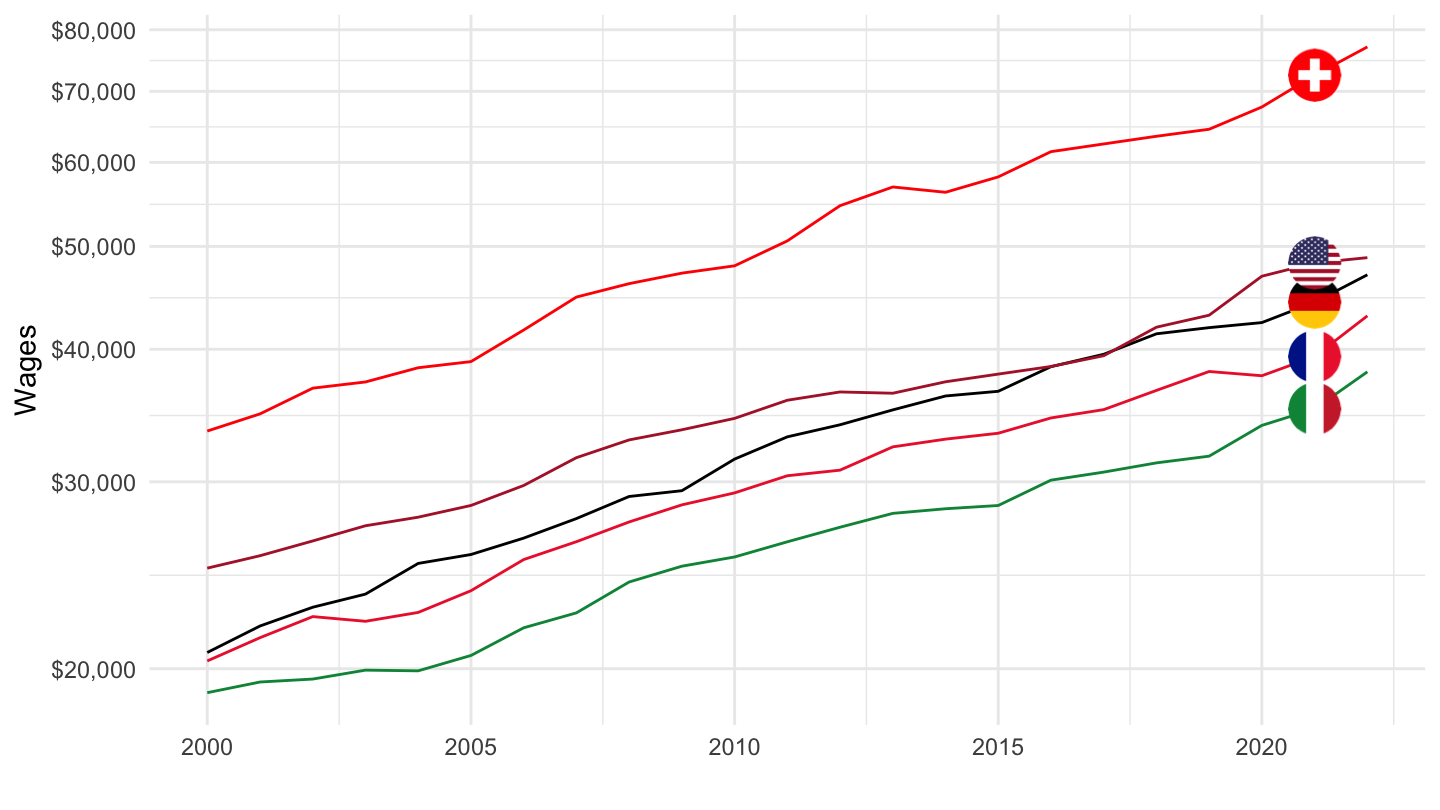
Value

Code
AWCOMP %>%
  filter(COU %in% c("FRA", "DEU", "ITA", "USA", "CHE"),
         INDICATOR %in% c("5_1"),
         FAM_TYPE == "SINGLE2") %>%
  left_join(AWCOMP_var$COU, by = "COU") %>%
  year_to_date %>%
  group_by(Cou) %>%
  left_join(colors, by = c("Cou" = "country")) %>%
  mutate(color = ifelse(COU == "USA", color2, color)) %>%
  rename(Location = Cou) %>%
  ggplot(.) + geom_line(aes(x = date, y = obsValue, color = color)) + 
  scale_color_identity() + add_5flags +
  theme_minimal() + xlab("") + ylab("Wages") +
  scale_x_date(breaks = seq(1910, 2030, 5) %>% paste0("-01-01") %>% as.Date,
               labels = date_format("%Y")) +
  scale_y_log10(breaks = 1000*seq(-10, 300, 10),
                     labels = dollar_format(accuracy = 1))

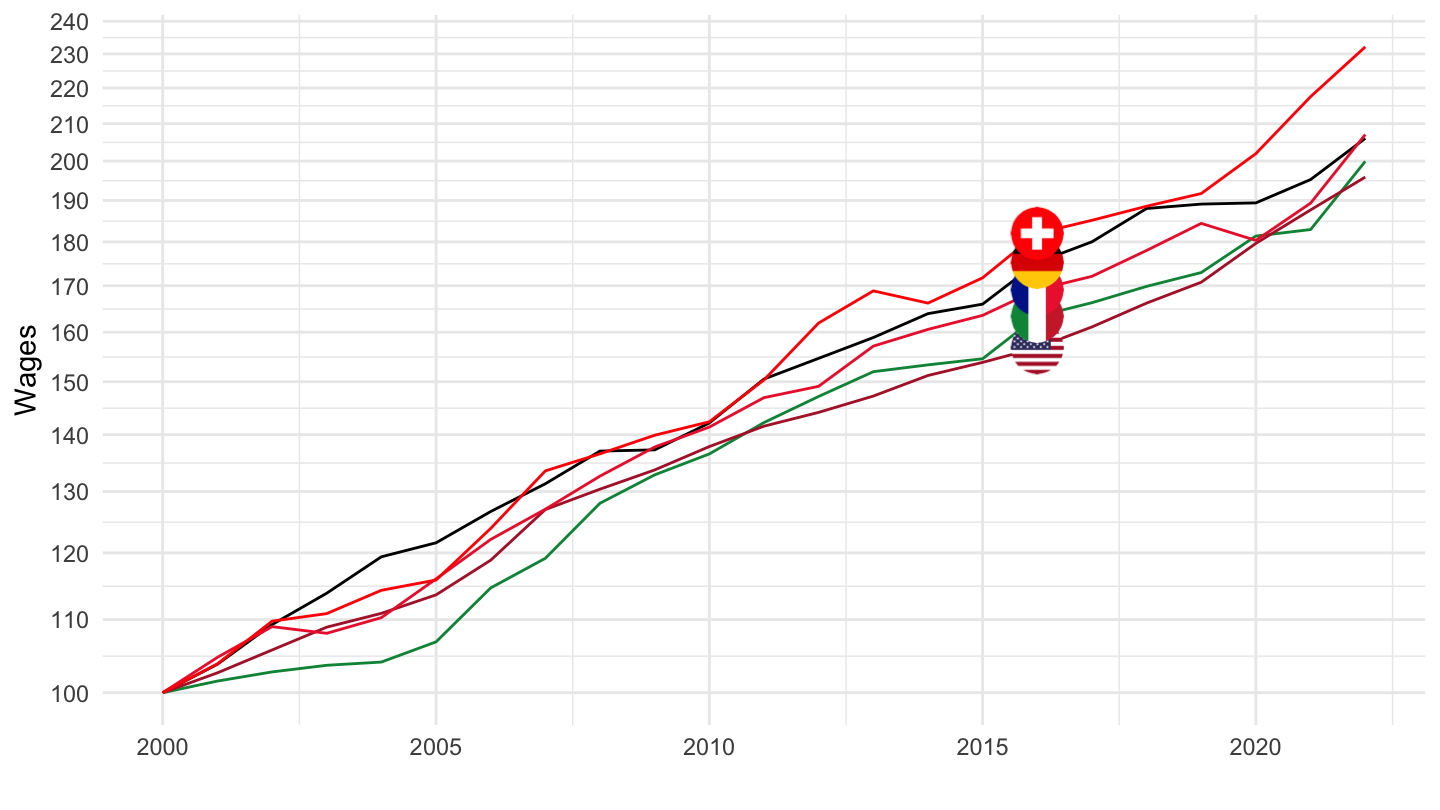
Base 100

Code
AWCOMP %>%
  filter(COU %in% c("FRA", "DEU", "ITA", "USA", "CHE"),
         INDICATOR %in% c("5_1"),
         FAM_TYPE == "SINGLE2") %>%
  left_join(AWCOMP_var$COU, by = "COU") %>%
  year_to_date %>%
  group_by(Cou) %>%
  mutate(obsValue = 100*obsValue/obsValue[date == as.Date("2000-01-01")]) %>%
  left_join(colors, by = c("Cou" = "country")) %>%
  mutate(color = ifelse(COU == "USA", color2, color)) %>%
  rename(Location = Cou) %>%
  ggplot(.) + geom_line(aes(x = date, y = obsValue, color = color)) + 
  scale_color_identity() + add_5flags +
  theme_minimal() + xlab("") + ylab("Wages") +
  scale_x_date(breaks = seq(1910, 2030, 5) %>% paste0("-01-01") %>% as.Date,
               labels = date_format("%Y")) +
  scale_y_log10(breaks = seq(-10, 300, 10),
                     labels = dollar_format(accuracy = 1, prefix = ""))

Net

Value

Code
AWCOMP %>%
  filter(COU %in% c("FRA", "DEU", "ITA", "USA", "CHE"),
         INDICATOR %in% c("5_2"),
         FAM_TYPE == "SINGLE2") %>%
  left_join(AWCOMP_var$COU, by = "COU") %>%
  year_to_date %>%
  group_by(Cou) %>%
  left_join(colors, by = c("Cou" = "country")) %>%
  mutate(color = ifelse(COU == "USA", color2, color)) %>%
  rename(Location = Cou) %>%
  ggplot(.) + geom_line(aes(x = date, y = obsValue, color = color)) + 
  scale_color_identity() + add_5flags +
  theme_minimal() + xlab("") + ylab("Wages") +
  scale_x_date(breaks = seq(1910, 2030, 5) %>% paste0("-01-01") %>% as.Date,
               labels = date_format("%Y")) +
  scale_y_log10(breaks = 1000*seq(-10, 300, 10),
                     labels = dollar_format(accuracy = 1))

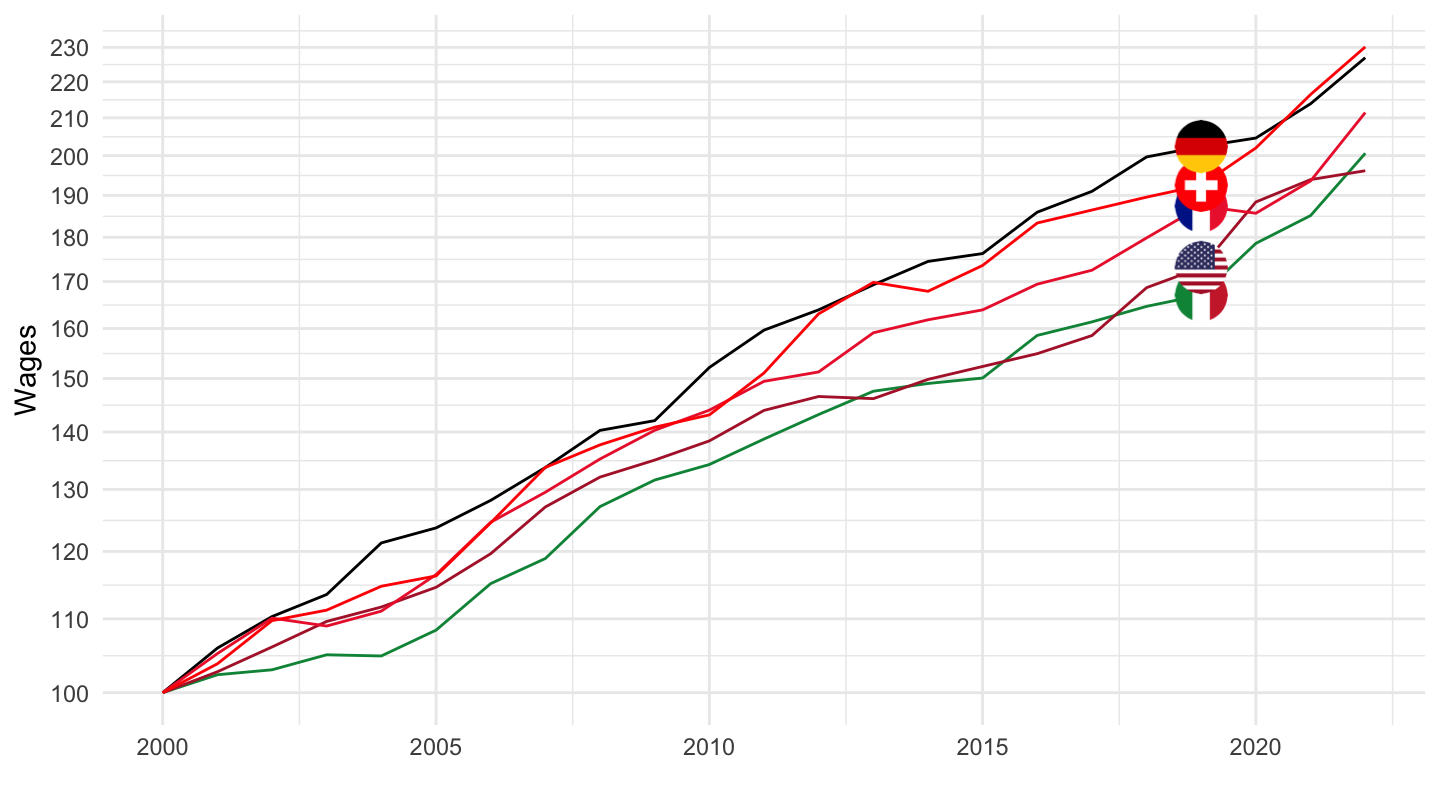
Base 100

Code
AWCOMP %>%
  filter(COU %in% c("FRA", "DEU", "ITA", "USA", "CHE"),
         INDICATOR %in% c("5_2"),
         FAM_TYPE == "SINGLE2") %>%
  left_join(AWCOMP_var$COU, by = "COU") %>%
  year_to_date %>%
  group_by(Cou) %>%
  left_join(colors, by = c("Cou" = "country")) %>%
  mutate(color = ifelse(COU == "USA", color2, color)) %>%
  rename(Location = Cou) %>%
  mutate(obsValue = 100*obsValue/obsValue[date == as.Date("2000-01-01")]) %>%
  ggplot(.) + geom_line(aes(x = date, y = obsValue, color = color)) + 
  scale_color_identity() + add_5flags +
  theme_minimal() + xlab("") + ylab("Wages") +
  scale_x_date(breaks = seq(1910, 2030, 5) %>% paste0("-01-01") %>% as.Date,
               labels = date_format("%Y")) +
  scale_y_log10(breaks = seq(-10, 300, 10),
                     labels = dollar_format(accuracy = 1, prefix = ""))