~/data/oecd/
## Warning: package 'XML' was built under R version 4.3.2
Info
|
source
|
dataset
|
.html
|
.RData
|
|
eurostat
|
tps00071
|
2024-04-15
|
2024-04-09
|
|
oecd
|
ANHRS
|
2024-04-16
|
2024-04-08
|
Info
# [1] 700800
- The data are intended for comparisons of trends over time; they are unsuitable for comparisons of the level of average annual hours of work for a given year, because of differences in their sources and method of calculation.
EMPSTAT
ANHRS %>%
  left_join(ANHRS_var$EMPSTAT, by = "EMPSTAT") %>%
  group_by(EMPSTAT, Empstat) %>%
  summarise(Nobs = n()) %>%
  arrange(-Nobs) %>%
  print_table_conditional()
|
EMPSTAT
|
Empstat
|
Nobs
|
|
TE
|
Total employment
|
2013
|
|
DE
|
Dependent employment
|
1586
|
COUNTRY
All
ANHRS %>%
  left_join(ANHRS_var$COUNTRY, by = "COUNTRY") %>%
  group_by(COUNTRY, Country) %>%
  summarise(Nobs = n()) %>%
  arrange(-Nobs) %>%
  mutate(Flag = gsub(" ", "-", str_to_lower(gsub(" ", "-", Country))),
         Flag = paste0('<img src="../../icon/flag/vsmall/', Flag, '.png" alt="Flag">')) %>%
  select(Flag, everything()) %>%
  {if (is_html_output()) datatable(., filter = 'top', rownames = F, escape = F) else .}
By EMPSTAT
ANHRS %>%
  left_join(ANHRS_var$COUNTRY, by = "COUNTRY") %>%
  left_join(ANHRS_var$EMPSTAT, by = "EMPSTAT") %>%
  group_by(COUNTRY, Country, Empstat) %>%
  summarise(Nobs = n()) %>%
  spread(Empstat, Nobs) %>%
  arrange(-`Total employment`) %>%
  mutate(Flag = gsub(" ", "-", str_to_lower(gsub(" ", "-", Country))),
         Flag = paste0('<img src="../../icon/flag/vsmall/', Flag, '.png" alt="Flag">')) %>%
  select(Flag, everything()) %>%
  {if (is_html_output()) datatable(., filter = 'top', rownames = F, escape = F) else .}
obsTime
ANHRS %>%
  group_by(obsTime) %>%
  summarise(Nobs = n()) %>%
  arrange(desc(obsTime)) %>%
  print_table_conditional()
Both
France, United States
ANHRS %>%
  filter(COUNTRY %in% c("FRA", "USA")) %>%
  left_join(ANHRS_var$EMPSTAT, by = "EMPSTAT") %>%
  left_join(ANHRS_var$COUNTRY, by = "COUNTRY") %>%
  mutate(Empstat = factor(Empstat, levels = c("Total employment", "Dependent employment"))) %>%
  year_to_date %>%
  left_join(colors, by = c("Country" = "country")) %>%
  rename(Location = Country) %>%
  ggplot(.) + geom_line(aes(x = date, y = obsValue, color = color, linetype = Empstat)) +
  scale_color_identity() + add_4flags + theme_minimal() +
  ylab("Hours worked per worker, per year") + xlab("") +
  scale_x_date(breaks = seq(1920, 2025, 10) %>% paste0("-01-01") %>% as.Date,
               labels = date_format("%Y")) +
  scale_y_log10(breaks = seq(100, 3000, 100),
                     labels = dollar_format(prefix = "", suffix = " hrs / year", acc = 1)) +
  theme(legend.position = c(0.7, 0.9),
        legend.title = element_blank())

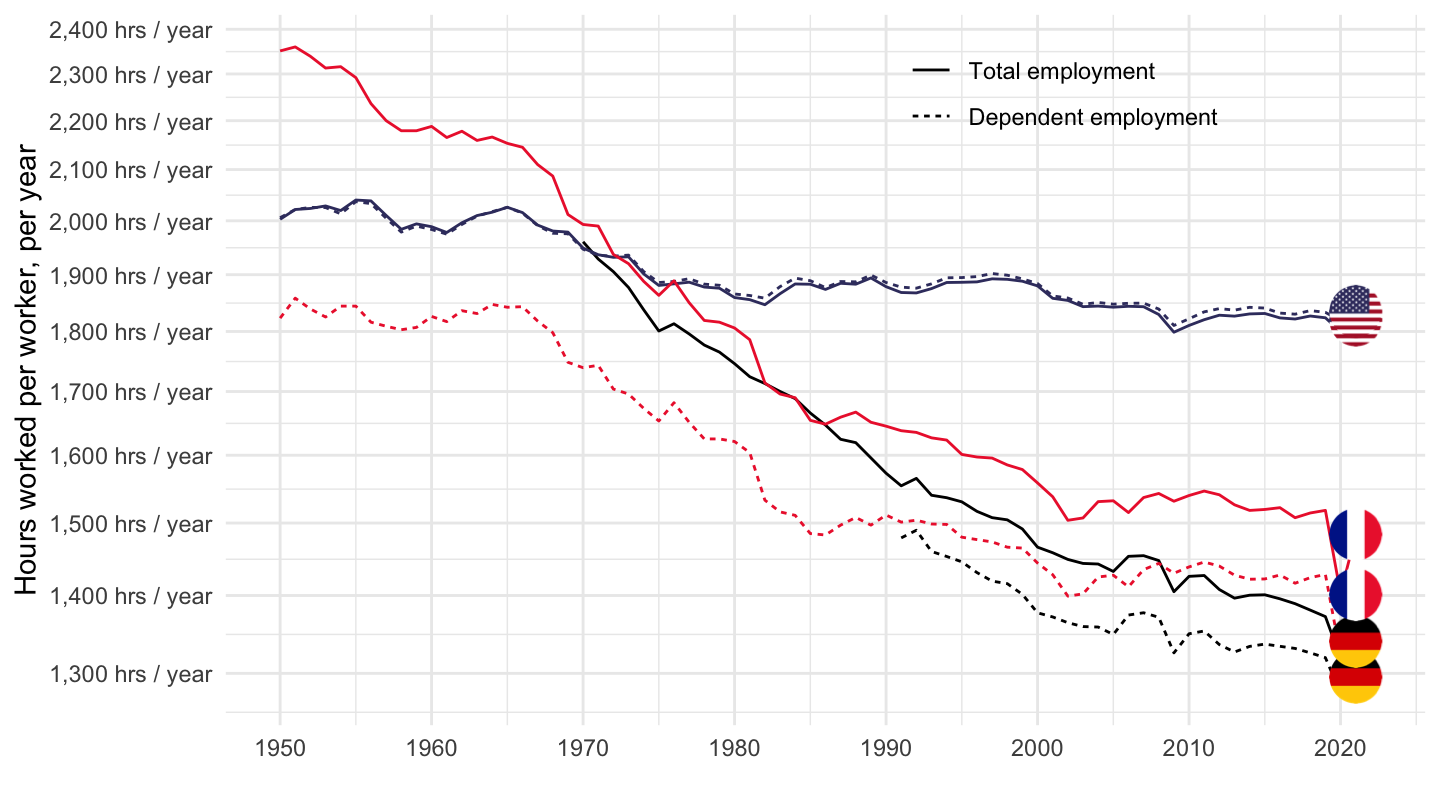
France, United States, Germany
ANHRS %>%
  filter(COUNTRY %in% c("FRA", "USA", "DEU")) %>%
  left_join(ANHRS_var$EMPSTAT, by = "EMPSTAT") %>%
  left_join(ANHRS_var$COUNTRY, by = "COUNTRY") %>%
  mutate(Empstat = factor(Empstat, levels = c("Total employment", "Dependent employment"))) %>%
  year_to_date %>%
  left_join(colors, by = c("Country" = "country")) %>%
  rename(Location = Country) %>%
  ggplot(.) + geom_line(aes(x = date, y = obsValue, color = color, linetype = Empstat)) +
  scale_color_identity() + add_6flags + theme_minimal() +
  ylab("Hours worked per worker, per year") + xlab("") +
  scale_x_date(breaks = seq(1920, 2025, 10) %>% paste0("-01-01") %>% as.Date,
               labels = date_format("%Y")) +
  scale_y_log10(breaks = seq(100, 3000, 100),
                     labels = dollar_format(prefix = "", suffix = " hrs / year", acc = 1)) +
  theme(legend.position = c(0.7, 0.9),
        legend.title = element_blank())
Total Employment
2019
ANHRS %>%
  filter(obsTime == "2019") %>%
  left_join(ANHRS_var$COUNTRY, by = "COUNTRY") %>%
  left_join(ANHRS_var$EMPSTAT, by = "EMPSTAT") %>%
  select_if(~ n_distinct(.) > 1) %>%
  select(-COUNTRY, -EMPSTAT) %>%
  spread(Empstat, obsValue) %>%
  arrange(`Total employment`) %>%
  mutate(Flag = gsub(" ", "-", str_to_lower(gsub(" ", "-", Country))),
         Flag = paste0('<img src="../../icon/flag/vsmall/', Flag, '.png" alt="Flag">')) %>%
  select(Flag, everything()) %>%
  {if (is_html_output()) datatable(., filter = 'top', rownames = F, escape = F) else .}
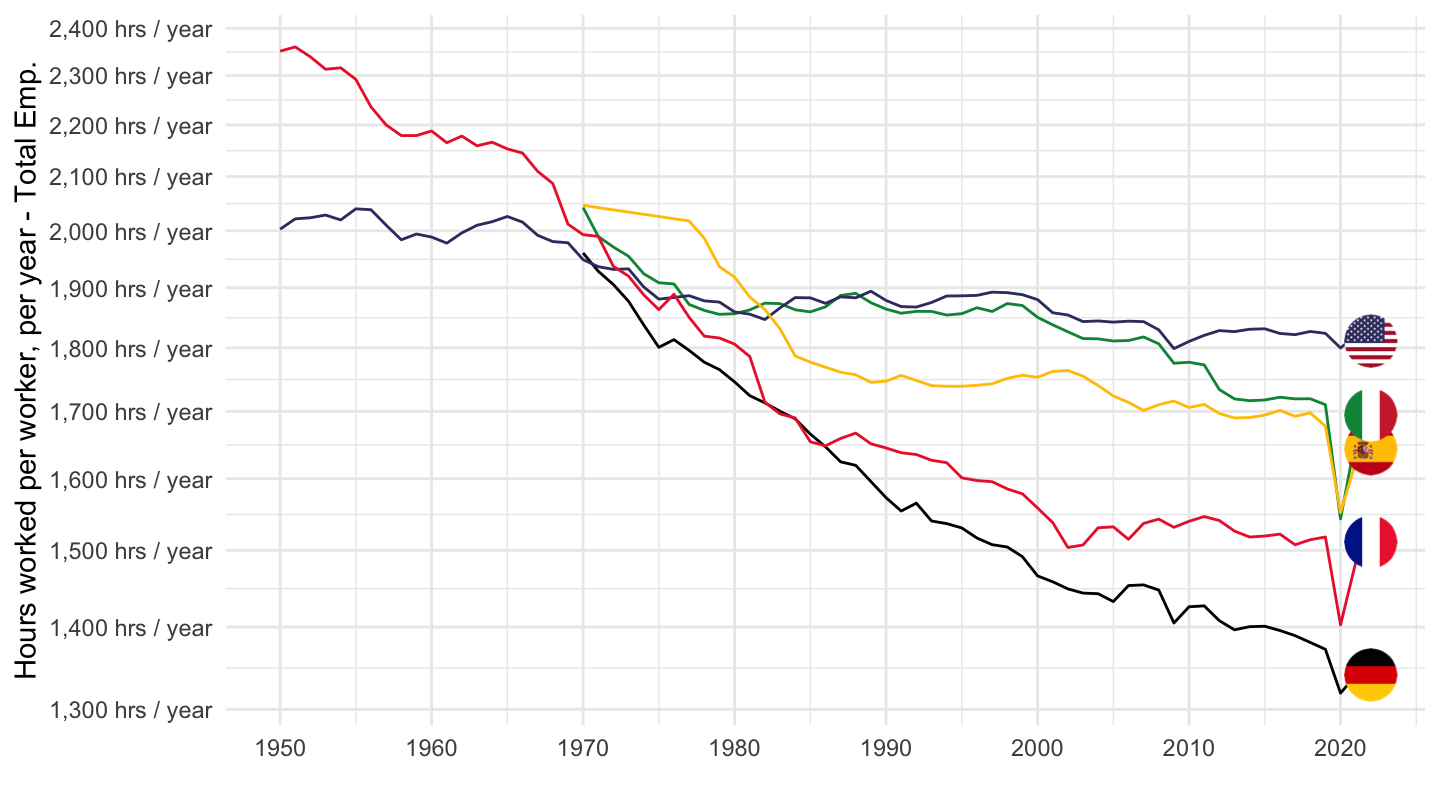
France, Germany, Italy, United States, Spain
All
ANHRS %>%
  filter(COUNTRY %in% c("DEU", "FRA", "ITA", "USA", "ESP"),
         EMPSTAT == "TE") %>%
  left_join(ANHRS_var$COUNTRY, by = "COUNTRY") %>%
  year_to_date %>%
  left_join(colors, by = c("Country" = "country")) %>%
  rename(Location = Country) %>%
  ggplot(.) + geom_line(aes(x = date, y = obsValue, color = color)) +
  scale_color_identity() + add_5flags + theme_minimal() +
  ylab("Hours worked per worker, per year - Total Emp.") + xlab("") +
  scale_x_date(breaks = seq(1920, 2025, 10) %>% paste0("-01-01") %>% as.Date,
               labels = date_format("%Y")) +
  scale_y_log10(breaks = seq(100, 3000, 100),
                     labels = dollar_format(prefix = "", suffix = " hrs / year", acc = 1))
1995-
Heures / an
ANHRS %>%
  filter(COUNTRY %in% c("DEU", "FRA", "ITA", "USA", "ESP"),
         EMPSTAT == "TE") %>%
  left_join(ANHRS_var$COUNTRY, by = "COUNTRY") %>%
  year_to_date %>%
  filter(date >= as.Date("1995-01-01")) %>%
  left_join(colors, by = c("Country" = "country")) %>%
  rename(Location = Country) %>%
  mutate(color = ifelse(COUNTRY == "USA", color2, color)) %>%
  ggplot(.) + geom_line(aes(x = date, y = obsValue, color = color)) +
  scale_color_identity() + add_5flags + theme_minimal() +
  ylab("Heures par travailleur, par an") + xlab("") +
  scale_x_date(breaks = seq(1920, 2025, 5) %>% paste0("-01-01") %>% as.Date,
               labels = date_format("%Y")) +
  scale_y_log10(breaks = seq(100, 3000, 100),
                     labels = dollar_format(prefix = "", suffix = " h/ans", acc = 1))

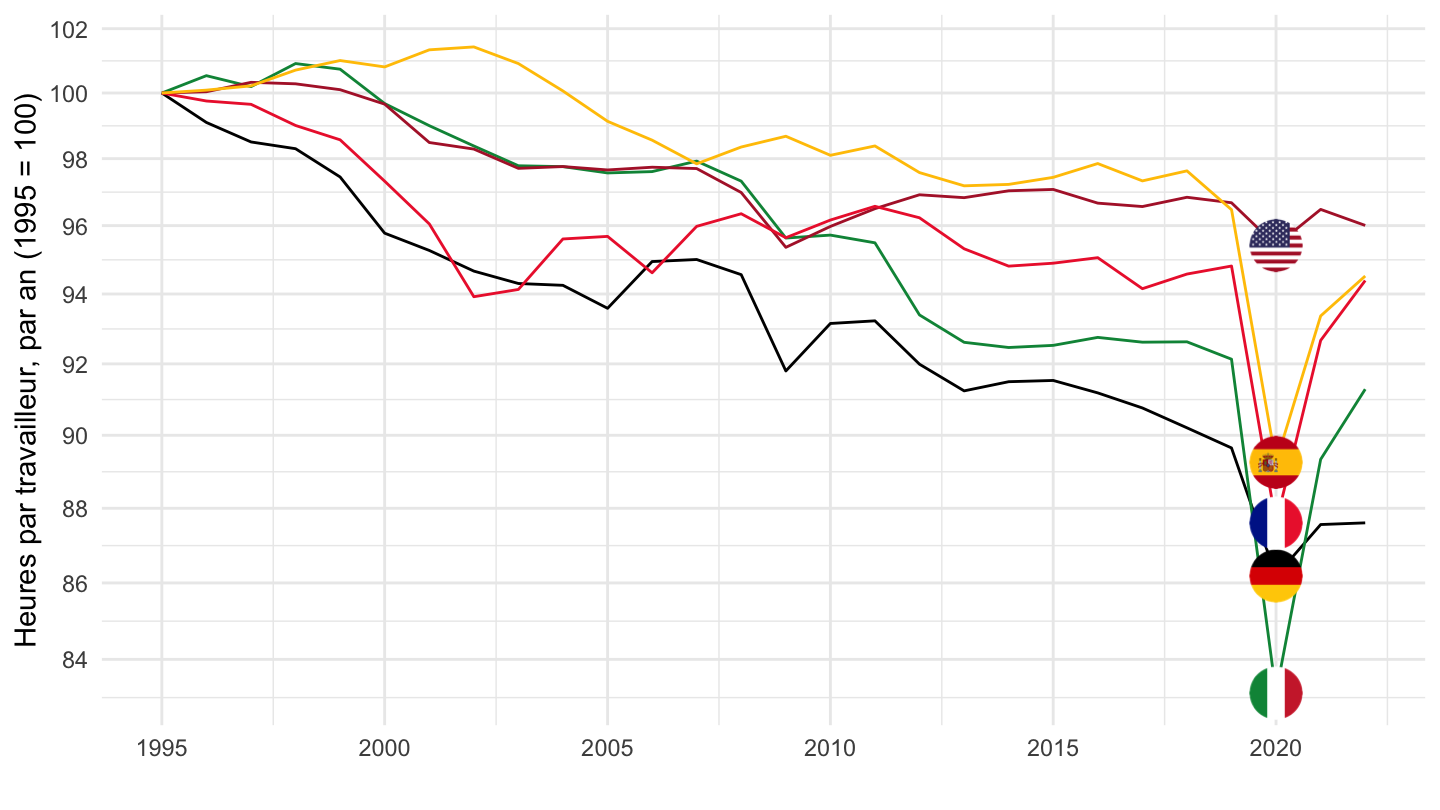
Indice = 100
ANHRS %>%
  filter(COUNTRY %in% c("DEU", "FRA", "ITA", "USA", "ESP"),
         EMPSTAT == "TE") %>%
  left_join(ANHRS_var$COUNTRY, by = "COUNTRY") %>%
  year_to_date %>%
  filter(date >= as.Date("1995-01-01")) %>%
  left_join(colors, by = c("Country" = "country")) %>%
  mutate(color = ifelse(COUNTRY == "USA", color2, color)) %>%
  rename(Location = Country) %>%
  group_by(Location) %>%
  mutate(obsValue = 100*obsValue/obsValue[date == as.Date("1995-01-01")]) %>%
  ggplot(.) + geom_line(aes(x = date, y = obsValue, color = color)) +
  scale_color_identity() + add_5flags + theme_minimal() +
  ylab("Heures par travailleur, par an (1995 = 100)") + xlab("") +
  scale_x_date(breaks = seq(1920, 2025, 5) %>% paste0("-01-01") %>% as.Date,
               labels = date_format("%Y")) +
  scale_y_log10(breaks = seq(10, 300, 2))
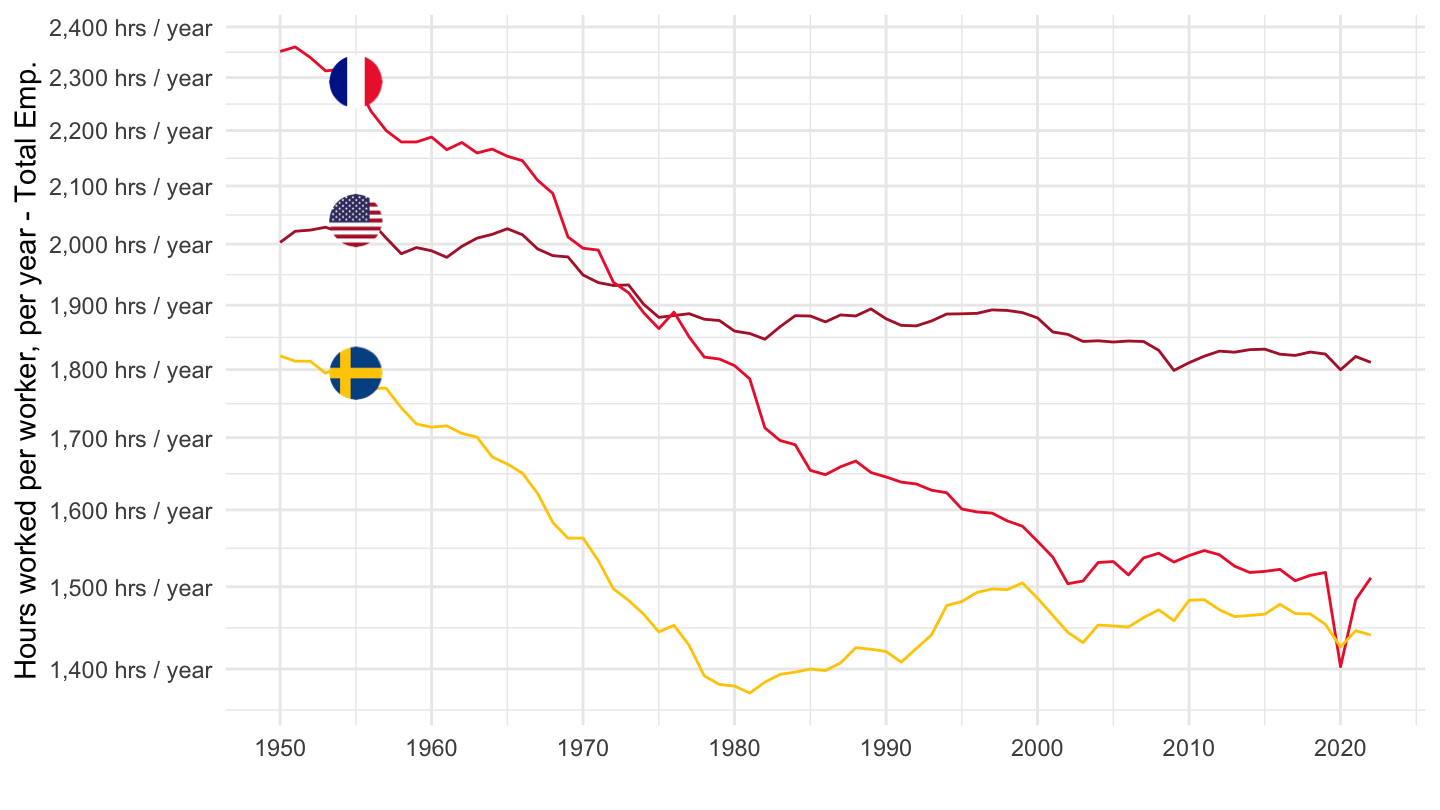
France, Sweden, United States
ANHRS %>%
  filter(COUNTRY %in% c("SWE", "FRA", "USA"),
         EMPSTAT == "TE") %>%
  left_join(ANHRS_var$COUNTRY, by = "COUNTRY") %>%
  year_to_date %>%
  left_join(colors, by = c("Country" = "country")) %>%
  mutate(color = ifelse(COUNTRY == "USA", color2, color)) %>%
  rename(Location = Country) %>%
  ggplot(.) + geom_line(aes(x = date, y = obsValue, color = color)) +
  scale_color_identity() + add_3flags + theme_minimal() +
  ylab("Hours worked per worker, per year - Total Emp.") + xlab("") +
  scale_x_date(breaks = seq(1920, 2025, 10) %>% paste0("-01-01") %>% as.Date,
               labels = date_format("%Y")) +
  scale_y_log10(breaks = seq(100, 3000, 100),
                     labels = dollar_format(prefix = "", suffix = " hrs / year", acc = 1))
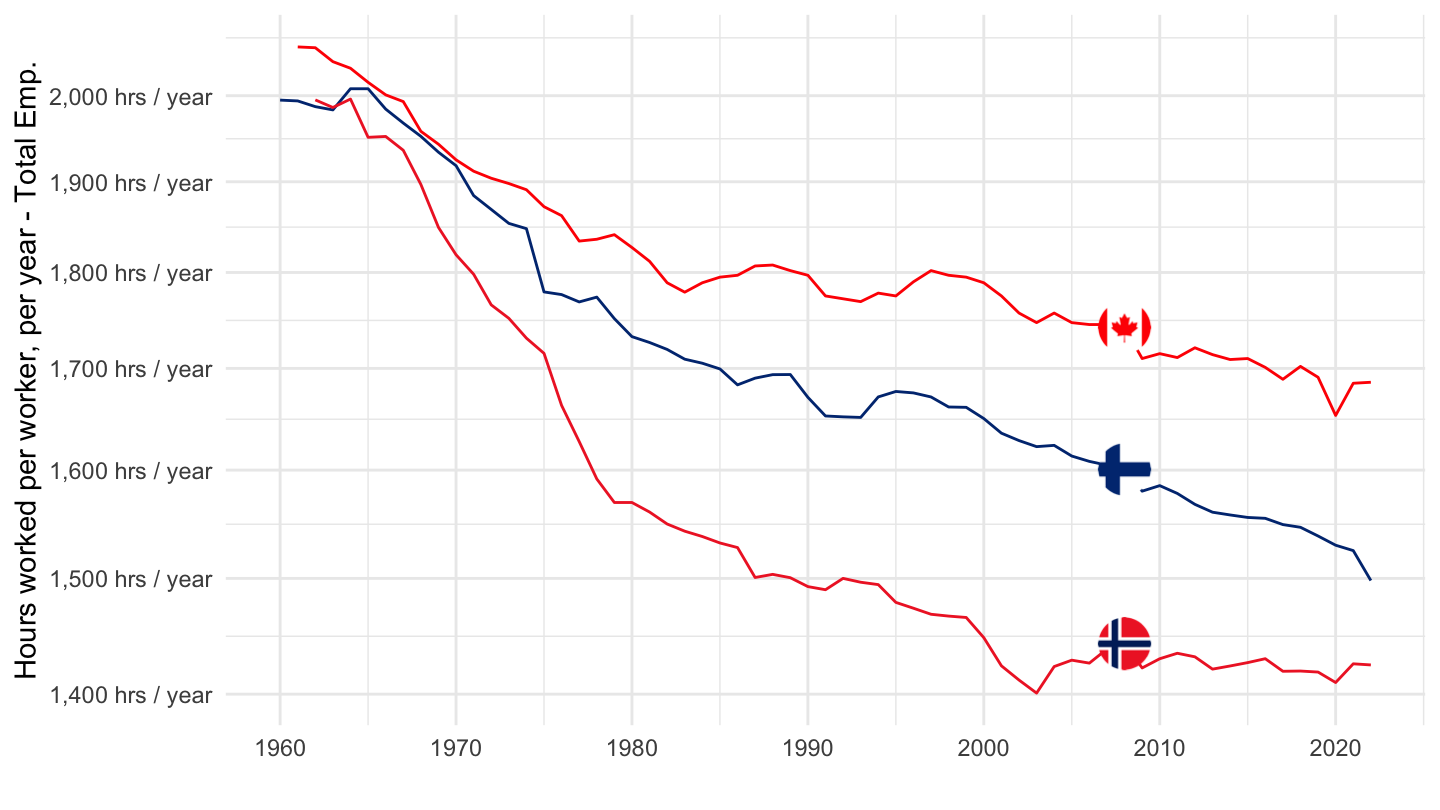
Canada, Finland, Norway
ANHRS %>%
  filter(COUNTRY %in% c("FIN", "CAN", "NOR"),
         EMPSTAT == "TE") %>%
  left_join(ANHRS_var$COUNTRY, by = "COUNTRY") %>%
  year_to_date %>%
  left_join(colors, by = c("Country" = "country")) %>%
  mutate(color = ifelse(COUNTRY == "USA", color2, color)) %>%
  rename(Location = Country) %>%
  ggplot(.) + geom_line(aes(x = date, y = obsValue, color = color)) +
  scale_color_identity() + add_3flags + theme_minimal() +
  ylab("Hours worked per worker, per year - Total Emp.") + xlab("") +
  scale_x_date(breaks = seq(1920, 2025, 10) %>% paste0("-01-01") %>% as.Date,
               labels = date_format("%Y")) +
  scale_y_log10(breaks = seq(100, 3000, 100),
                     labels = dollar_format(prefix = "", suffix = " hrs / year", acc = 1))
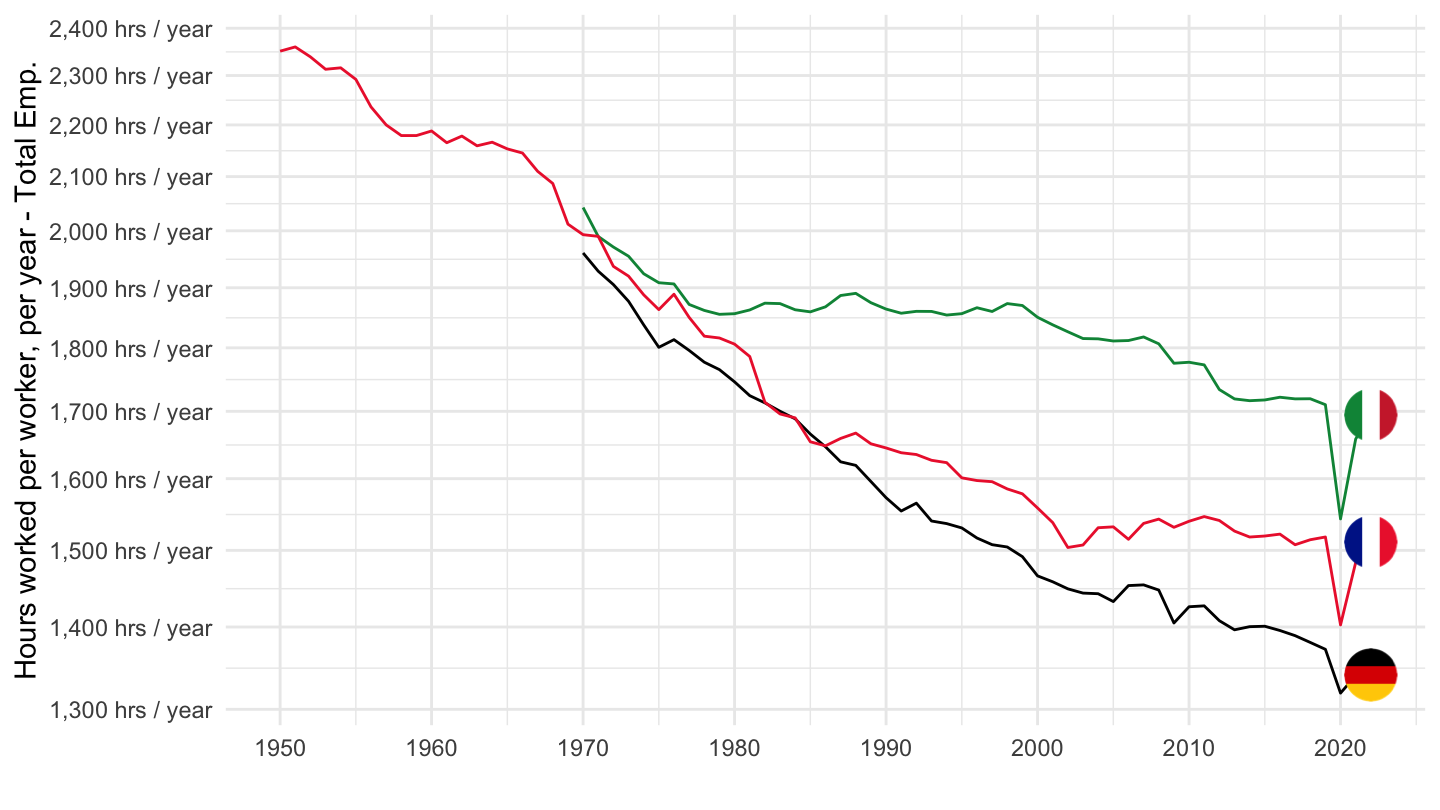
France, Germany, Italy
All
ANHRS %>%
  filter(COUNTRY %in% c("DEU", "FRA", "ITA"),
         EMPSTAT == "TE") %>%
  left_join(ANHRS_var$COUNTRY, by = "COUNTRY") %>%
  year_to_date %>%
  left_join(colors, by = c("Country" = "country")) %>%
  rename(Location = Country) %>%
  ggplot(.) + geom_line(aes(x = date, y = obsValue, color = color)) +
  scale_color_identity() + add_3flags + theme_minimal() +
  ylab("Hours worked per worker, per year - Total Emp.") + xlab("") +
  scale_x_date(breaks = seq(1920, 2025, 10) %>% paste0("-01-01") %>% as.Date,
               labels = date_format("%Y")) +
  scale_y_log10(breaks = seq(100, 3000, 100),
                     labels = dollar_format(prefix = "", suffix = " hrs / year", acc = 1))
1970-
ANHRS %>%
  filter(COUNTRY %in% c("DEU", "FRA", "ITA"),
         EMPSTAT == "TE") %>%
  left_join(ANHRS_var$COUNTRY, by = "COUNTRY") %>%
  year_to_date %>%
  left_join(colors, by = c("Country" = "country")) %>%
  rename(Location = Country) %>%
  filter(date >= as.Date("1970-01-01")) %>%
  ggplot(.) + geom_line(aes(x = date, y = obsValue, color = color)) +
  scale_color_identity() + add_3flags + theme_minimal() +
  ylab("Hours worked per worker, per year - Total Emp.") + xlab("") +
  scale_x_date(breaks = seq(1920, 2025, 10) %>% paste0("-01-01") %>% as.Date,
               labels = date_format("%Y")) +
  scale_y_log10(breaks = seq(100, 3000, 100),
                     labels = dollar_format(prefix = "", suffix = " hrs / year", acc = 1))

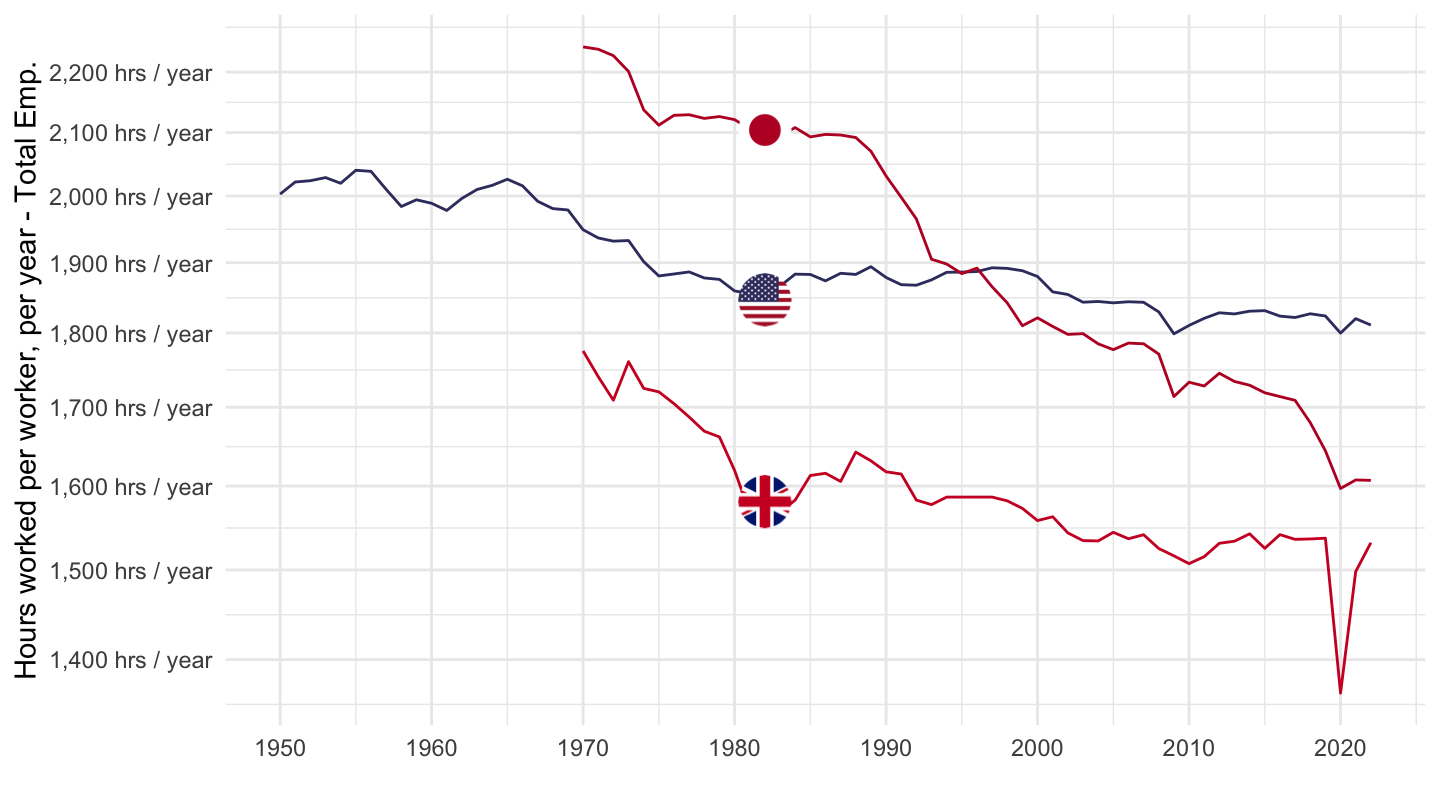
Japan, United Kingdom, United States
ANHRS %>%
  filter(COUNTRY %in% c("GBR", "JPN", "USA"),
         EMPSTAT == "TE") %>%
  left_join(ANHRS_var$COUNTRY, by = "COUNTRY") %>%
  year_to_date %>%
  left_join(colors, by = c("Country" = "country")) %>%
  rename(Location = Country) %>%
  ggplot(.) + geom_line(aes(x = date, y = obsValue, color = color)) +
  scale_color_identity() + add_3flags + theme_minimal() +
  ylab("Hours worked per worker, per year - Total Emp.") + xlab("") +
  scale_x_date(breaks = seq(1920, 2025, 10) %>% paste0("-01-01") %>% as.Date,
               labels = date_format("%Y")) +
  scale_y_log10(breaks = seq(100, 3000, 100),
                     labels = dollar_format(prefix = "", suffix = " hrs / year", acc = 1))
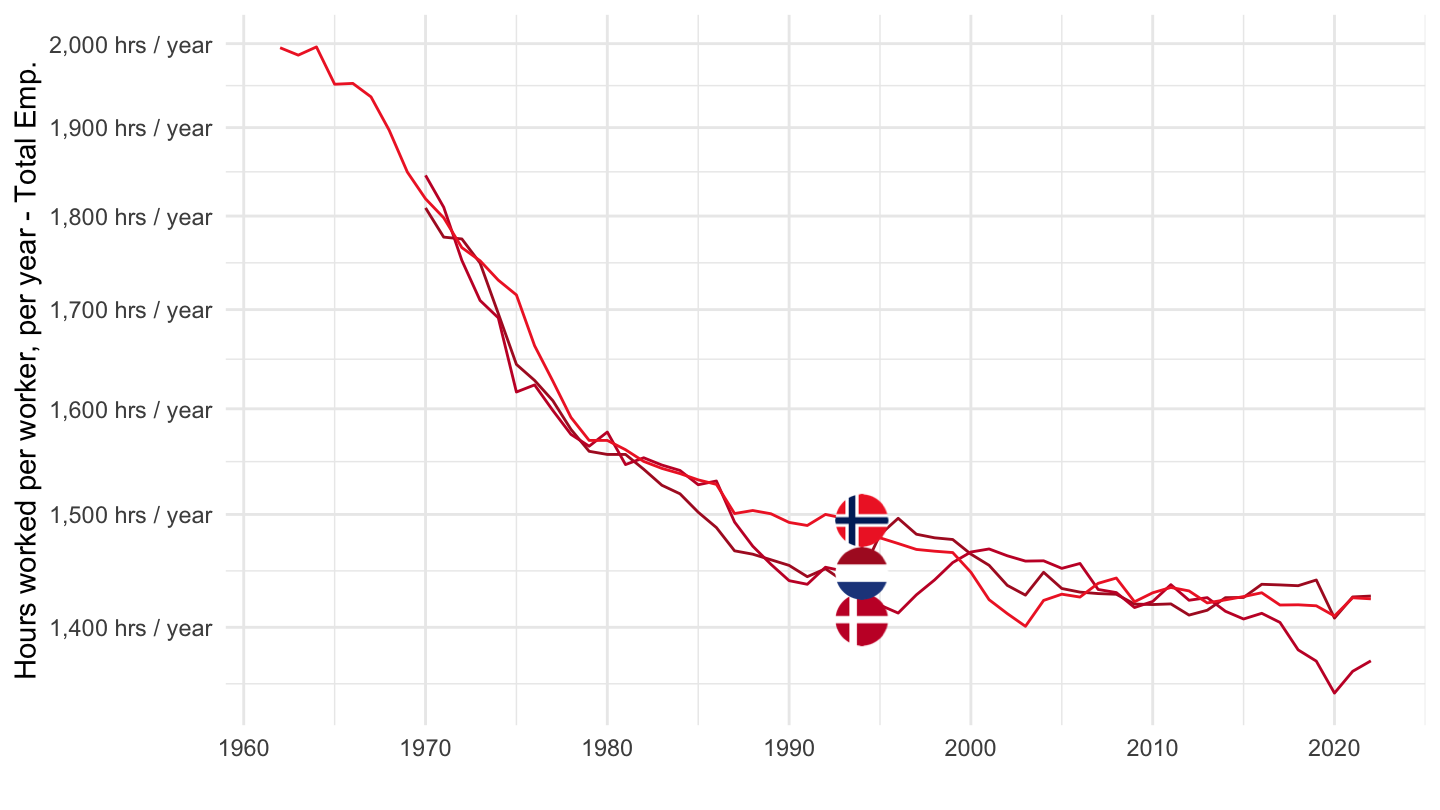
Denmark, Netherlands, Norway
ANHRS %>%
  filter(COUNTRY %in% c("NLD", "DNK", "NOR"),
         EMPSTAT == "TE") %>%
  left_join(ANHRS_var$COUNTRY, by = "COUNTRY") %>%
  year_to_date %>%
  left_join(colors, by = c("Country" = "country")) %>%
  rename(Location = Country) %>%
  ggplot(.) + geom_line(aes(x = date, y = obsValue, color = color)) +
  scale_color_identity() + add_3flags + theme_minimal() +
  ylab("Hours worked per worker, per year - Total Emp.") + xlab("") +
  scale_x_date(breaks = seq(1920, 2025, 10) %>% paste0("-01-01") %>% as.Date,
               labels = date_format("%Y")) +
  scale_y_log10(breaks = seq(100, 3000, 100),
                     labels = dollar_format(prefix = "", suffix = " hrs / year", acc = 1))
Dependent Employment
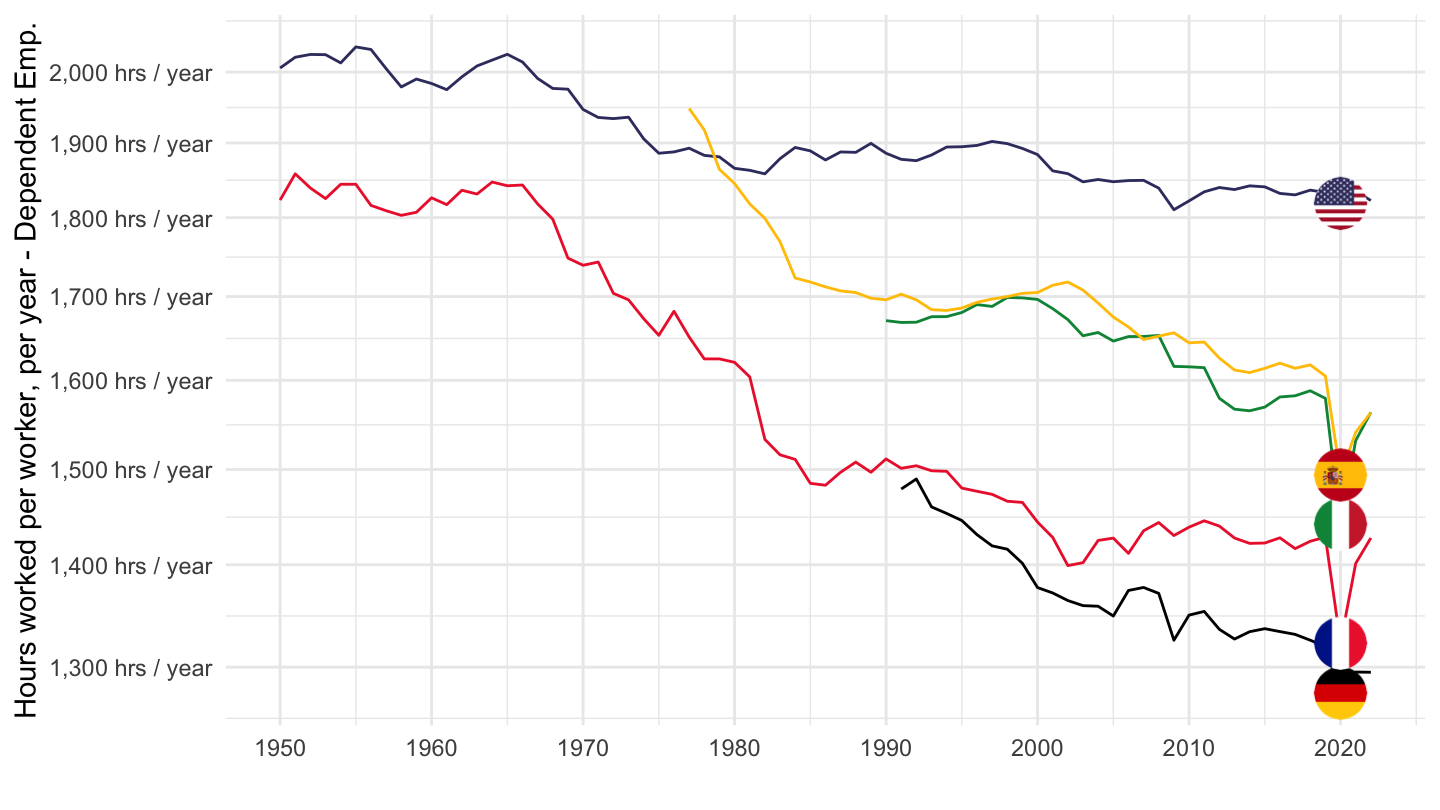
France, Germany, Italy, United States, Spain
All
ANHRS %>%
  filter(COUNTRY %in% c("DEU", "FRA", "ITA", "USA", "ESP"),
         EMPSTAT == "DE") %>%
  left_join(ANHRS_var$COUNTRY, by = "COUNTRY") %>%
  year_to_date %>%
  left_join(colors, by = c("Country" = "country")) %>%
  rename(Location = Country) %>%
  ggplot(.) + geom_line(aes(x = date, y = obsValue, color = color)) +
  scale_color_identity() + add_5flags + theme_minimal() +
  ylab("Hours worked per worker, per year - Dependent Emp.") + xlab("") +
  scale_x_date(breaks = seq(1920, 2025, 10) %>% paste0("-01-01") %>% as.Date,
               labels = date_format("%Y")) +
  scale_y_log10(breaks = seq(100, 3000, 100),
                     labels = dollar_format(prefix = "", suffix = " hrs / year", acc = 1))
France, Germany, Italy
ANHRS %>%
  filter(COUNTRY %in% c("DEU", "FRA", "ITA"),
         EMPSTAT == "DE") %>%
  left_join(ANHRS_var$COUNTRY, by = "COUNTRY") %>%
  year_to_date %>%
  left_join(colors, by = c("Country" = "country")) %>%
  rename(Location = Country) %>%
  ggplot(.) + geom_line(aes(x = date, y = obsValue, color = color)) +
  scale_color_identity() + add_3flags + theme_minimal() +
  ylab("Hours worked per worker, per year - Dependent Emp.") + xlab("") +
  scale_x_date(breaks = seq(1920, 2025, 10) %>% paste0("-01-01") %>% as.Date,
               labels = date_format("%Y")) +
  scale_y_log10(breaks = seq(100, 3000, 100),
                     labels = dollar_format(prefix = "", suffix = " hrs / year", acc = 1))

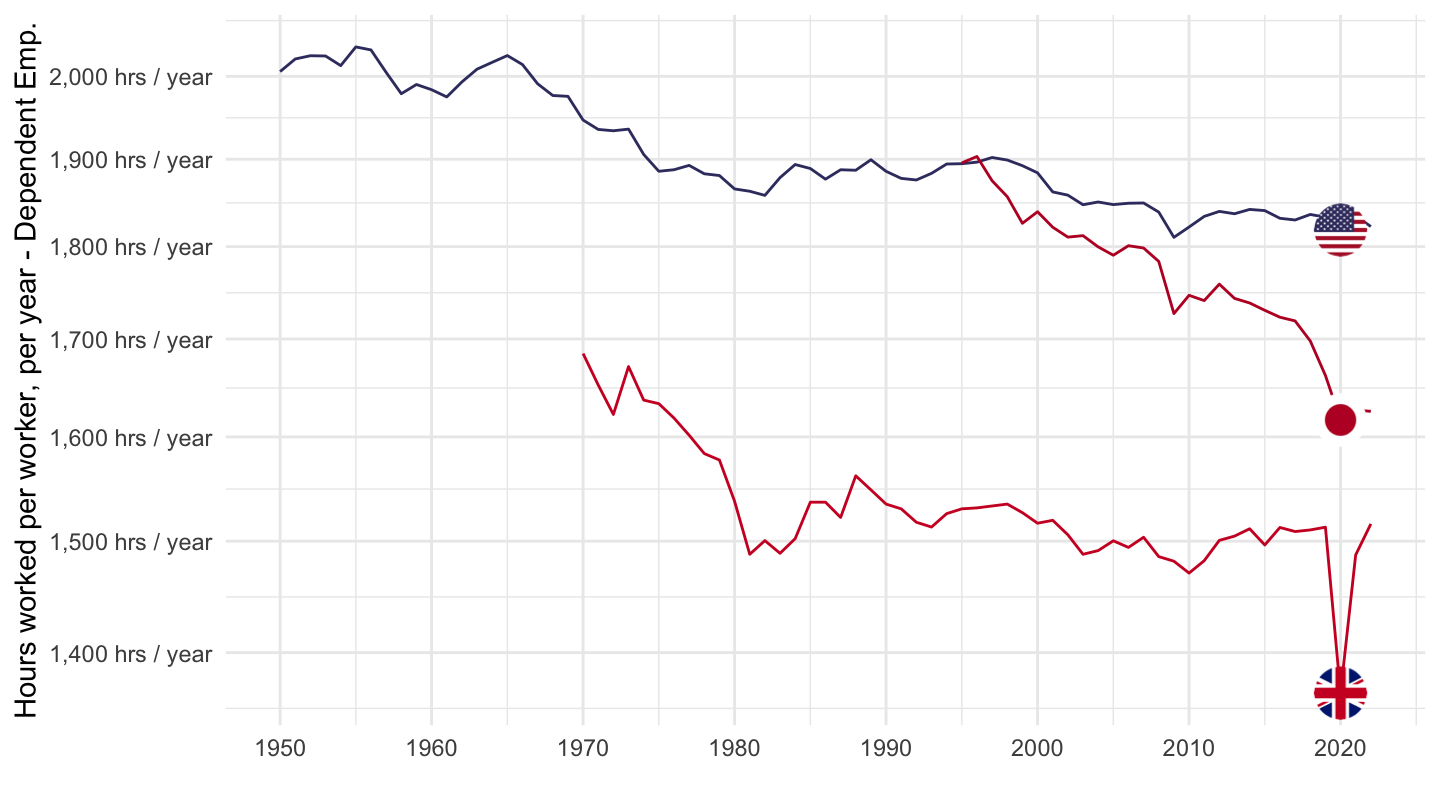
Japan, United Kingdom, United States
ANHRS %>%
  filter(COUNTRY %in% c("GBR", "JPN", "USA"),
         EMPSTAT == "DE") %>%
  left_join(ANHRS_var$COUNTRY, by = "COUNTRY") %>%
  year_to_date %>%
  left_join(colors, by = c("Country" = "country")) %>%
  rename(Location = Country) %>%
  ggplot(.) + geom_line(aes(x = date, y = obsValue, color = color)) +
  scale_color_identity() + add_3flags + theme_minimal() +
  ylab("Hours worked per worker, per year - Dependent Emp.") + xlab("") +
  scale_x_date(breaks = seq(1920, 2025, 10) %>% paste0("-01-01") %>% as.Date,
               labels = date_format("%Y")) +
  scale_y_log10(breaks = seq(100, 3000, 100),
                     labels = dollar_format(prefix = "", suffix = " hrs / year", acc = 1))
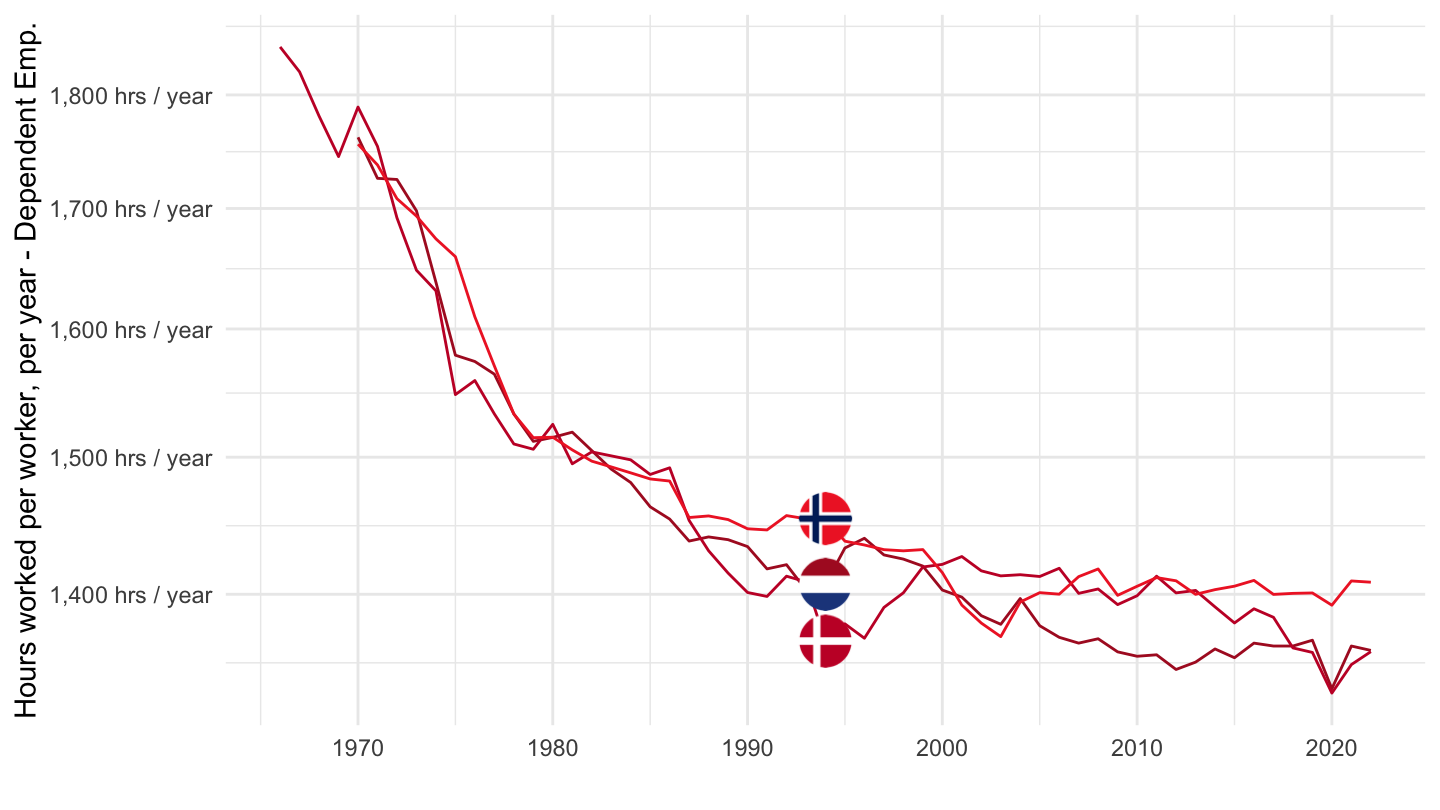
Denmark, Netherlands, Norway
ANHRS %>%
  filter(COUNTRY %in% c("DNK", "NLD", "NOR"),
         EMPSTAT == "DE") %>%
  left_join(ANHRS_var$COUNTRY, by = "COUNTRY") %>%
  year_to_date %>%
  left_join(colors, by = c("Country" = "country")) %>%
  rename(Location = Country) %>%
  ggplot(.) + geom_line(aes(x = date, y = obsValue, color = color)) +
  scale_color_identity() + add_3flags + theme_minimal() +
  ylab("Hours worked per worker, per year - Dependent Emp.") + xlab("") +
  scale_x_date(breaks = seq(1920, 2025, 10) %>% paste0("-01-01") %>% as.Date,
               labels = date_format("%Y")) +
  scale_y_log10(breaks = seq(100, 3000, 100),
                     labels = dollar_format(prefix = "", suffix = " hrs / year", acc = 1))
