
Last observation: 2025 (N = 36)
First observation: 2014 (N = 37)
Last data update: 11 sept. 2026, 22:53
Last compile: 05 oct. 2026, 00:14
tps00071 |>
  filter(time %in% c("2008", "2011", "2014", "2019")) |>

  select(geo, Geo, time, values) |>
  spread(time, values) |>
  arrange(-`2019`) %>%
{if (is_html_output()) datatable(., filter = 'top', rownames = F) else .}tps00071 |>
filter(geo %in% c("FR", "DE", "PT")) |>
year_to_enddate() |>
add_flag_color("Geo") |>
ggplot() + geom_line() + theme_minimal() +
aes(x = date, y = values, color = color) +
scale_color_identity() + add_flags +
scale_x_date(breaks = as.Date(paste0(seq(1960, 2100, 1), "-01-01")),
labels = date_format("%Y")) +
scale_y_continuous(breaks = seq(40, 44, 0.2)) +
theme(legend.position = c(0.3, 0.85),
legend.title = element_blank()) +
xlab("") + ylab("Hours worked per week of full-time employment")
tps00071 |>
  filter(geo %in% c("FR", "IT", "EL")) |>
  year_to_enddate() |>

  add_flag_color("Geo") |>
  ggplot() + geom_line() + theme_minimal()  +
  aes(x = date, y = values, color = color) +
  scale_color_identity() + add_flags +
  scale_x_date(breaks = as.Date(paste0(seq(1960, 2100, 1), "-01-01")),
               labels = date_format("%Y")) +
  scale_y_continuous(breaks = seq(40, 50, 0.5)) +
  theme(legend.position = c(0.15, 0.55),
        legend.title = element_blank()) +
  xlab("") + ylab("Hours worked per week of full-time employment")
tps00071 |>
  filter(geo %in% c("NL", "DK", "SE")) |>
  year_to_enddate() |>

  add_flag_color("Geo") |>
  ggplot() + geom_line(aes(x = date, y = values, color = color)) + theme_minimal() +
  scale_color_identity() + add_flags +
  scale_x_date(breaks = as.Date(paste0(seq(1960, 2100, 1), "-01-01")),
               labels = date_format("%Y")) +
  xlab("") + ylab("Hours worked per week of full-time employment")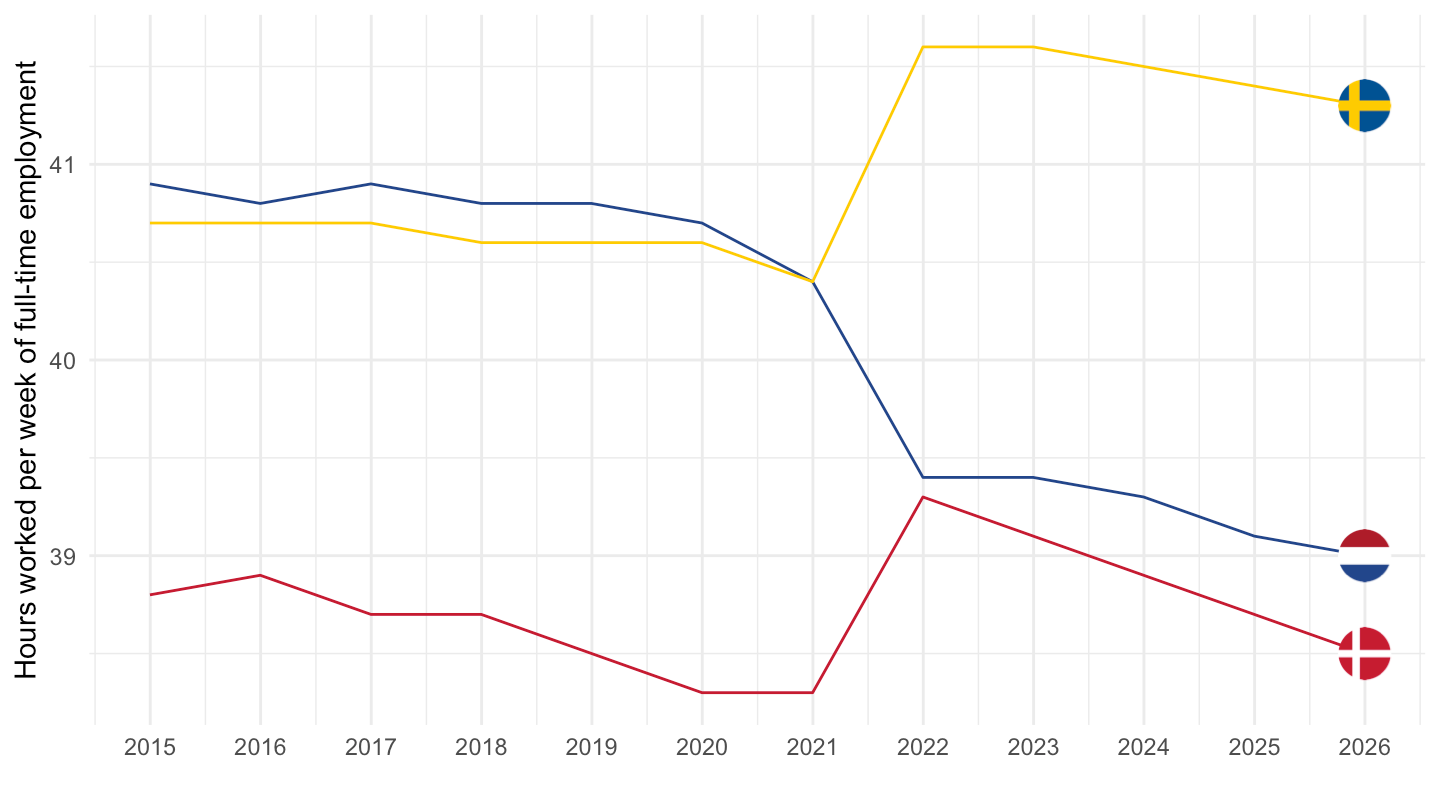
latest_y <- tps00071 |>
  filter(!is.na(values)) |>
  summarise(m = max(time)) |>
  pull(m)

tps00071 |>
  filter(time == latest_y) |>
  mutate(values = round(values, 1)) |>
  select(Geo, values) |>
  arrange(-values) |>
  rename(!!paste0("Hours worked per week (", latest_y, ")") := values) |>
  print_table_conditional()