Last observation: 2020 (N = 21)
First observation: 1948 (N = 21)
Last data update: 01 août 2026, 21:05
Last compile: 10 oct. 2026, 00:20
annual_tfp |>
  left_join(variable, by = "variable") |>
  group_by(variable, Variable) |>
  summarise(Nobs = n()) |>
print_table_conditional()| variable | Variable | Nobs |
|---|---|---|
| alpha | Capital's share of income | 73 |
| dLP | Business- sector labor productivity | 73 |
| dLQ | Labor composition/quality actually used | 73 |
| dLQ_Aaronson_Sullivan | NA | 73 |
| dLQ_BLS_interpolated | Labor composition/quality from BLS | 73 |
| dY | Output | 73 |
| dY_inc | Business output, measured from income side | 73 |
| dY_prod | Business output, expenditure (product) side | 73 |
| dhours | Hours, bus sector | 73 |
| dk | Capital input | 73 |
| dtfp | Business sector TFP | 73 |
| dtfp_C | TFP in non-equipment business output ("consumption") | 73 |
| dtfp_C_util | Utilization-adjusted TFP in producing non-equipment output | 73 |
| dtfp_I | TFP in equip and consumer durables | 73 |
| dtfp_I_util | Utilization-adjusted TFP in producing equipment and consumer durables | 73 |
| dtfp_util | Utilization-adjusted TFP | 73 |
| du_consumption | Utilization in producing non-investment business output ("consumption") | 73 |
| du_invest | Utilization in producing investment | 73 |
| dutil | Utilization of capital and labor | 73 |
| invShare | Equipment and consumer durables share of output | 73 |
| relativePrice | Relative price of "consumption" to price of "equipment" | 73 |
quarterly_tfp |>
  left_join(variable, by = "variable") |>
  group_by(variable, Variable) |>
  summarise(Nobs = n()) |>
print_table_conditional()| variable | Variable | Nobs |
|---|---|---|
| alpha | Capital's share of income | 297 |
| dLP | Business- sector labor productivity | 296 |
| dLQ | Labor composition/quality actually used | 296 |
| dLQ_Aaronson_Sullivan | NA | 168 |
| dLQ_BLS_interpolated | Labor composition/quality from BLS | 296 |
| dY | Output | 296 |
| dY_inc | Business output, measured from income side | 296 |
| dY_prod | Business output, expenditure (product) side | 296 |
| dhours | Hours, bus sector | 296 |
| dk | Capital input | 296 |
| dtfp | Business sector TFP | 296 |
| dtfp_C | TFP in non-equipment business output ("consumption") | 296 |
| dtfp_C_util | Utilization-adjusted TFP in producing non-equipment output | 296 |
| dtfp_I | TFP in equip and consumer durables | 296 |
| dtfp_I_util | Utilization-adjusted TFP in producing equipment and consumer durables | 296 |
| dtfp_util | Utilization-adjusted TFP | 296 |
| du_consumption | Utilization in producing non-investment business output ("consumption") | 296 |
| du_invest | Utilization in producing investment | 296 |
| dutil | Utilization of capital and labor | 296 |
| invShare | Equipment and consumer durables share of output | 297 |
| month | NA | 297 |
| relativePrice | Relative price of "consumption" to price of "equipment" | 296 |
quarterly_tfp |>
  filter(variable %in% c("dtfp", "dtfp_util")) |>
  left_join(variable, by = "variable") |>
  ggplot() + theme_minimal() + xlab("") + ylab("") +
  geom_line(aes(x = date, y = value, color = Variable)) +
  scale_x_date(breaks = seq(1920, 2100, 5) |> paste0("-01-01") |> as.Date(),
               labels = date_format("%Y")) +
  scale_y_continuous(breaks = c(seq(-200, 100, 2))) +
  theme(legend.position = c(0.25, 0.9),
        legend.title = element_blank()) +
  scale_color_manual(values = viridis(3)[1:2])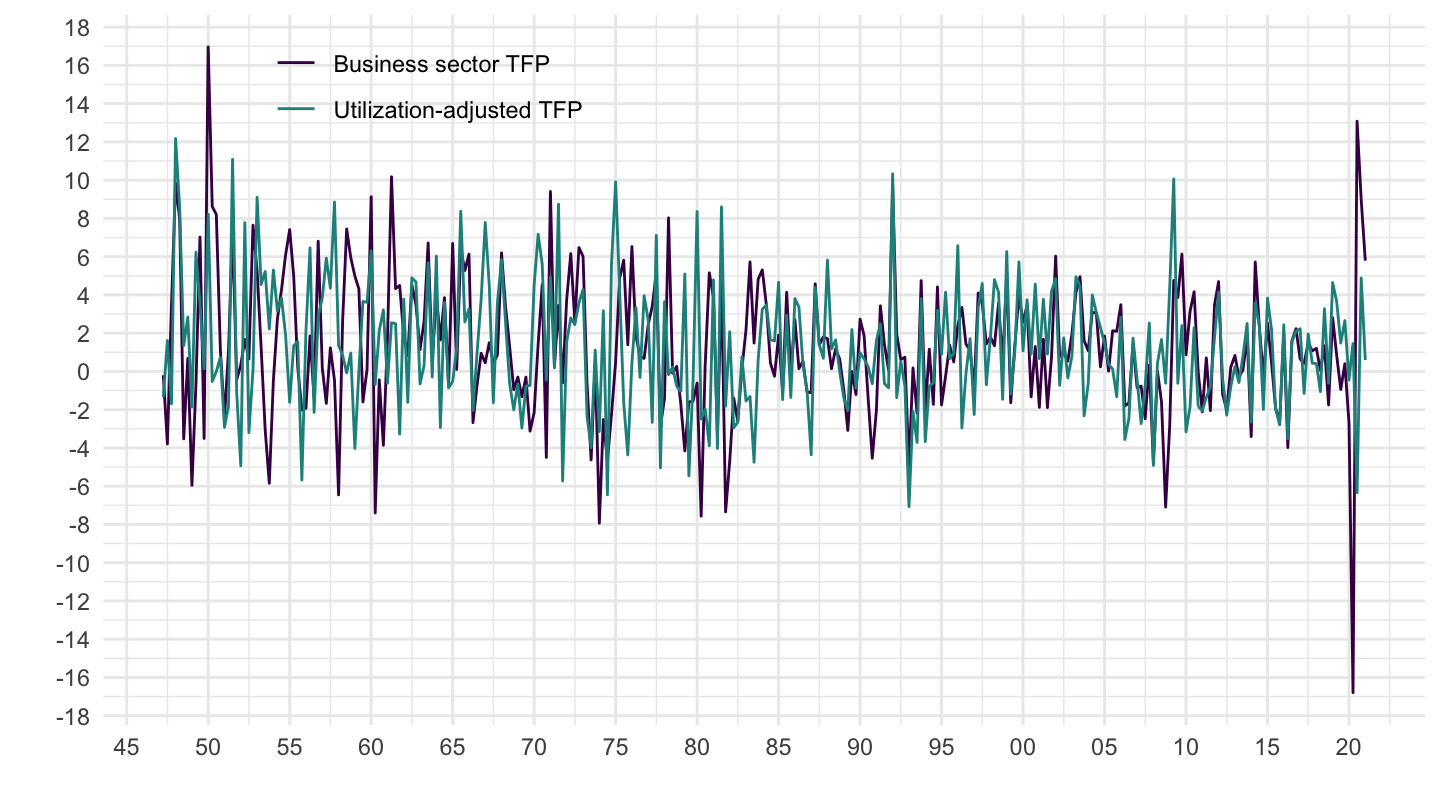
annual_tfp |>
  filter(variable %in% c("dtfp", "dtfp_util")) |>
  left_join(variable, by = "variable") |>
  ggplot() + theme_minimal() + xlab("") + ylab("TFP growth (%)") +
  geom_line(aes(x = date, y = value /100, color = Variable)) +
  scale_x_date(breaks = seq(1920, 2100, 5) |> paste0("-01-01") |> as.Date(),
               labels = date_format("%Y")) +
  scale_y_continuous(breaks = 0.01*c(seq(-200, 100, 1)),
                     labels = scales::percent_format(accuracy = 1)) +
  geom_rect(data = nber_recessions |>
              filter(Peak > as.Date("1945-01-01")),
            aes(xmin = Peak, xmax = Trough, ymin = -Inf, ymax = +Inf),
            fill = 'grey', alpha = 0.5) +
  theme(legend.position = c(0.8, 0.9),
        legend.title = element_blank()) +
  scale_color_manual(values = viridis(3)[1:2])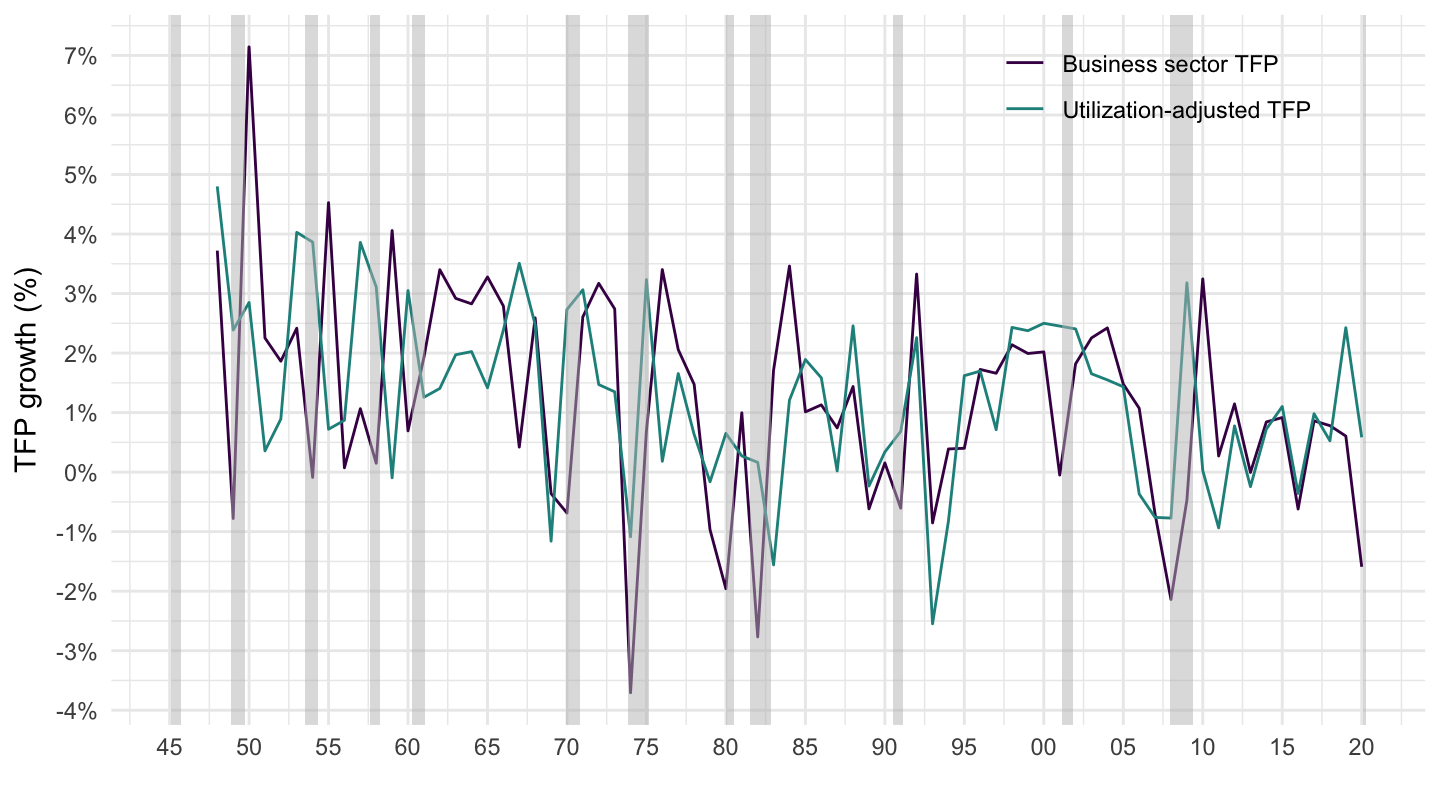
annual_tfp |>
  filter(variable %in% c("dtfp", "dtfp_util")) |>
  left_join(variable, by = "variable") |>
  group_by(variable) |>
  mutate(value = value/100,
         value_5Y = ((1+value)*(1+lag(value))*(1+lag(value, 2))*(1+lag(value, 3))*(1+lag(value, 4)))^(1/5)-1) |>
  na.omit() |>
  ggplot() + theme_minimal() + xlab("") + ylab("5-year previous TFP growth (%)") +
  geom_line(aes(x = date, y = value_5Y, color = Variable)) +
  scale_x_date(breaks = seq(1920, 2100, 5) |> paste0("-01-01") |> as.Date(),
               labels = date_format("%Y")) +
  scale_y_continuous(breaks = 0.01*c(seq(-200, 100, 0.5)),
                     labels = scales::percent_format(accuracy = .1)) +
  geom_rect(data = nber_recessions |>
              filter(Peak > as.Date("1950-01-01")),
            aes(xmin = Peak, xmax = Trough, ymin = -Inf, ymax = +Inf),
            fill = 'grey', alpha = 0.5) +
  theme(legend.position = c(0.8, 0.9),
        legend.title = element_blank()) +
  scale_color_manual(values = viridis(3)[1:2])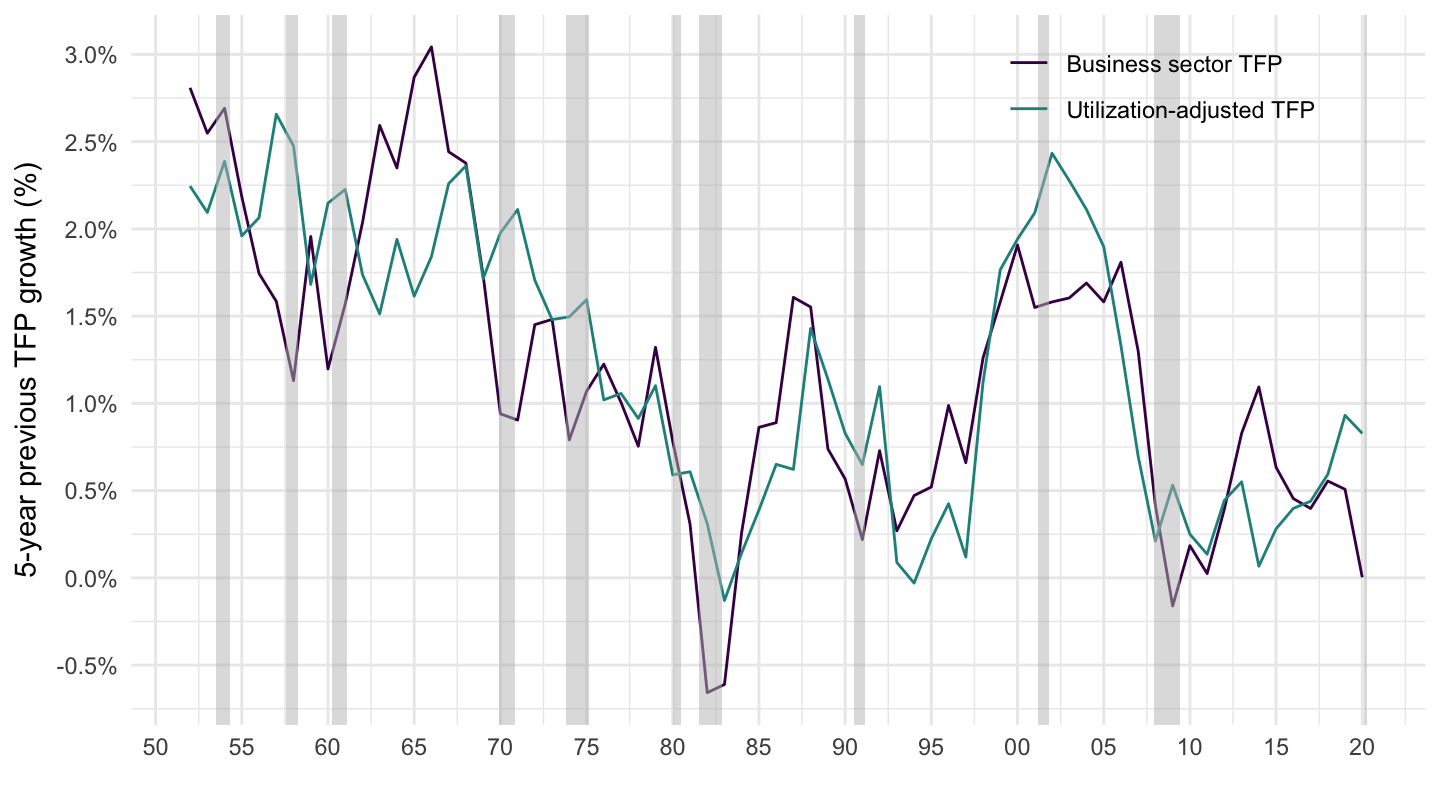
annual_tfp |>
  filter(variable %in% c("dtfp", "dtfp_util")) |>
  left_join(variable, by = "variable") |>
  group_by(variable) |>
  mutate(value = value/100,
         value_5Y = ((1+value)*(1+lag(value))*(1+lag(value, 2))*(1+lag(value, 3))*(1+lag(value, 4)))^(1/5)-1) |>
  na.omit() |>
  ggplot() + theme_minimal() + xlab("") + ylab("5-year previous TFP growth (%)") +
  geom_point(aes(x = date, y = value_5Y, color = Variable)) +
  scale_x_date(breaks = seq(1920, 2100, 5) |> paste0("-01-01") |> as.Date(),
               labels = date_format("%Y")) +
  scale_y_continuous(breaks = 0.01*c(seq(-200, 100, 0.5)),
                     labels = scales::percent_format(accuracy = .1)) +
  geom_rect(data = nber_recessions |>
              filter(Peak > as.Date("1950-01-01")),
            aes(xmin = Peak, xmax = Trough, ymin = -Inf, ymax = +Inf),
            fill = 'grey', alpha = 0.5) +
  theme(legend.position = c(0.8, 0.9),
        legend.title = element_blank()) +
  scale_color_manual(values = viridis(3)[1:2])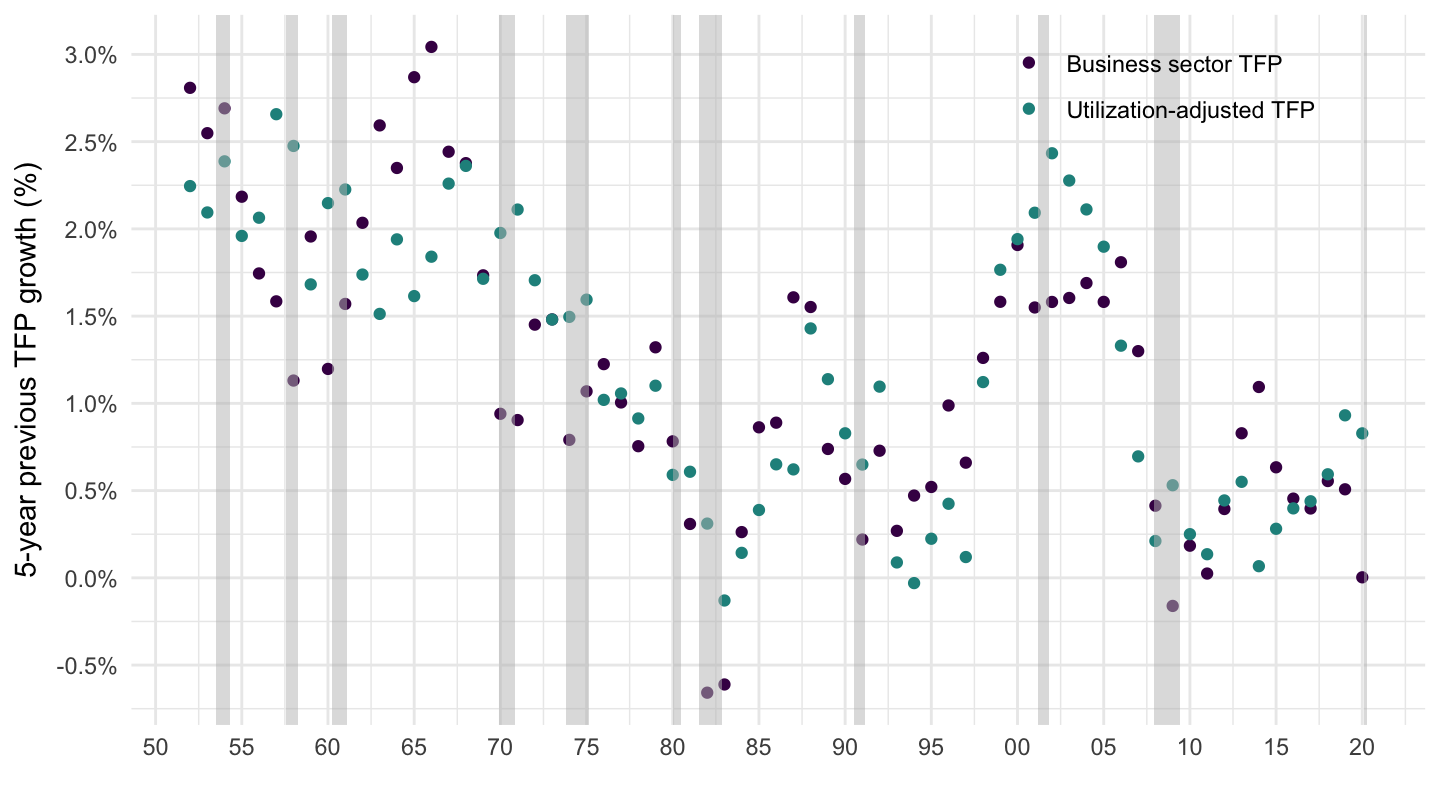
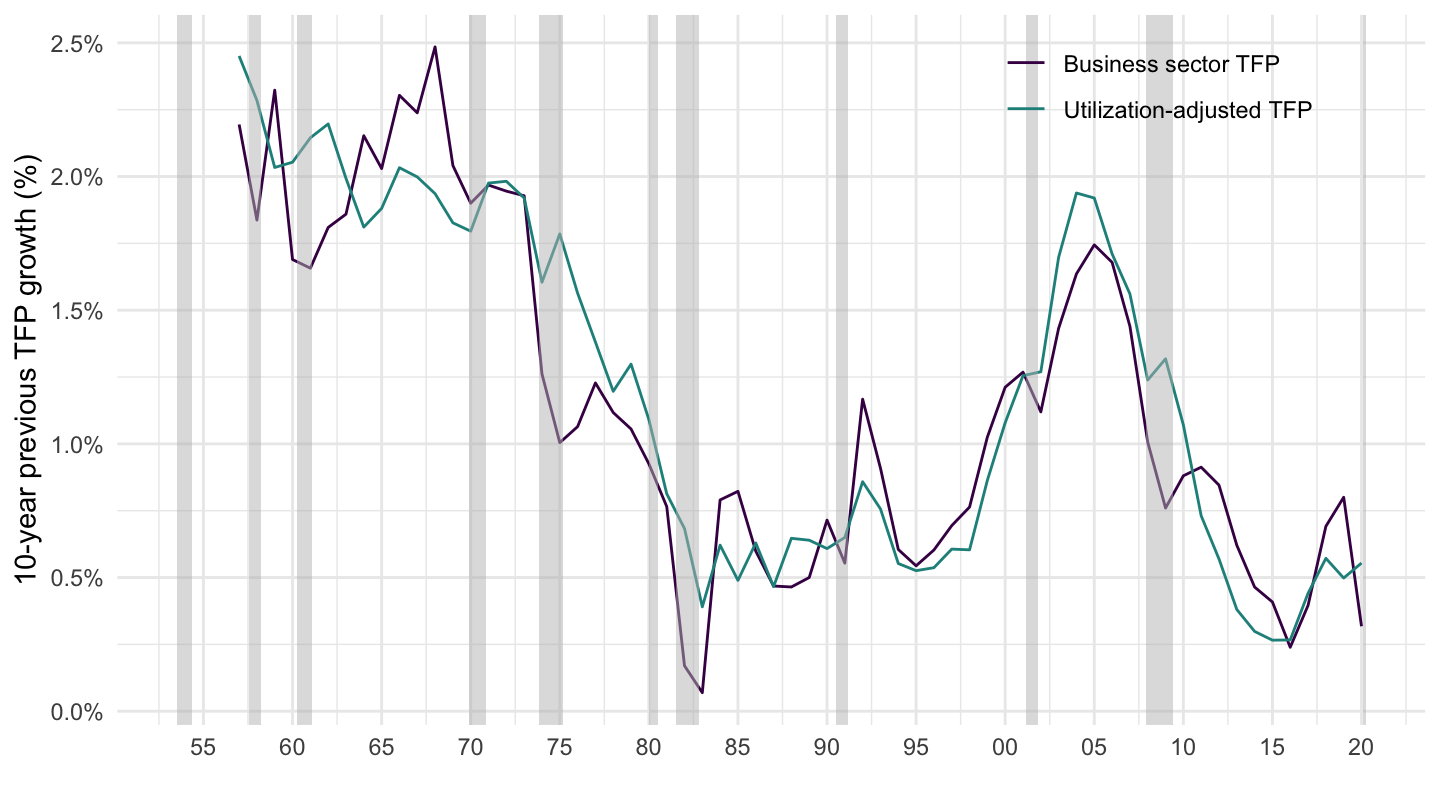
annual_tfp |>
  filter(variable %in% c("dtfp", "dtfp_util")) |>
  left_join(variable, by = "variable") |>
  group_by(variable) |>
  mutate(value = value/100,
         value_5Y = ((1+value)*(1+lag(value))*(1+lag(value, 2))*(1+lag(value, 3))*(1+lag(value, 4))*(1+lag(value, 5))*(1+lag(value, 6))*(1+lag(value, 7))*(1+lag(value, 8))*(1+lag(value, 9)))^(1/10)-1) |>
  na.omit() |>
  ggplot() + theme_minimal() + xlab("") + ylab("10-year previous TFP growth (%)") +
  geom_line(aes(x = date, y = value_5Y, color = Variable)) +
  scale_x_date(breaks = seq(1920, 2100, 5) |> paste0("-01-01") |> as.Date(),
               labels = date_format("%Y")) +
  scale_y_continuous(breaks = 0.01*c(seq(-200, 100, 0.5)),
                     labels = scales::percent_format(accuracy = .1)) +
  geom_rect(data = nber_recessions |>
              filter(Peak > as.Date("1950-01-01")),
            aes(xmin = Peak, xmax = Trough, ymin = -Inf, ymax = +Inf),
            fill = 'grey', alpha = 0.5) +
  theme(legend.position = c(0.8, 0.9),
        legend.title = element_blank()) +
  scale_color_manual(values = viridis(3)[1:2])