Error in readChar(con, 5L, useBytes = TRUE) : cannot open the connection
Error in readChar(con, 5L, useBytes = TRUE) : cannot open the connection
Error in readChar(con, 5L, useBytes = TRUE) : cannot open the connection
Error in readChar(con, 5L, useBytes = TRUE) : cannot open the connection
Error in readChar(con, 5L, useBytes = TRUE) : cannot open the connection
Error in readChar(con, 5L, useBytes = TRUE) : cannot open the connection
Error in readChar(con, 5L, useBytes = TRUE) : cannot open the connection
Error in readChar(con, 5L, useBytes = TRUE) : cannot open the connection
Error in readChar(con, 5L, useBytes = TRUE) : cannot open the connection
Info
Last
Code
QSA %>%
  group_by(TIME_PERIOD) %>%
  summarise(Nobs = n()) %>%
  arrange(desc(TIME_PERIOD)) %>%
  head(1) %>%
  print_table_conditional()
Other info
- Households and non-financial corporations in the euro area: first quarter of 2023. html
ADJUSTMENT
Code
QSA %>%
  left_join(ADJUSTMENT,  by = "ADJUSTMENT") %>%
  group_by(ADJUSTMENT, Adjustment) %>%
  summarise(Nobs = n()) %>%
  arrange(-Nobs) %>%
  {if (is_html_output()) print_table(.) else .}
| N |
Neither seasonally nor working day adjusted |
26273505 |
| Y |
Working day and seasonally adjusted |
136388 |
COUNTERPART_AREA
Code
QSA %>%
  left_join(COUNTERPART_AREA,  by = "COUNTERPART_AREA") %>%
  group_by(COUNTERPART_AREA, Counterpart_area) %>%
  summarise(Nobs = n()) %>%
  arrange(-Nobs) %>%
  {if (is_html_output()) print_table(.) else .}
| W0 |
Intra-EU (changing composition) not allocated |
12986512 |
| W2 |
Intra-Euro area not allocated |
11229410 |
| W1 |
Gaza and Jericho |
2181428 |
| 4Y |
All European Community Institutions, Organs and Organisms, including ECB, ESM and EFSF |
5407 |
| B0 |
Emerging and developing economies |
2154 |
| D0 |
EU (changing composition) |
2154 |
| U2 |
Euro area (changing composition) |
1414 |
| U4 |
Extra Euro area |
1414 |
COUNTERPART_SECTOR
Code
QSA %>%
  left_join(COUNTERPART_SECTOR,  by = "COUNTERPART_SECTOR") %>%
  group_by(COUNTERPART_SECTOR, Counterpart_sector) %>%
  summarise(Nobs = n()) %>%
  arrange(-Nobs) %>%
  {if (is_html_output()) print_table(.) else .}
| S1 |
Total economy |
16022913 |
| S12 |
Financial corporations |
831202 |
| S12P |
Other financial institutions (Financial corporations other than MFIs, insurance corporations and pension funds) |
821483 |
| S124 |
Non MMF investment funds |
815257 |
| S12K |
Monetary financial institutions (MFI) |
800848 |
| S11 |
Non financial corporations |
743746 |
| S12O |
Other financial institutions (Financial corporations other than MFIs, insurance corporations, pension funds and non MMFs investment funds) |
741421 |
| S128 |
Insurance corporations |
735106 |
| S13 |
General government |
734697 |
| S12Q |
Insurance corporations and Pension Funds |
730079 |
| S129 |
Pension funds |
729030 |
| S1M |
Households and non profit institutions serving households (NPISH) |
649850 |
| S126 |
Financial auxiliaries |
578483 |
| S125 |
Other financial intermediaries, except insurance corporations and pension funds |
578340 |
| S127 |
Captive financial institutions and money lenders |
577935 |
| S121 |
Central bank |
158130 |
| S12T |
Monetary financial institutions other than central bank |
156390 |
| S1V |
Non-financial corporations, households and NPISH |
4983 |
EXPENDITURE
Code
QSA %>%
  left_join(EXPENDITURE,  by = "EXPENDITURE") %>%
  group_by(EXPENDITURE, Expenditure) %>%
  summarise(Nobs = n()) %>%
  arrange(-Nobs) %>%
  {if (is_html_output()) print_table(.) else .}
| _Z |
Not applicable |
26282097 |
| _T |
Total |
127796 |
FREQ
Code
QSA %>%
  left_join(FREQ,  by = "FREQ") %>%
  group_by(FREQ, Freq) %>%
  summarise(Nobs = n()) %>%
  arrange(-Nobs) %>%
  {if (is_html_output()) print_table(.) else .}
| Q |
Quarterly |
26355182 |
| A |
Annual |
54711 |
INSTR_ASSET
Code
QSA %>%
  left_join(INSTR_ASSET,  by = "INSTR_ASSET") %>%
  group_by(INSTR_ASSET, Instr_asset) %>%
  summarise(Nobs = n()) %>%
  arrange(-Nobs) %>%
  {if (is_html_output()) print_table(.) else .}
| F4 |
NA |
6312614 |
| F3 |
Debt securities |
6032437 |
| F511 |
Listed shares |
1861477 |
| _Z |
NA |
1406125 |
| F2M |
Deposits |
851307 |
| F52 |
Investment fund shares/units |
785462 |
| F |
NA |
748149 |
| F81 |
NA |
568745 |
| F89 |
NA |
567887 |
| F51M |
Unlisted shares and other equity |
560092 |
| F6 |
NA |
372731 |
| F8 |
NA |
371890 |
| F7 |
NA |
370166 |
| F5 |
NA |
369835 |
| F51 |
NA |
364086 |
| F6M |
NA |
349040 |
| F519 |
NA |
345017 |
| F6N |
NA |
341874 |
| F512 |
NA |
326953 |
| F6O |
NA |
323920 |
| F6P |
NA |
308858 |
| F2 |
NA |
261670 |
| F21 |
NA |
242831 |
| F522 |
NA |
231557 |
| F62 |
Life insurance and annuity entitlements |
229691 |
| F29 |
NA |
226969 |
| F22 |
NA |
226574 |
| F521 |
NA |
223453 |
| F62B |
NA |
183853 |
| F63 |
NA |
165985 |
| F62A |
NA |
155707 |
| F63B |
NA |
146149 |
| F63A |
NA |
144816 |
| F1 |
NA |
118437 |
| F12 |
NA |
118120 |
| F11 |
NA |
117073 |
| F3T4 |
NA |
25220 |
| FPT |
NA |
14981 |
| FP |
NA |
13144 |
| FR0 |
NA |
5389 |
| NUN |
Housing wealth (net) |
3868 |
| FX4 |
NA |
3276 |
| NYN |
NA |
2433 |
| N11G |
NA |
2220 |
| N11N |
NA |
2220 |
| N111G |
NA |
888 |
| N111N |
NA |
888 |
| N112G |
NA |
444 |
| N112N |
NA |
444 |
| N11LG |
NA |
444 |
| N11LN |
NA |
444 |
| N11MG |
NA |
444 |
| N11MN |
NA |
444 |
| N21111 |
NA |
444 |
| F2B |
NA |
118 |
| F2MF |
NA |
118 |
| F3F |
NA |
118 |
| F3M |
NA |
118 |
| FF |
NA |
118 |
| FM |
NA |
118 |
PRICES
Code
QSA %>%
  left_join(PRICES,  by = "PRICES") %>%
  group_by(PRICES, Prices) %>%
  summarise(Nobs = n()) %>%
  arrange(-Nobs) %>%
  {if (is_html_output()) print_table(.) else .}
| V |
Current prices |
26366234 |
| L |
Chain linked volume |
18416 |
| _Z |
Not applicable |
14879 |
| D |
Deflator (index) |
7984 |
| LR |
Chain linked volume (rebased) |
1190 |
| Y |
Previous year prices |
1190 |
REF_AREA
Code
QSA %>%
  left_join(REF_AREA,  by = "REF_AREA") %>%
  group_by(REF_AREA, Ref_area) %>%
  summarise(Nobs = n()) %>%
  arrange(-Nobs) %>%
  {if (is_html_output()) datatable(., filter = 'top', rownames = F) else .}
REF_SECTOR
Code
QSA %>%
  left_join(REF_SECTOR,  by = "REF_SECTOR") %>%
  group_by(REF_SECTOR, Ref_sector) %>%
  summarise(Nobs = n()) %>%
  arrange(-Nobs) %>%
  {if (is_html_output()) datatable(., filter = 'top', rownames = F) else .}
STO
Code
QSA %>%
  left_join(STO,  by = "STO") %>%
  group_by(STO, Sto) %>%
  summarise(Nobs = n()) %>%
  arrange(-Nobs) %>%
  {if (is_html_output()) datatable(., filter = 'top', rownames = F) else .}
Loans granted to households as % of GDP
QSA.Q.N.BG.W0.S1M.S1.N.L.LE.F4.T._Z.XDC_R_B1GQ_CY._T.S.V.N._T QSA.Q.N.SE.W0.S1V.S1.N.L.F.F3T4.T._Z.XDC_R_B1GQ_CY._T.S.V.CY._T
Loans granted to households as a ratio of GDP
Loans granted to households as a ratio of GDP: QSA.Q.N.I9.W0.S1M.S1.N.L.LE.F4.T._Z.XDC_R_B1GQ_CY._T.S.V.N._T
Loans granted to households as a % of GDI
Loans granted to households as a ratio of gross disposable income
QSA.Q.N.AT.W0.S1M.S1.N.L.LE.F4.T._Z.XDC_R_B6G_CY._T.S.V.N._T
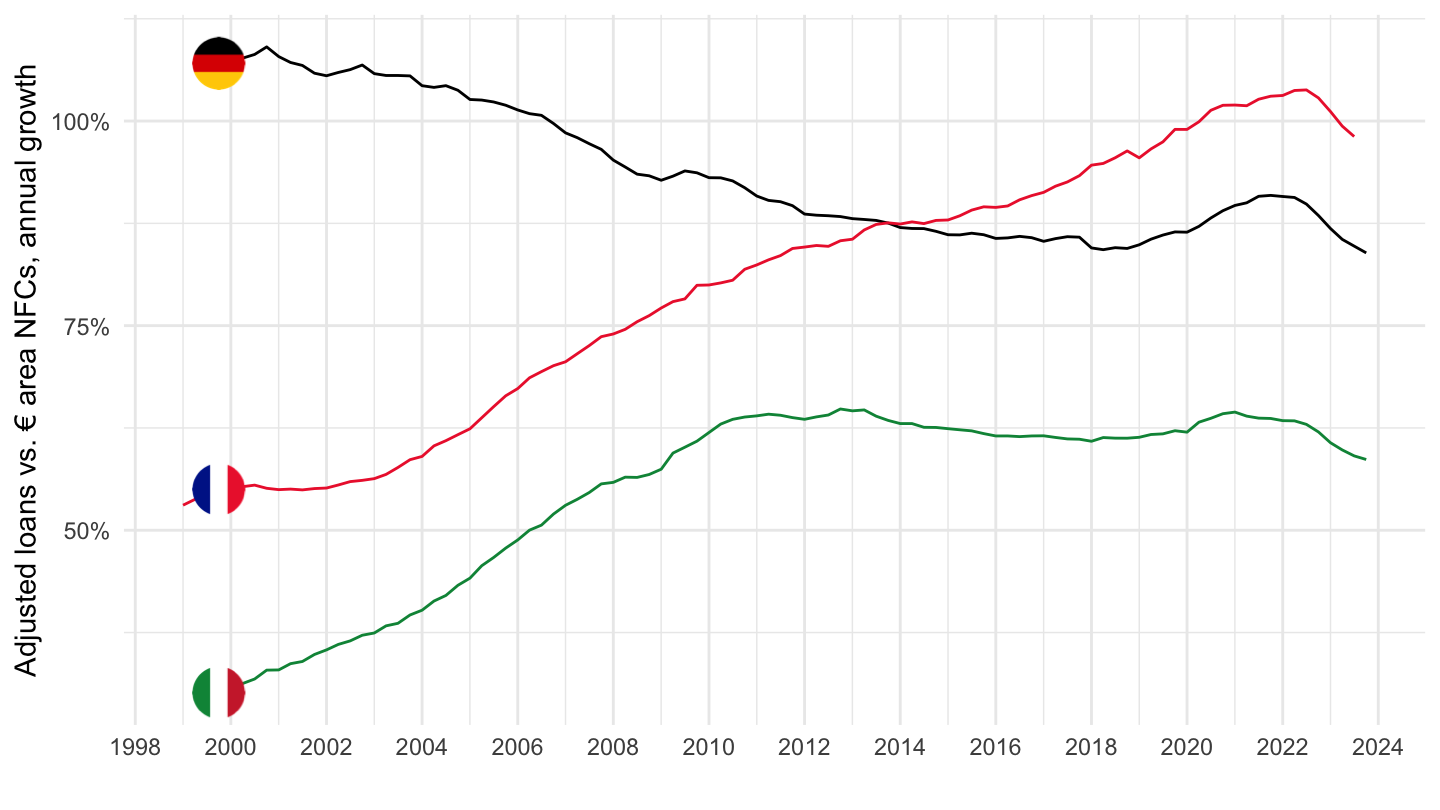
Adjusted loans
Euro area Non Financial corporations (NFCs)
Code
QSA %>%
  filter(KEY %in% c("QSA.Q.N.FR.W0.S1M.S1.N.L.LE.F4.T._Z.XDC_R_B6G_CY._T.S.V.N._T",
                    "QSA.Q.N.DE.W0.S1M.S1.N.L.LE.F4.T._Z.XDC_R_B6G_CY._T.S.V.N._T",
                    "QSA.Q.N.IT.W0.S1M.S1.N.L.LE.F4.T._Z.XDC_R_B6G_CY._T.S.V.N._T")) %>%
  quarter_to_date %>%
  left_join(REF_AREA, by = "REF_AREA") %>%
  mutate(OBS_VALUE = OBS_VALUE/100) %>%
  left_join(colors, by = c("Ref_area" = "country")) %>%
  ggplot + geom_line(aes(x = date, y = OBS_VALUE, color = color)) +
  ylab("Adjusted loans vs. € area NFCs, annual growth") + xlab("") + theme_minimal() +
  add_flags(3) + scale_color_identity() +
  theme(legend.position = c(0.45, 0.9),
        legend.title = element_blank()) +
  scale_y_continuous(breaks = 0.01*seq(-100, 300, 25),
                     labels = scales::percent_format(accuracy = 1)) +
  scale_x_date(breaks = as.Date(paste0(seq(1940, 2100, 2), "-01-01")),
               labels = date_format("%Y"))
QSA.Q.N.I9.W0.S1M.S1.N.L.LE.F4.T._Z.XDC_R_B6GA_CY._T.S.V.N._T
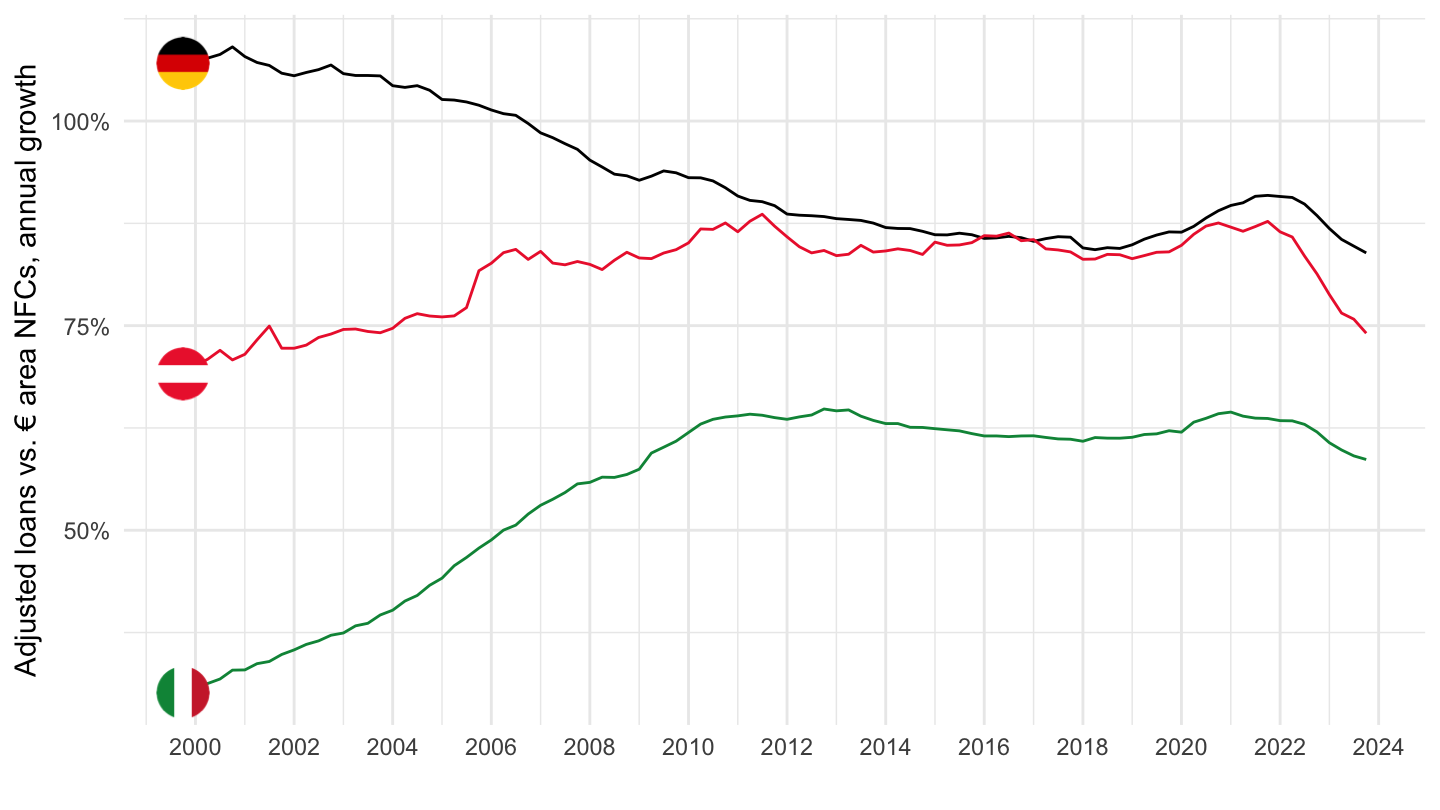
Households
Code
QSA %>%
  filter(KEY %in% c("QSA.Q.N.AT.W0.S1M.S1.N.L.LE.F4.T._Z.XDC_R_B6G_CY._T.S.V.N._T",
                    "QSA.Q.N.DE.W0.S1M.S1.N.L.LE.F4.T._Z.XDC_R_B6G_CY._T.S.V.N._T",
                    "QSA.Q.N.IT.W0.S1M.S1.N.L.LE.F4.T._Z.XDC_R_B6G_CY._T.S.V.N._T")) %>%
  quarter_to_date %>%
  left_join(REF_AREA, by = "REF_AREA") %>%
  mutate(OBS_VALUE = OBS_VALUE/100) %>%
  left_join(colors, by = c("Ref_area" = "country")) %>%
  ggplot + geom_line(aes(x = date, y = OBS_VALUE, color = color)) +
  ylab("Adjusted loans vs. € area NFCs, annual growth") + xlab("") + theme_minimal() +
  add_flags(3) + scale_color_identity() +
  theme(legend.position = c(0.45, 0.9),
        legend.title = element_blank()) +
  scale_y_continuous(breaks = 0.01*seq(-100, 300, 25),
                     labels = scales::percent_format(accuracy = 1)) +
  scale_x_date(breaks = as.Date(paste0(seq(1940, 2100, 2), "-01-01")),
               labels = date_format("%Y"))
Total financial liabilities of Non financial corporations
Non-financial corporations’ financing increased at lower annual rate of 1.5%, after 2.0%
QSA.Q.N.I9.W0.S11.S1.N.L.F.F._Z._Z.XDC._T.S.V.N._T