Last observation: 2024 (N = 10)
First observation: 2000 (N = 10)
Last data update: 19 oct. 2026, 23:28
Last compile: 19 oct. 2026, 23:28
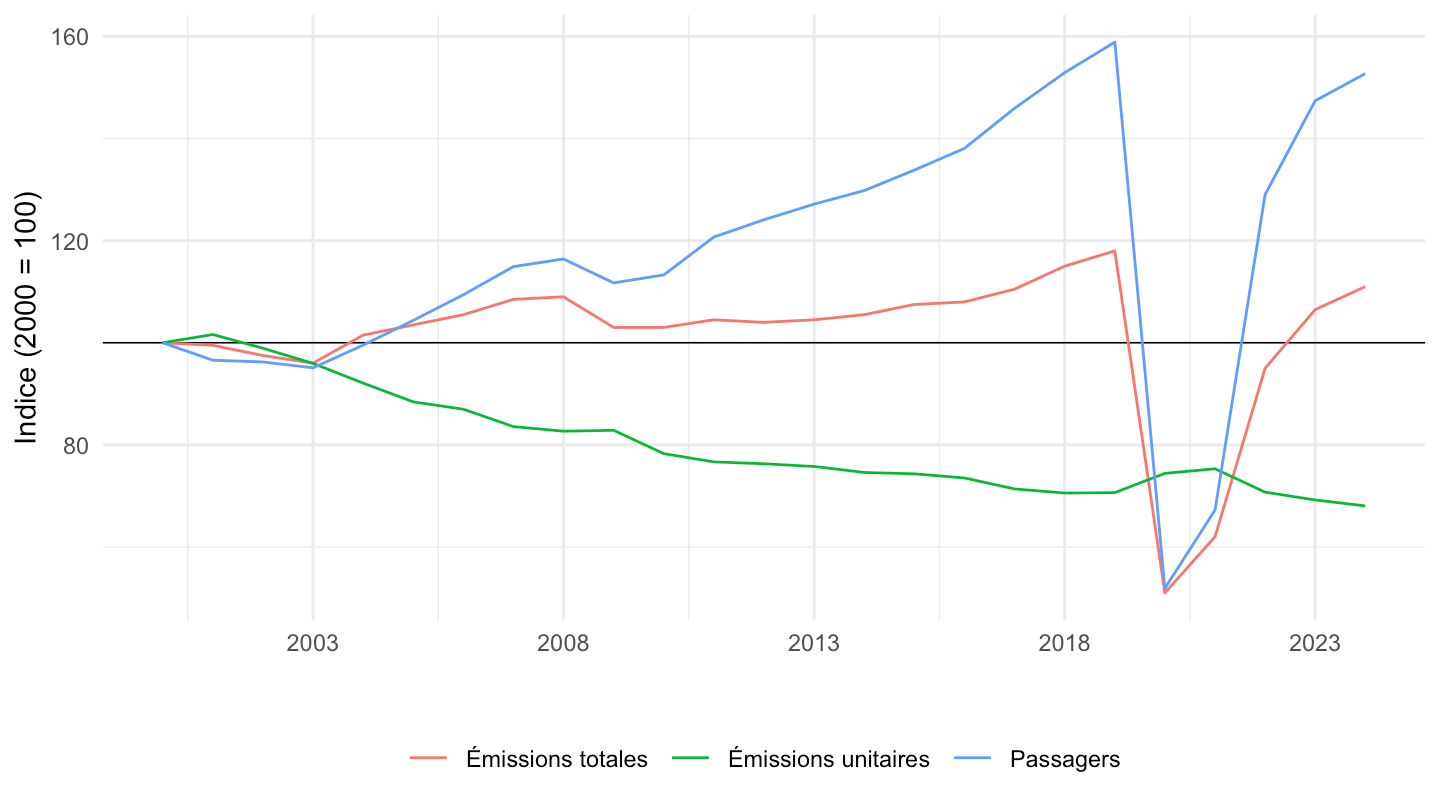
Source : DGAC, data.gouv.fr. Émissions nettes annuelles (carburant d’aviation durable inclus) depuis 2000, en millions de tonnes de CO2 et en grammes de CO2 par passager équivalent kilomètre transporté.
`emissions-nettes-de-co2-du-trafic-aerien` |>
  filter(indicateur == "Émissions totales", faisceau != "FRANCE_TOT") |>
  ggplot(aes(x = date, y = value, fill = faisceau_label)) +
  geom_area() + theme_minimal() + xlab("") + ylab("Millions de tonnes de CO2") +
  scale_fill_viridis_d(end = 0.9) +
  scale_x_date(date_breaks = "5 years", labels = date_format("%Y")) +
  theme(legend.position = "bottom", legend.title = element_blank()) +
  guides(fill = guide_legend(ncol = 1))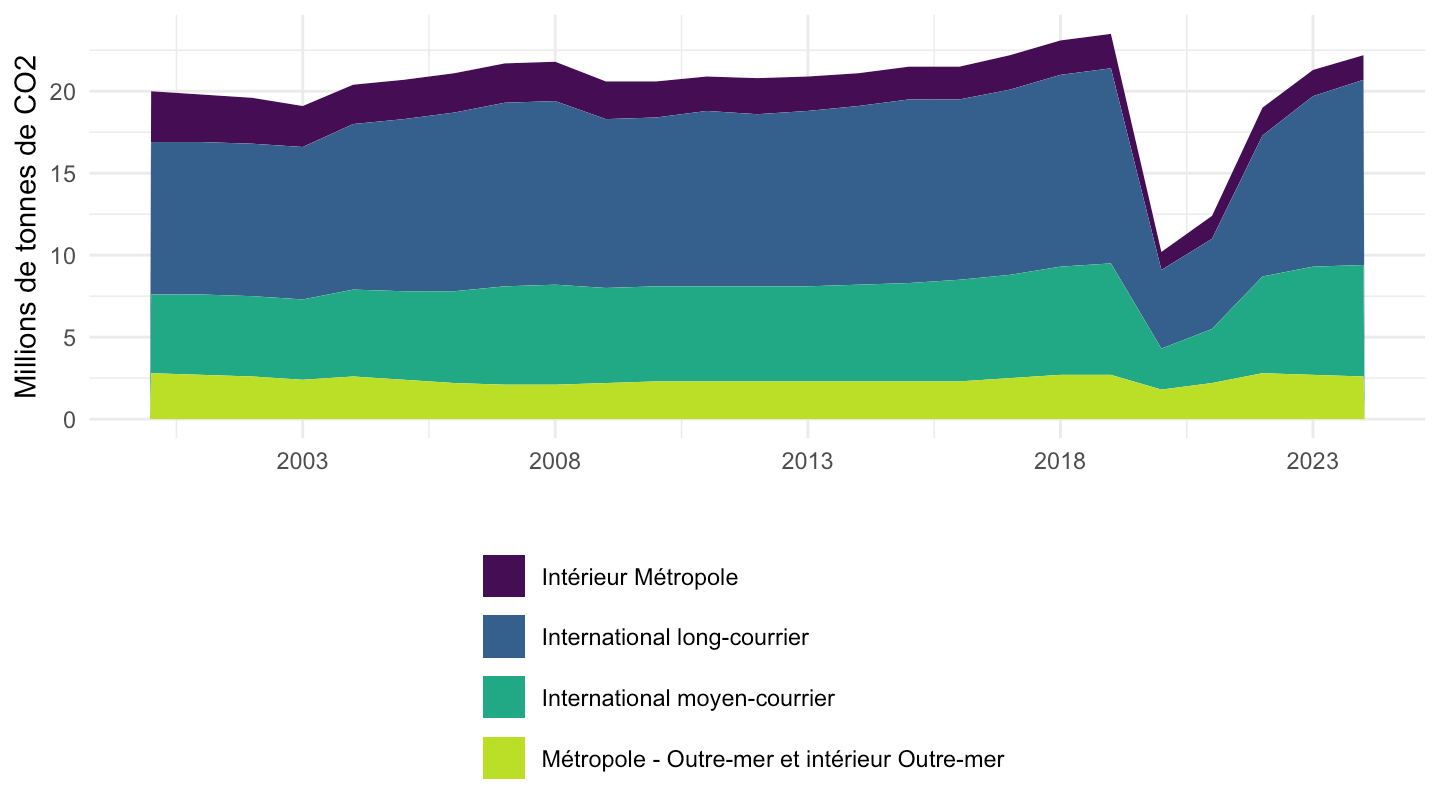
`emissions-nettes-de-co2-du-trafic-aerien` |>
  filter(indicateur == "Émissions totales", faisceau != "FRANCE_TOT", annee == 2024) |>
  mutate(faisceau_label = fct_reorder(faisceau_label, value)) |>
  ggplot(aes(x = faisceau_label, y = value)) +
  geom_col(fill = "#08519c") + coord_flip() + theme_minimal() +
  xlab("") + ylab("Millions de tonnes de CO2")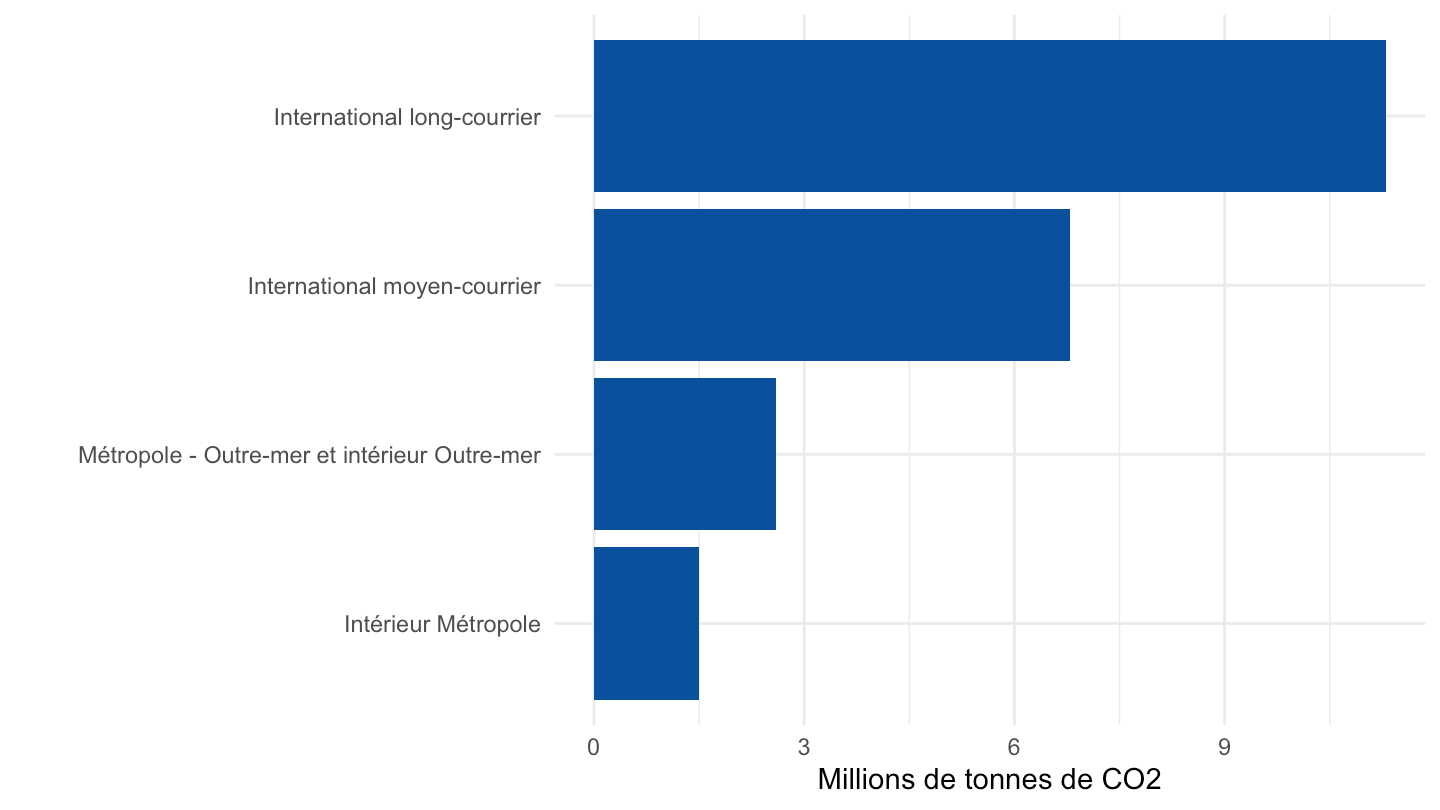
`emissions-nettes-de-co2-du-trafic-aerien` |>
  filter(indicateur == "Émissions unitaires") |>
  ggplot(aes(x = date, y = value, color = faisceau_label)) +
  geom_line() + theme_minimal() + xlab("") + ylab("g de CO2 par passager équivalent km") +
  scale_x_date(date_breaks = "5 years", labels = date_format("%Y")) +
  theme(legend.position = "bottom", legend.title = element_blank()) +
  guides(color = guide_legend(ncol = 1))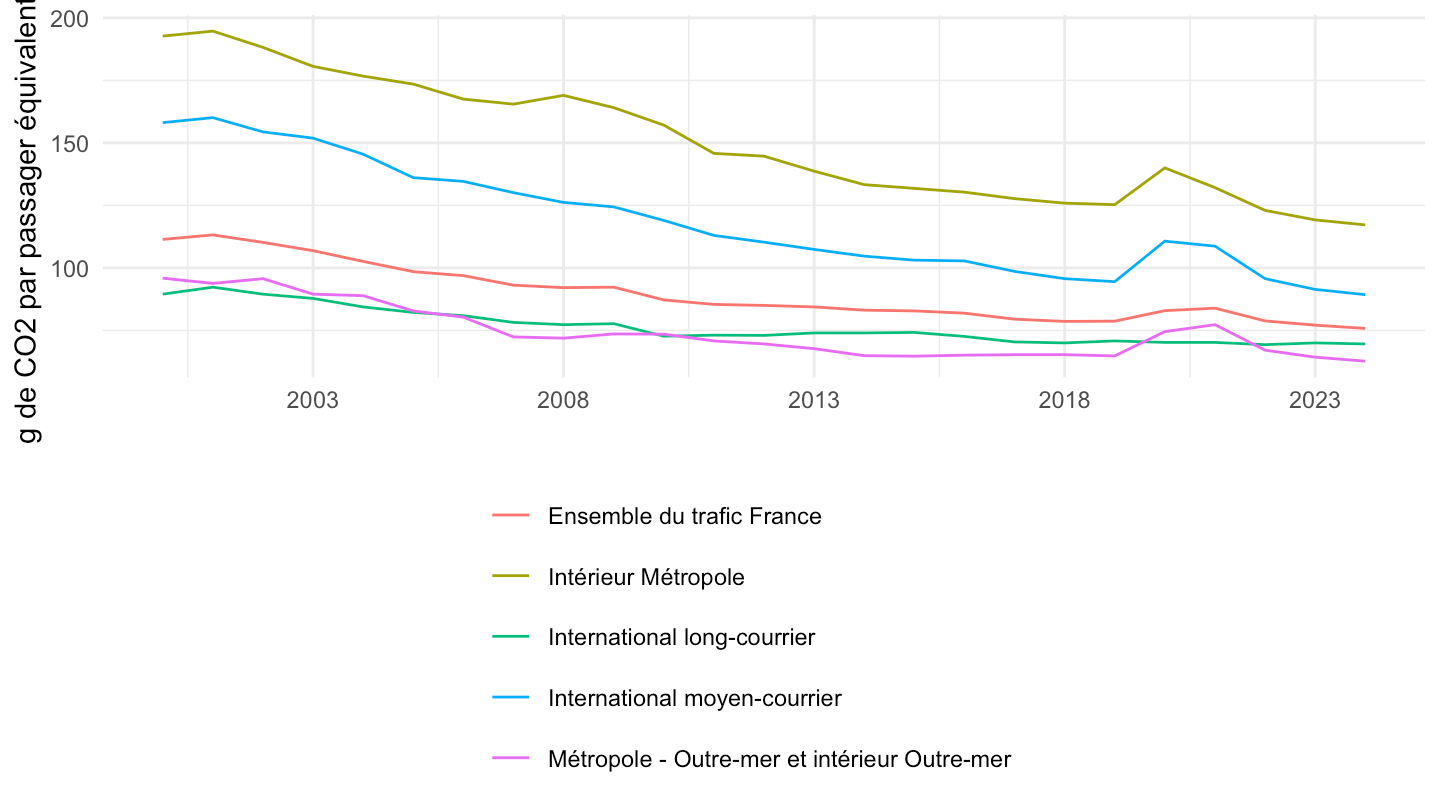
Passagers : départs + arrivées dans les aéroports français (trafic-aerien-aeroports).
pax <- read_parquet("trafic-aerien-aeroports.parquet") |>
  mutate(annee = year(date)) |>
  group_by(annee) |>
  summarise(Passagers = sum(APT_PAX_dep + APT_PAX_arr, na.rm = TRUE))
`emissions-nettes-de-co2-du-trafic-aerien` |>
  filter(faisceau == "FRANCE_TOT") |>
  select(annee, indicateur, value) |>
  pivot_wider(names_from = indicateur, values_from = value) |>
  inner_join(pax, by = "annee") |>
  pivot_longer(-annee) |>
  group_by(name) |>
  mutate(indice = 100 * value / value[annee == 2000], date = as.Date(paste0(annee, "-01-01"))) |>
  ggplot(aes(x = date, y = indice, color = name)) +
  geom_hline(yintercept = 100, linewidth = 0.3) +
  geom_line() + theme_minimal() + xlab("") + ylab("Indice (2000 = 100)") +
  scale_x_date(date_breaks = "5 years", labels = date_format("%Y")) +
  theme(legend.position = "bottom", legend.title = element_blank())