Last data update: 19 oct. 2026, 23:28
Last compile: 19 oct. 2026, 23:28
Source : DGAC, data.gouv.fr. Passagers au départ (APT_PAX_dep) et à l’arrivée (APT_PAX_arr) ; le total de passagers d’un aéroport est leur somme (les passagers en transit, APT_PAX_tr, sont comptés à part). Les aérodromes sous le seuil de 1 000 passagers par mois sont agrégés en deux lignes (Métropole, Outre-mer).
`trafic-aerien-aeroports` |>
  mutate(annee = year(date)) |>
  group_by(annee) |>
  summarise(pax = sum(APT_PAX_dep + APT_PAX_arr, na.rm = TRUE) / 1e6) |>
  mutate(date = as.Date(paste0(annee, "-01-01"))) |>
  ggplot(aes(x = date, y = pax)) +
  geom_line() + geom_point(size = 0.8) +
  theme_minimal() + xlab("") + ylab("Millions de passagers") +
  scale_x_date(date_breaks = "5 years", labels = date_format("%Y")) +
  scale_y_continuous(labels = fr)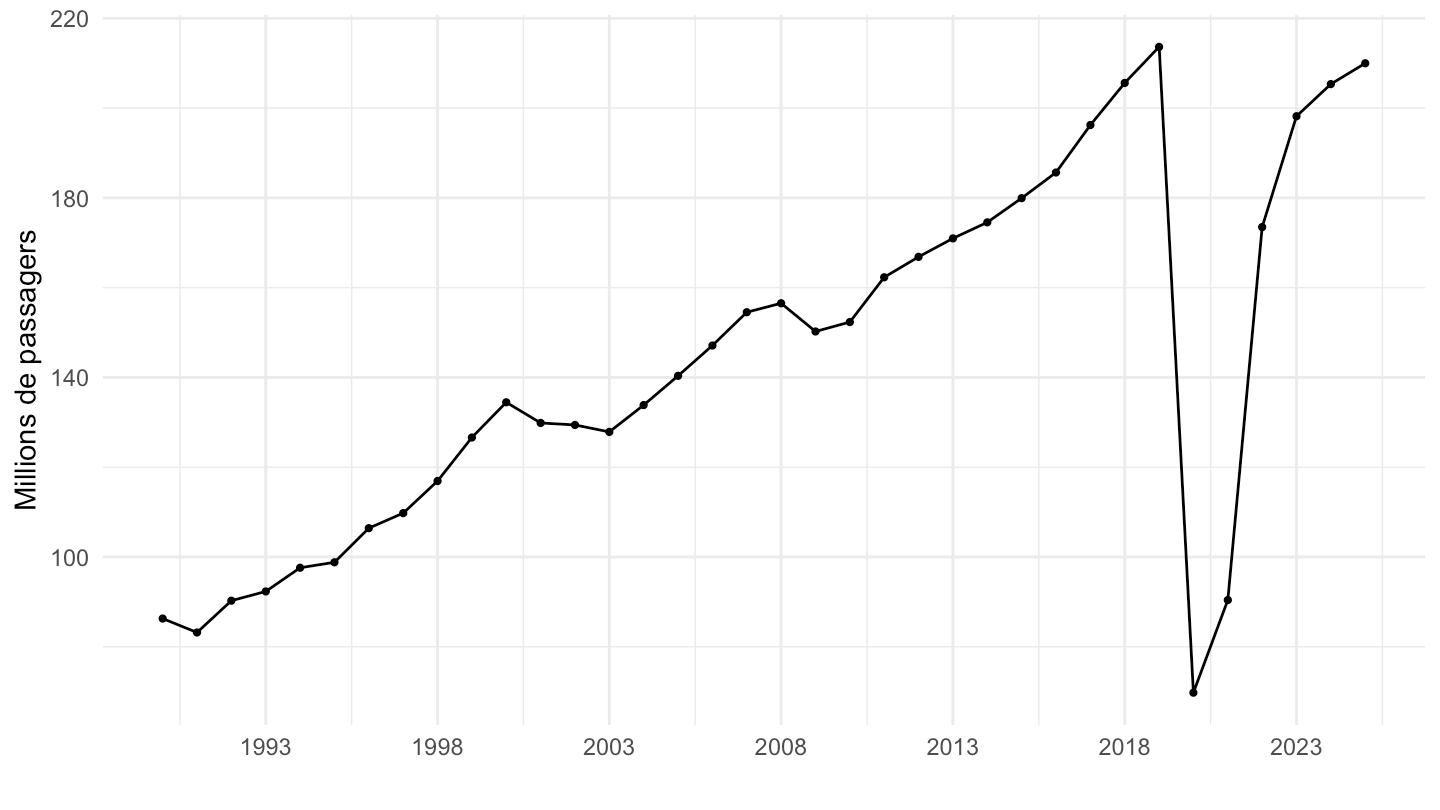
`trafic-aerien-aeroports` |>
  group_by(date) |>
  summarise(pax = sum(APT_PAX_dep + APT_PAX_arr, na.rm = TRUE) / 1e6) |>
  arrange(date) |>
  mutate(`Moyenne sur 12 mois` = zoo::rollmean(pax, 12, fill = NA, align = "right")) |>
  rename(`Mensuel` = pax) |>
  pivot_longer(-date) |>
  filter(date >= "2015-01-01") |>
  ggplot(aes(x = date, y = value, color = name, linewidth = name)) +
  geom_line() + theme_minimal() + xlab("") + ylab("Millions de passagers") +
  scale_color_manual(values = c("grey60", "#b2182b")) +
  scale_linewidth_manual(values = c(0.4, 1)) +
  scale_x_date(date_breaks = "1 year", labels = date_format("%Y")) +
  theme(legend.position = "bottom", legend.title = element_blank())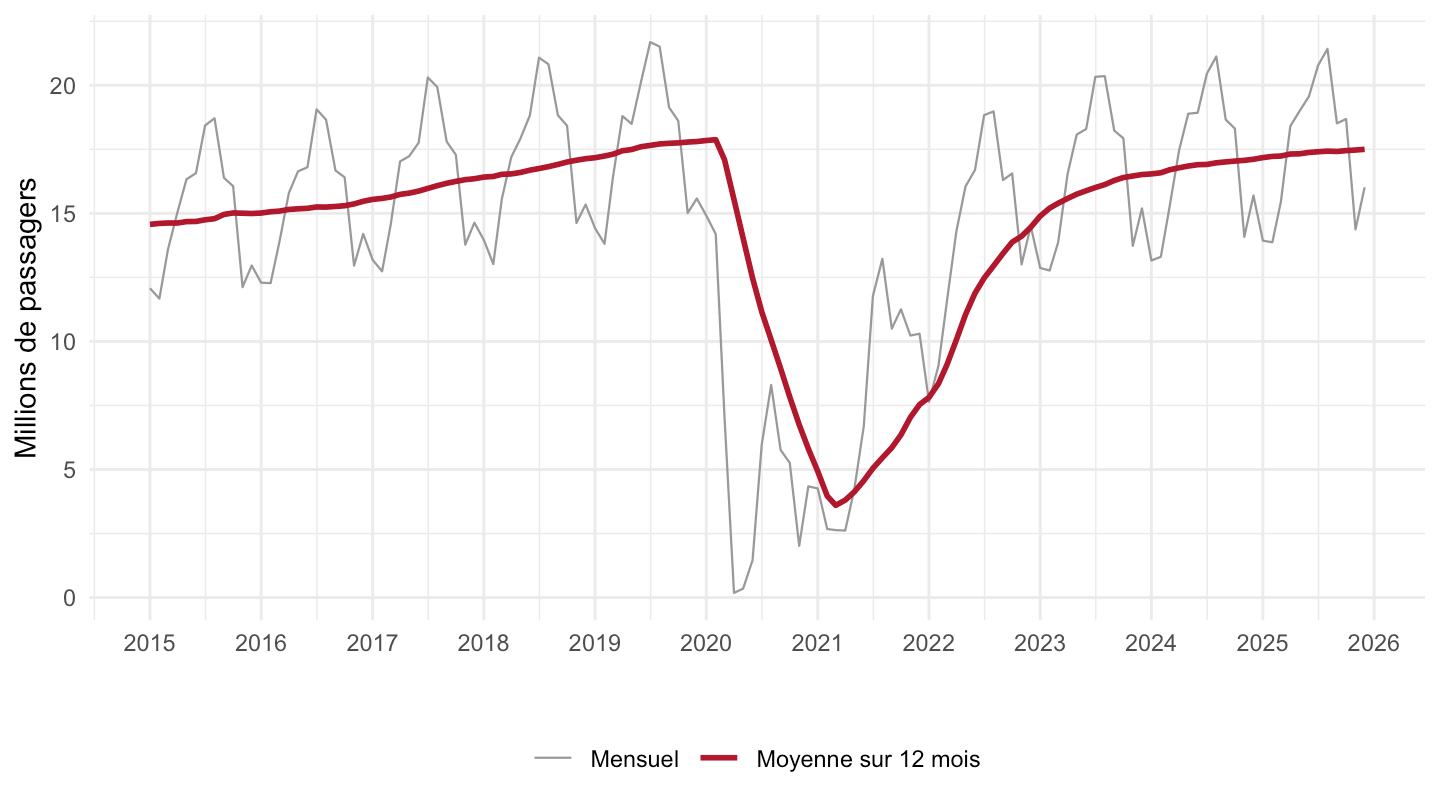
`trafic-aerien-aeroports` |>
  filter(year(date) %in% c(2019, 2023, 2025)) |>
  group_by(date) |>
  summarise(pax = sum(APT_PAX_dep + APT_PAX_arr, na.rm = TRUE) / 1e6) |>
  mutate(annee = factor(year(date)), mois = month(date)) |>
  ggplot(aes(x = mois, y = pax, color = annee)) +
  geom_line() + geom_point(size = 0.8) + theme_minimal() +
  xlab("") + ylab("Millions de passagers") +
  scale_x_continuous(breaks = 1:12, labels = month.abb) +
  scale_color_viridis_d(end = 0.8) +
  theme(legend.position = "bottom", legend.title = element_blank())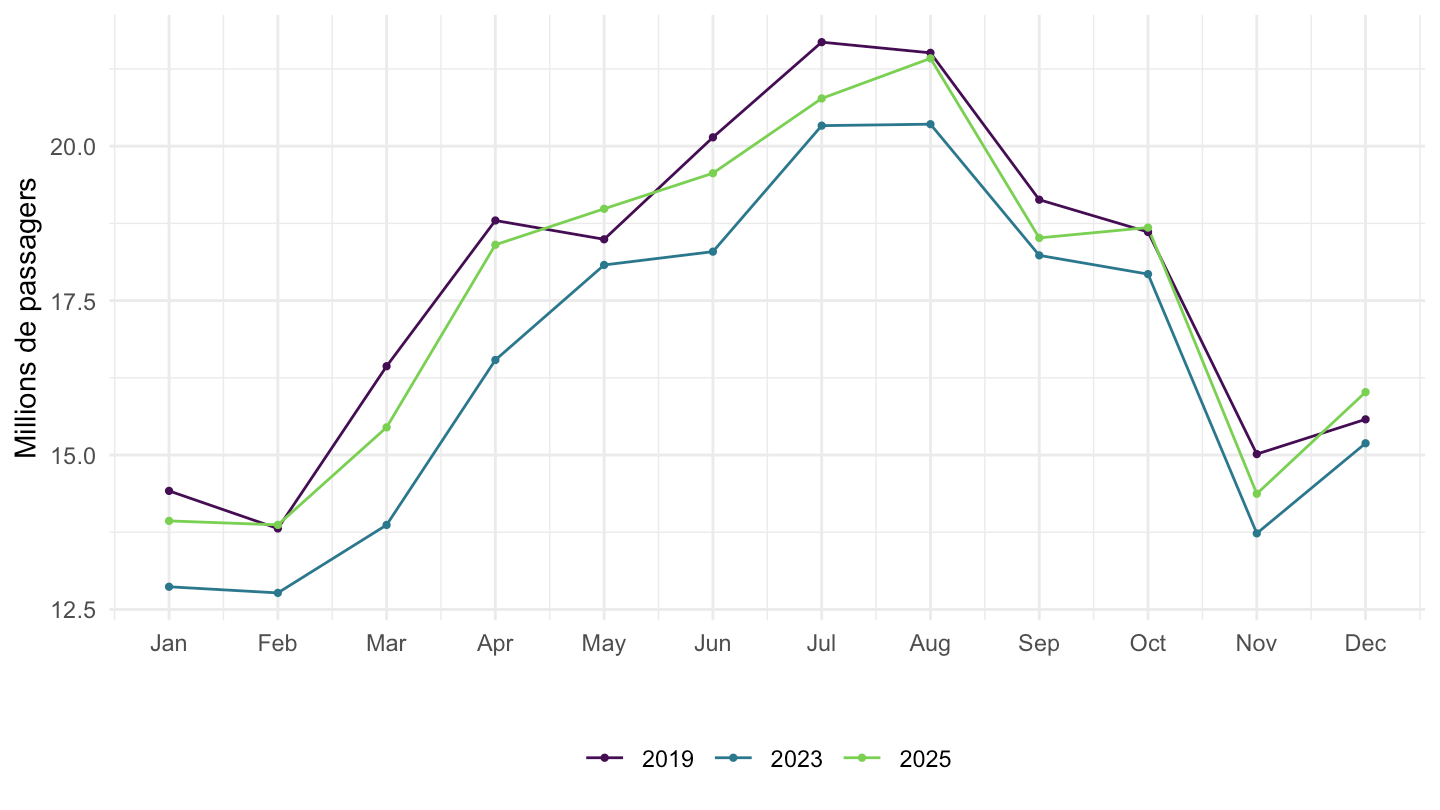
aeroports <- `trafic-aerien-aeroports` |>
  mutate(annee = year(date)) |>
  filter(annee %in% c(2019, 2025)) |>
  group_by(APT, APT_NOM, annee) |>
  summarise(pax = sum(APT_PAX_dep + APT_PAX_arr, na.rm = TRUE) / 1e6, .groups = "drop")
top12 <- aeroports |> filter(annee == 2025) |> slice_max(pax, n = 12) |> pull(APT)
aeroports |>
  filter(APT %in% top12) |>
  mutate(APT_NOM = fct_reorder(str_to_title(APT_NOM), pax, .fun = max)) |>
  ggplot(aes(x = APT_NOM, y = pax, fill = factor(annee))) +
  geom_col(position = "dodge") + coord_flip() + theme_minimal() +
  xlab("") + ylab("Millions de passagers") +
  scale_fill_manual(values = c("#9ecae1", "#08519c")) +
  theme(legend.position = "bottom", legend.title = element_blank())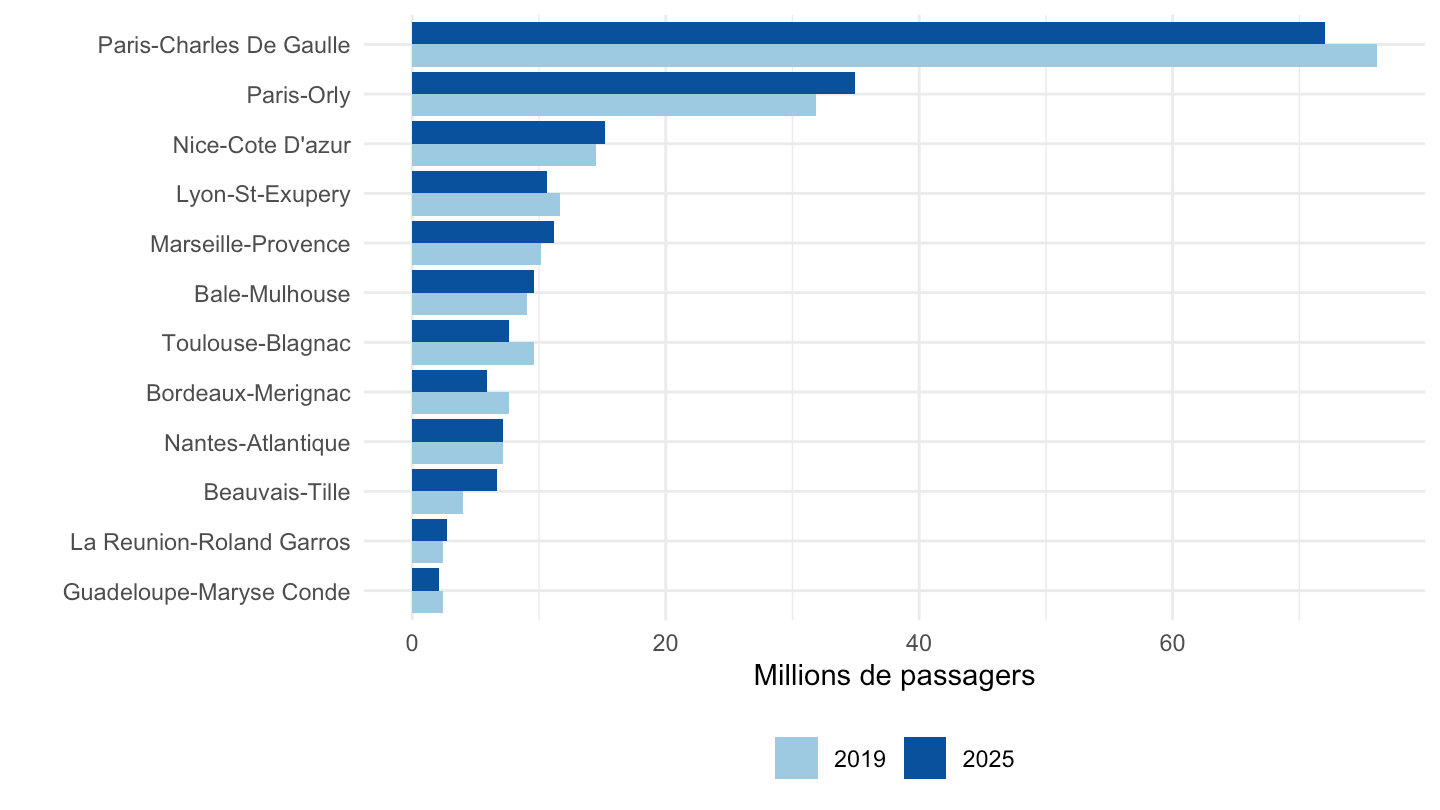
aeroports |>
  pivot_wider(names_from = annee, values_from = pax, names_prefix = "a") |>
  filter(a2019 >= 1) |>
  mutate(ratio = a2025 / a2019 - 1, APT_NOM = fct_reorder(str_to_title(APT_NOM), a2019)) |>
  slice_max(a2019, n = 25) |>
  ggplot(aes(x = APT_NOM, y = ratio, fill = ratio > 0)) +
  geom_col() + coord_flip() + theme_minimal() +
  xlab("") + ylab("Passagers 2025 par rapport à 2019") +
  scale_y_continuous(labels = percent_format(accuracy = 1)) +
  scale_fill_manual(values = c("#b2182b", "#2166ac")) +
  theme(legend.position = "none")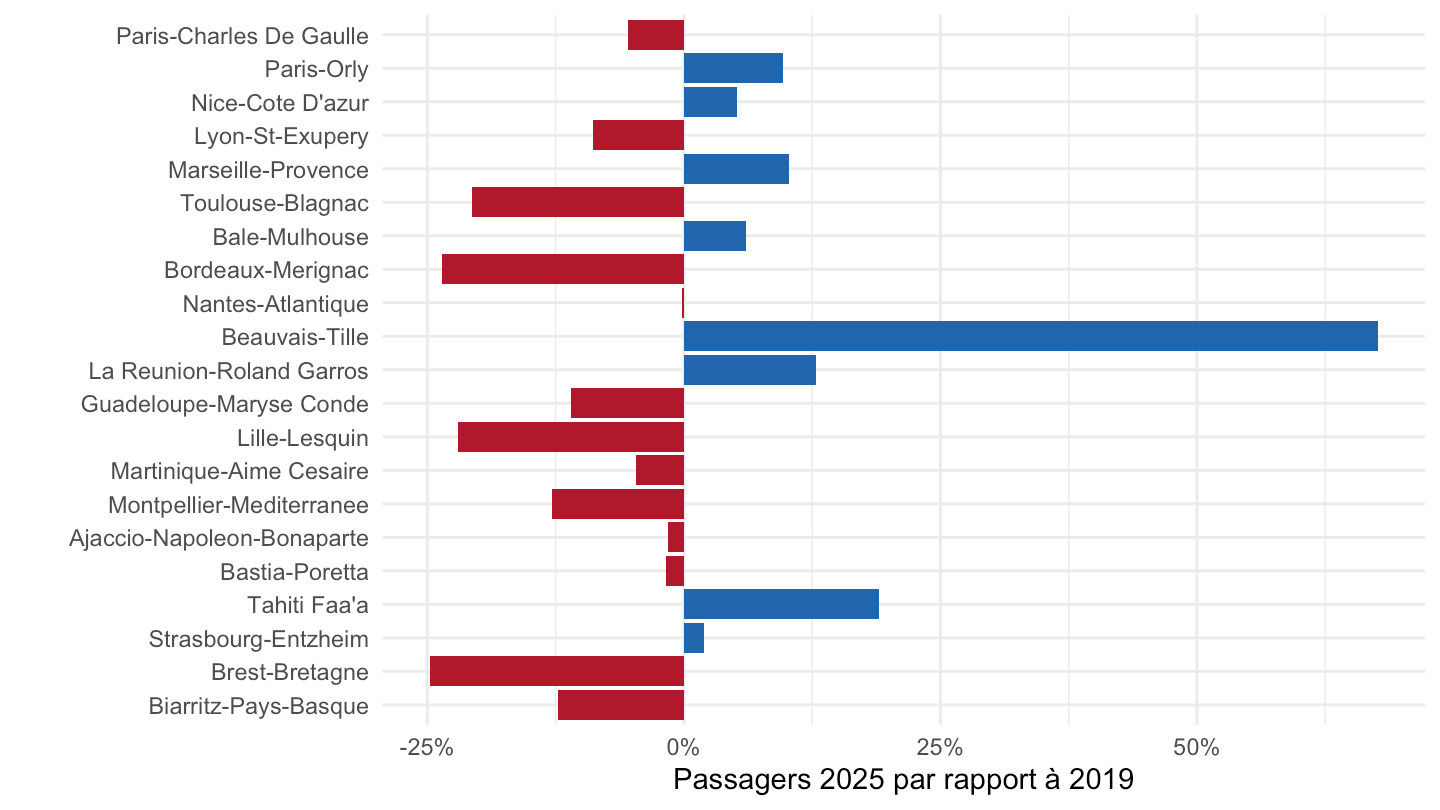
`trafic-aerien-aeroports` |>
  mutate(annee = year(date), pax = APT_PAX_dep + APT_PAX_arr) |>
  group_by(annee) |>
  summarise(`Paris-CDG` = sum(pax[APT == "LFPG"], na.rm = TRUE),
            `Paris-Orly` = sum(pax[APT == "LFPO"], na.rm = TRUE),
            total = sum(pax, na.rm = TRUE), .groups = "drop") |>
  pivot_longer(c(`Paris-CDG`, `Paris-Orly`)) |>
  mutate(date = as.Date(paste0(annee, "-01-01"))) |>
  ggplot(aes(x = date, y = value / total, color = name)) +
  geom_line() + theme_minimal() + xlab("") + ylab("Part du total des passagers") +
  scale_x_date(date_breaks = "5 years", labels = date_format("%Y")) +
  scale_y_continuous(labels = percent_format(accuracy = 1)) +
  theme(legend.position = "bottom", legend.title = element_blank())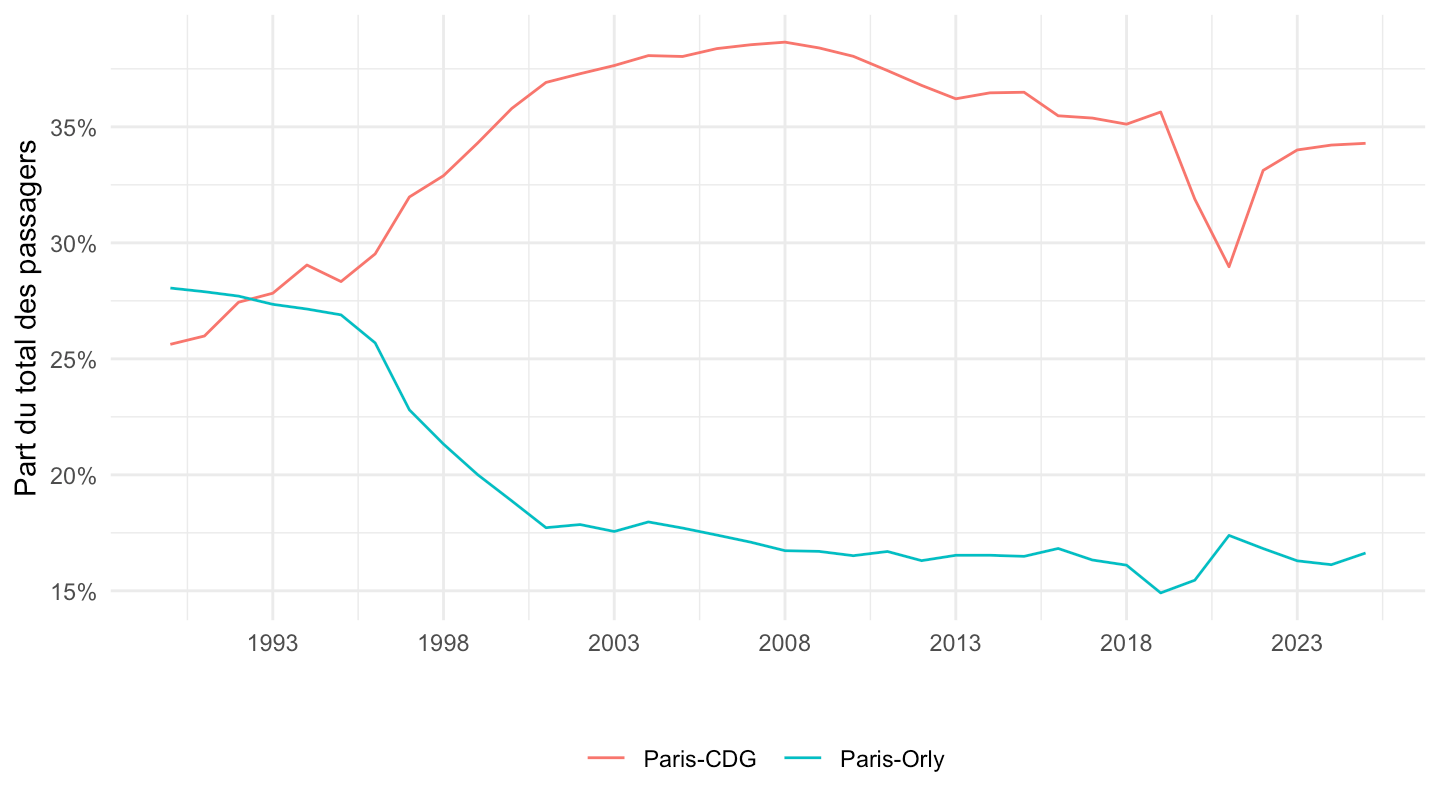
`trafic-aerien-aeroports` |>
  mutate(annee = year(date),
         zone = ifelse(APT_ZON %in% c("OM", "O"), "Outre-mer", "Métropole")) |>
  group_by(annee, zone) |>
  summarise(pax = sum(APT_PAX_dep + APT_PAX_arr, na.rm = TRUE) / 1e6, .groups = "drop") |>
  mutate(date = as.Date(paste0(annee, "-01-01"))) |>
  ggplot(aes(x = date, y = pax, fill = zone)) +
  geom_area() + theme_minimal() + xlab("") + ylab("Millions de passagers") +
  scale_fill_manual(values = c("#2166ac", "#e08214")) +
  scale_x_date(date_breaks = "5 years", labels = date_format("%Y")) +
  theme(legend.position = "bottom", legend.title = element_blank())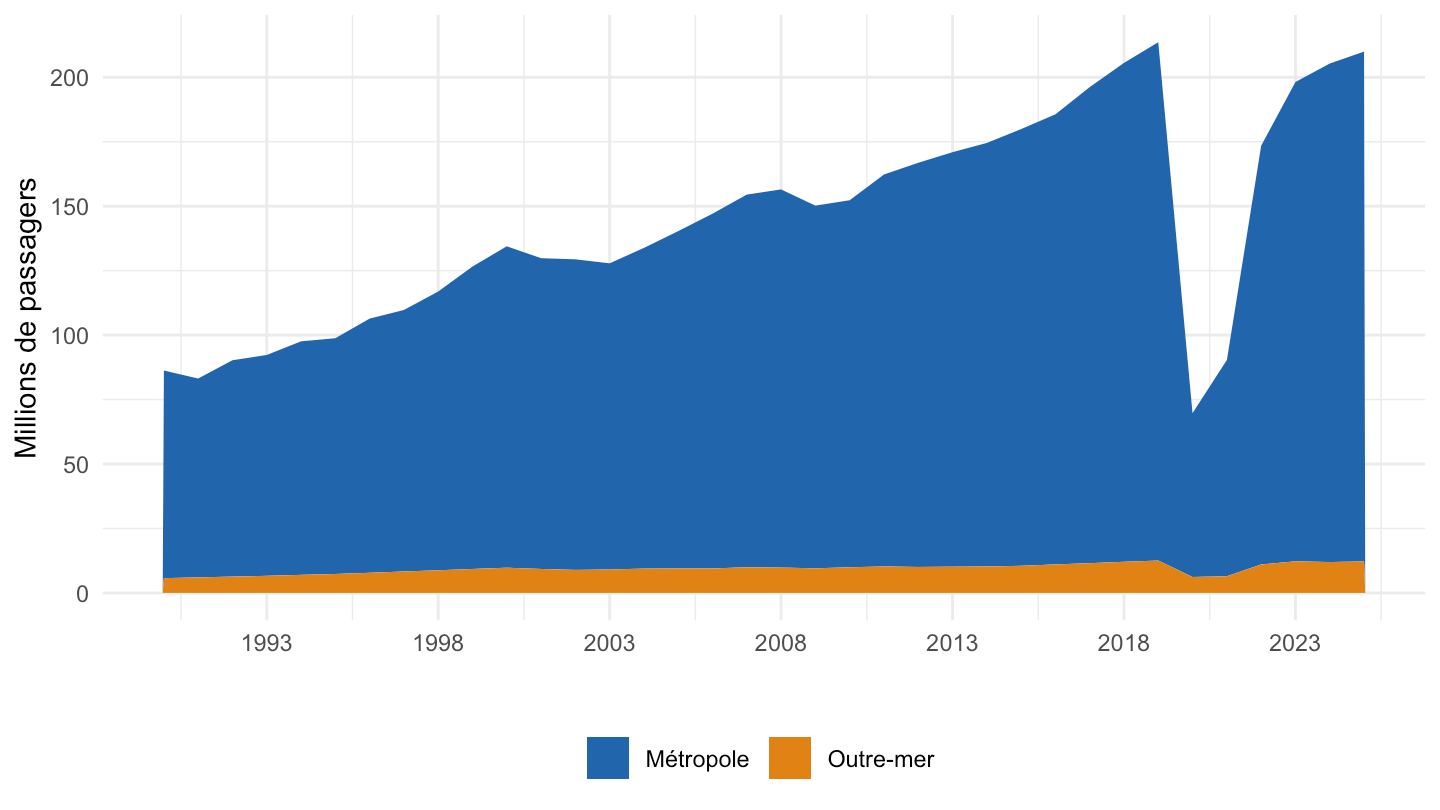
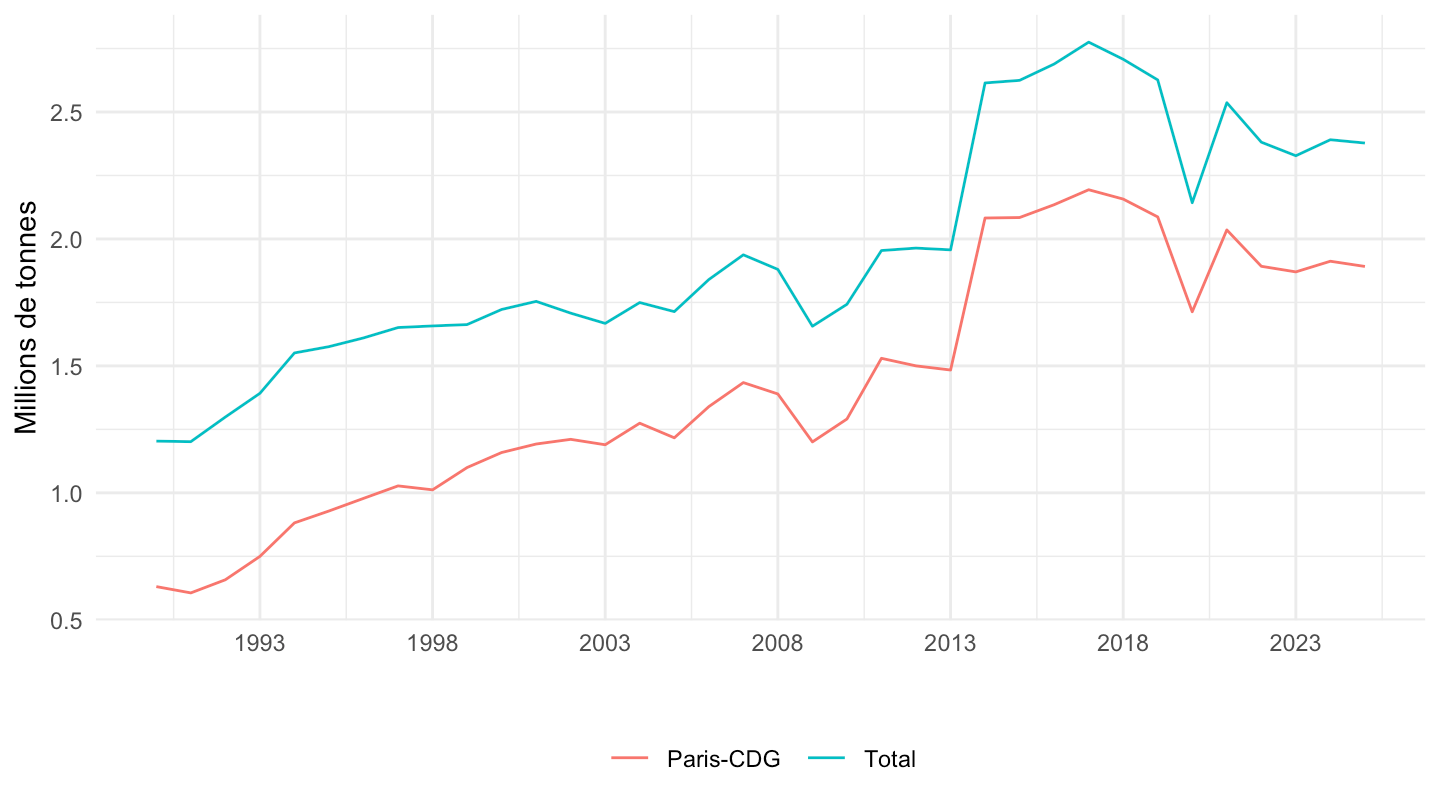
`trafic-aerien-aeroports` |>
  mutate(annee = year(date)) |>
  group_by(annee) |>
  summarise(Total = sum(APT_FRP_dep + APT_FRP_arr, na.rm = TRUE),
            `Paris-CDG` = sum((APT_FRP_dep + APT_FRP_arr)[APT == "LFPG"], na.rm = TRUE)) |>
  pivot_longer(-annee) |>
  mutate(date = as.Date(paste0(annee, "-01-01"))) |>
  ggplot(aes(x = date, y = value / 1e6, color = name)) +
  geom_line() + theme_minimal() + xlab("") + ylab("Millions de tonnes") +
  scale_x_date(date_breaks = "5 years", labels = date_format("%Y")) +
  theme(legend.position = "bottom", legend.title = element_blank())