Code
source (here:: here ("_rinit.R" ))source (here:: here ("code" , "basic_functions.R" )) # dataset_info_lines(), related_data() invisible (Sys.setlocale ("LC_TIME" , "fr_FR.UTF-8" ))suppressMessages (library (sf))# cd ~/iCloud/website/data/depp; /usr/local/bin/R -e 'quarto::quarto_render("fr-en-adresse-et-geolocalisation-etablissements-premier-et-second-degre.qmd")' :: opts_chunk$ set (echo = TRUE , message = FALSE , warning = FALSE ,fig.width = 8 , fig.height = 5 , dpi = 150 )<- here:: here ("data" , "depp" , "fr-en-adresse-et-geolocalisation-etablissements-premier-et-second-degre.parquet" )<- arrow:: read_parquet (adr_path) |> :: mutate (categorie = dplyr:: case_when (grepl ("ECOLE" , nature_uai_libe) ~ "École" ,grepl ("COLLEGE" , nature_uai_libe) ~ "Collège" ,grepl ("LYCEE|ENSEIGNEMENT ADAPTE|SECTION|CETAD|CENTRE" , nature_uai_libe) ~ "Lycée / autre 2nd degré" ,TRUE ~ "Autre" ),secteur = dplyr:: na_if (secteur_public_prive_libe, "" ),arr = dplyr:: if_else (grepl ("^Paris.*Arrondissement" , libelle_commune),as.integer (stringr:: str_extract (libelle_commune, " \\ d+" )), NA_integer_ )<- dplyr:: filter (adr, ! is.na (arr), ! is.na (latitude), ! is.na (longitude))<- dplyr:: filter (paris, arr == 14 )<- ggplot2:: theme_minimal (base_size = 12 ) + :: theme (plot.title = ggplot2:: element_text (face = "bold" ),plot.subtitle = ggplot2:: element_text (colour = "grey35" ),panel.grid.minor = ggplot2:: element_blank (),plot.title.position = "plot" , legend.position = "bottom" )<- c ("École" = "#3b8fb8" , "Collège" = "#dd6b20" , "Lycée / autre 2nd degré" = "#7048a8" )<- function (x) sf:: st_as_sfc (structure (lapply (x, as.raw), class = "WKB" ), EWKB = FALSE )<- arrow:: read_parquet (here:: here ("data" , "paris" , "arrondissements.parquet" )) |> :: transmute (arr = as.integer (c_ar), geometry = wkb2sfc (geom)) |> :: st_as_sf (crs = 4326 )<- function (df) sf:: st_as_sf (df, coords = c ("longitude" , "latitude" ), crs = 4326 , remove = FALSE )
Annuaire géolocalisé de tous les établissements scolaires du premier et du second degré : adresse, coordonnées, nature (école, collège, lycée…), secteur, état (ouvert / à fermer / à ouvrir), date d’ouverture. 63 985 établissements, dont 63 540 ouverts.
Paris
Code
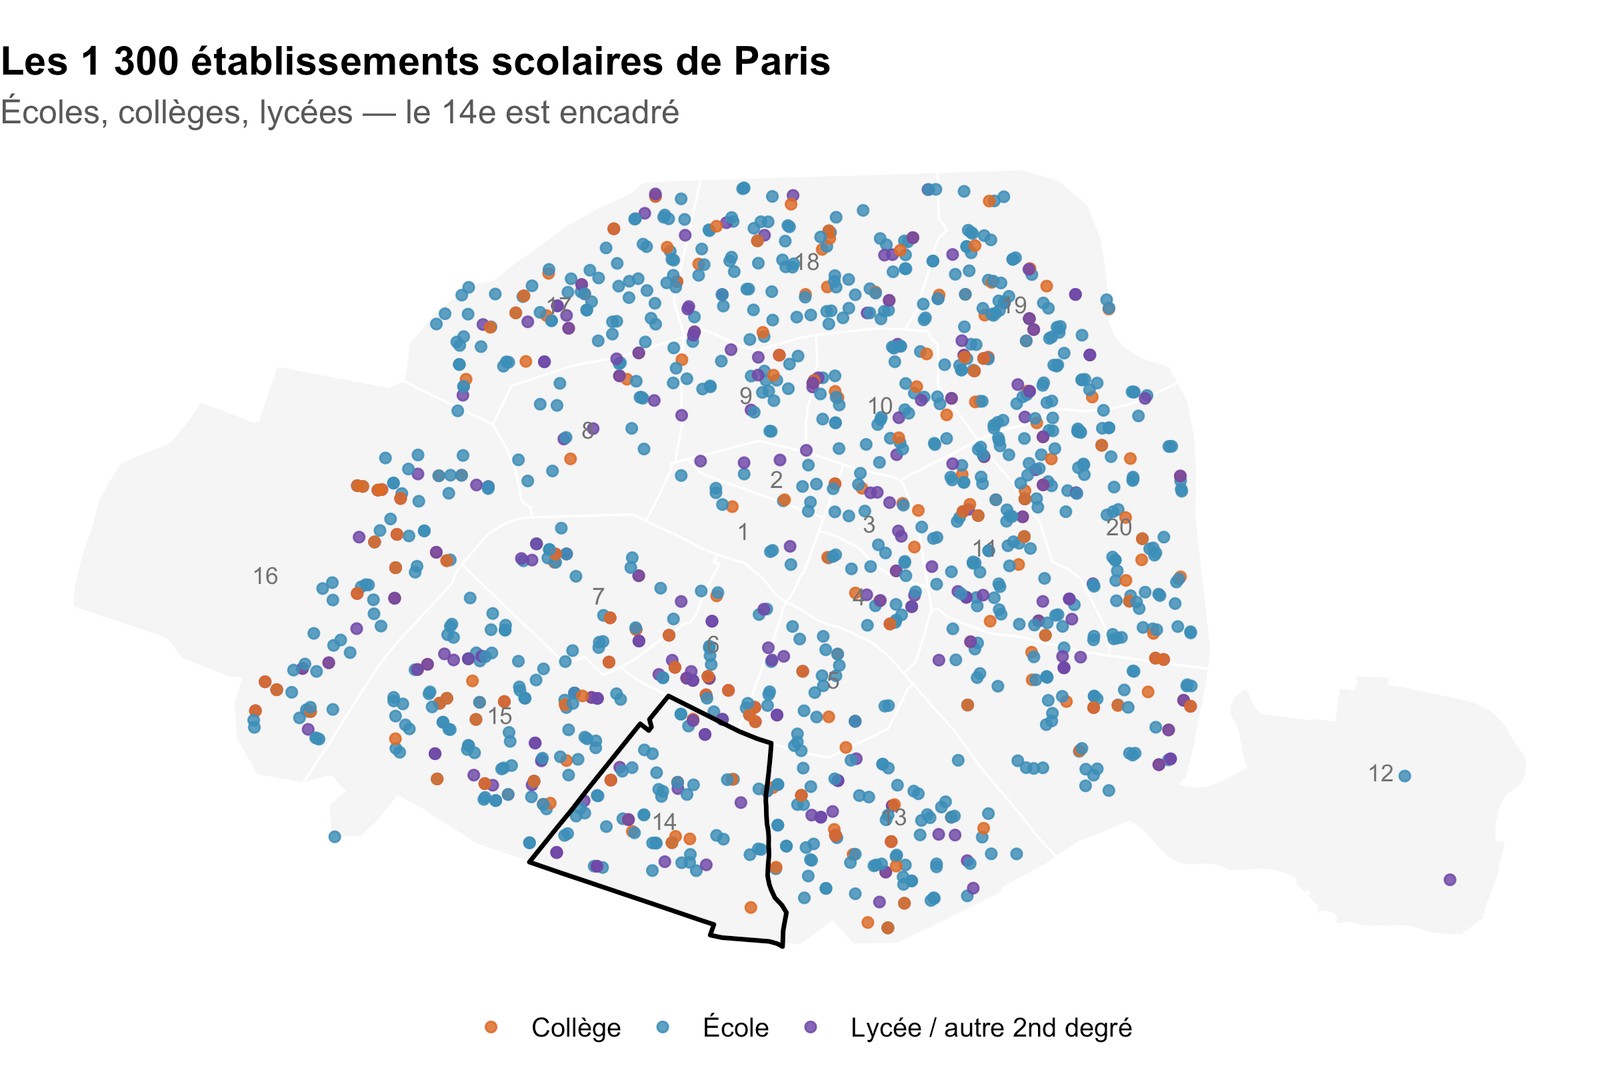
ggplot () + geom_sf (data = arr_sf, fill = "grey96" , colour = "white" , linewidth = 0.4 ) + geom_sf (data = to_sf (paris), aes (colour = categorie), size = 1.5 , alpha = 0.85 ) + geom_sf_text (data = arr_sf, aes (label = arr), size = 3 , colour = "grey45" ) + geom_sf (data = dplyr:: filter (arr_sf, arr == 14 ), fill = NA , colour = "black" , linewidth = 0.8 ) + scale_colour_manual (values = pal_cat, name = NULL ) + labs (title = sprintf ("Les %s établissements scolaires de Paris" , format (nrow (paris), big.mark = " " )),subtitle = "Écoles, collèges, lycées — le 14e est encadré" ) + theme_void (base_size = 12 ) + :: theme (plot.title = ggplot2:: element_text (face = "bold" ),plot.subtitle = ggplot2:: element_text (colour = "grey35" ),plot.title.position = "plot" , legend.position = "bottom" )
Code
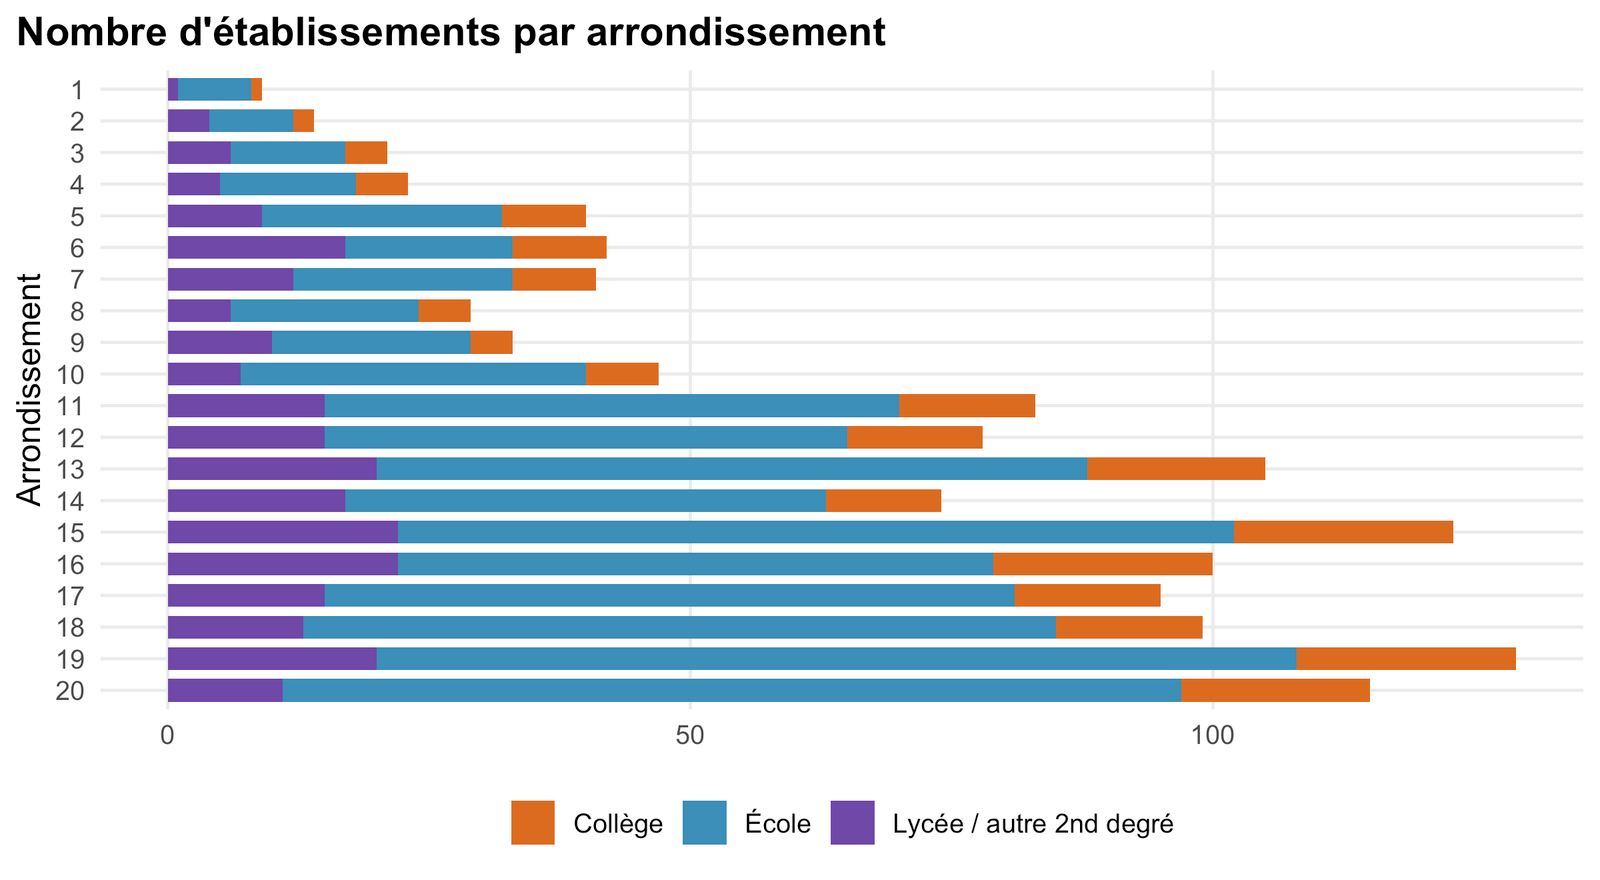
|> :: count (arr, categorie) |> ggplot (aes (n, factor (arr, levels = 20 : 1 ), fill = categorie)) + geom_col (width = 0.72 ) + scale_fill_manual (values = pal_cat, name = NULL ) + labs (title = "Nombre d'établissements par arrondissement" ,x = NULL , y = "Arrondissement" ) +
Focus : le 14e arrondissement
Code
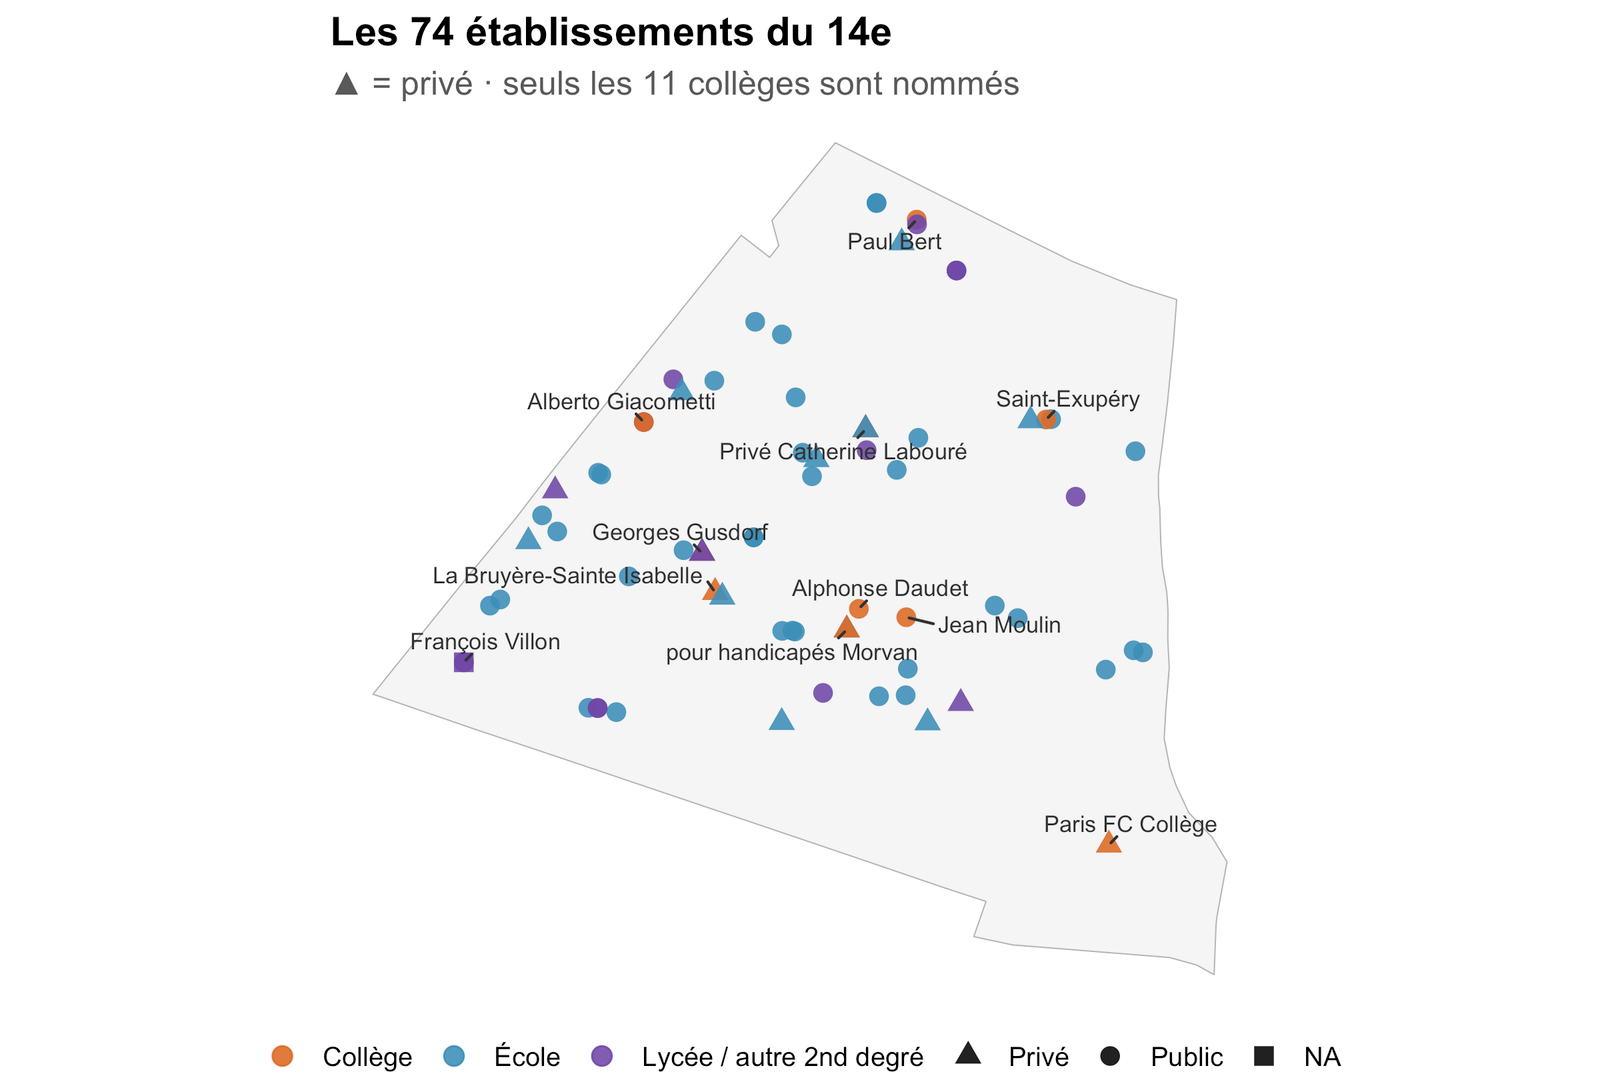
<- dplyr:: filter (arr_sf, arr == 14 )ggplot () + geom_sf (data = a14, fill = "grey96" , colour = "grey70" ) + geom_sf (data = to_sf (paris14), aes (colour = categorie, shape = secteur), size = 3 , alpha = 0.9 ) + :: geom_text_repel (data = dplyr:: filter (paris14, categorie == "Collège" ),aes (longitude, latitude, label = sub ("^Collège (privé )?" , "" , appellation_officielle)),size = 2.9 , max.overlaps = 30 , min.segment.length = 0 , colour = "grey20" , seed = 1 ) + scale_colour_manual (values = pal_cat, name = NULL ) + scale_shape_manual (values = c ("Public" = 16 , "Privé" = 17 ), name = NULL , na.value = 15 ) + labs (title = sprintf ("Les %d établissements du 14e" , nrow (paris14)),subtitle = "▲ = privé · seuls les 11 collèges sont nommés" ) + theme_void (base_size = 12 ) + :: theme (plot.title = ggplot2:: element_text (face = "bold" ),plot.subtitle = ggplot2:: element_text (colour = "grey35" ),plot.title.position = "plot" , legend.position = "bottom" )
Code
|> :: arrange (categorie, appellation_officielle) |> :: transmute (Établissement = appellation_officielle, Catégorie = categorie,Secteur = secteur, Adresse = adresse_uai,CP = code_postal_uai,Ouverture = format (date_ouverture, "%Y" ),tat = etat_etablissement_libe) |> :: reactable (pagination = FALSE , compact = TRUE , resizable = TRUE , highlight = TRUE , wrap = TRUE ,defaultColDef = reactable:: colDef (align = "left" ,headerStyle = list (fontWeight = "bold" ),style = list (whiteSpace = "normal" , wordBreak = "break-word" )),columns = list (Établissement = reactable:: colDef (minWidth = 180 ),Adresse = reactable:: colDef (minWidth = 160 )))
France — répartition
Code
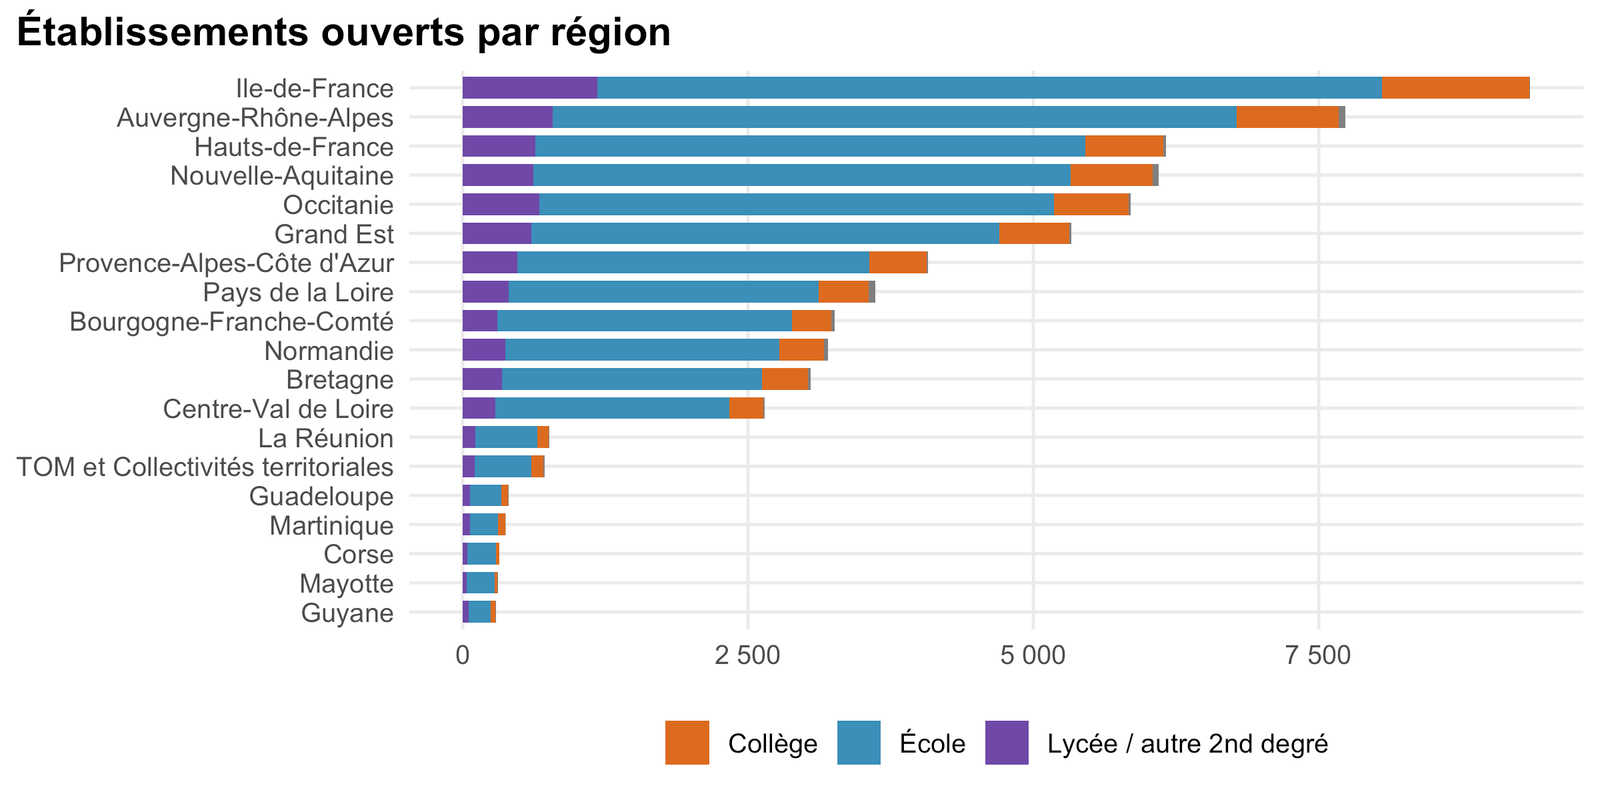
|> :: filter (etat_etablissement_libe == "OUVERT" ) |> :: count (libelle_region, categorie) |> :: filter (! is.na (libelle_region)) |> ggplot (aes (n, forcats:: fct_reorder (libelle_region, n, sum), fill = categorie)) + geom_col (width = 0.75 ) + scale_fill_manual (values = pal_cat, name = NULL ) + scale_x_continuous (labels = scales:: label_number (big.mark = " " )) + labs (title = "Établissements ouverts par région" , x = NULL , y = NULL ) +
Tous les établissements de Paris
Code
|> :: transmute (UAI = numero_uai, Établissement = appellation_officielle, Catégorie = categorie,Nature = nature_uai_libe, Secteur = secteur,Arrondissement = arr, CP = code_postal_uai, Adresse = adresse_uai,tat = etat_etablissement_libe, Ouverture = format (date_ouverture, "%Y" ),Latitude = round (latitude, 5 ), Longitude = round (longitude, 5 )) |> :: arrange (Arrondissement, Établissement) |> :: reactable (searchable = TRUE , filterable = TRUE , pagination = TRUE ,defaultPageSize = 15 , showPageSizeOptions = TRUE , pageSizeOptions = c (15 , 50 , 100 ),compact = TRUE , resizable = TRUE , highlight = TRUE , wrap = TRUE ,defaultColDef = reactable:: colDef (align = "left" ,headerStyle = list (fontWeight = "bold" ),style = list (whiteSpace = "normal" , wordBreak = "break-word" )))
Le fichier complet (France entière, 63 985 établissements) est directement interrogeable sur data.education.gouv.fr .
Source & données
Code
:: tibble (` ` = c ("Jeu de données" , "Producteur" , "Champ" , "Fichier" , "Mise à jour" , "Observations" ),` ` = c ("[Adresse et géolocalisation des établissements](https://data.education.gouv.fr/explore/dataset/fr-en-adresse-et-geolocalisation-etablissements-premier-et-second-degre/) — DEPP" ,"Direction de l'Évaluation, de la Prospective et de la Performance (DEPP), ministère de l'Éducation nationale" ,"France ; établissements du 1er et du 2nd degré, public et privé" ,sprintf ("`data/depp/fr-en-adresse-et-geolocalisation-etablissements-premier-et-second-degre.parquet` (%s ko)" ,round (file.size (adr_path) / 1024 )),format (as.Date (file.mtime (adr_path)), "%d %B %Y" ),sprintf ("%s établissements" , format (nrow (adr), big.mark = " " ))|> :: gt () |> gt:: fmt_markdown (columns = ` ` ) |> :: tab_options (table.width = "100%" , column_labels.hidden = TRUE )
Jeu de données
Adresse et géolocalisation des établissements — DEPP
Producteur
Direction de l’Évaluation, de la Prospective et de la Performance (DEPP), ministère de l’Éducation nationale
Champ
France ; établissements du 1er et du 2nd degré, public et privé
Fichier
data/depp/fr-en-adresse-et-geolocalisation-etablissements-premier-et-second-degre.parquet (7703 ko)
Mise à jour
08 septembre 2026
Observations
63 985 établissements