Last compile: 15 oct. 2026, 22:35
Links
Industry
B1GVB_E
Code
rdb(ids = c("OECD/QNA/FRA.B1GVB_E.LNBQRSA.Q",
            "OECD/QNA/ITA.B1GVB_E.LNBQRSA.Q",
            "OECD/QNA/GBR.B1GVB_E.LNBQRSA.Q",
            "OECD/QNA/ESP.B1GVB_E.LNBQRSA.Q",
            "OECD/QNA/DEU.B1GVB_E.LNBQRSA.Q")) |>
  filter(period >= as.Date("2017-04-01")) |>
  add_flag_color("Country") |>
  group_by(Country) |>
  arrange(period) |>
  mutate(value = 100 * value / value[period == as.Date("2017-04-01")]) |>
  ggplot() + theme_minimal() + xlab("") + ylab("Industry") +
  geom_line(aes(x = period, y = value, color = color)) +
  add_5flags + scale_color_identity() +
  scale_x_date(breaks = "6 months",
               labels = date_format("%b %Y")) +
  theme(legend.position = "none") +
  scale_y_log10(breaks = seq(70, 200, 2)) +
  geom_hline(yintercept = 100, linetype = "dashed")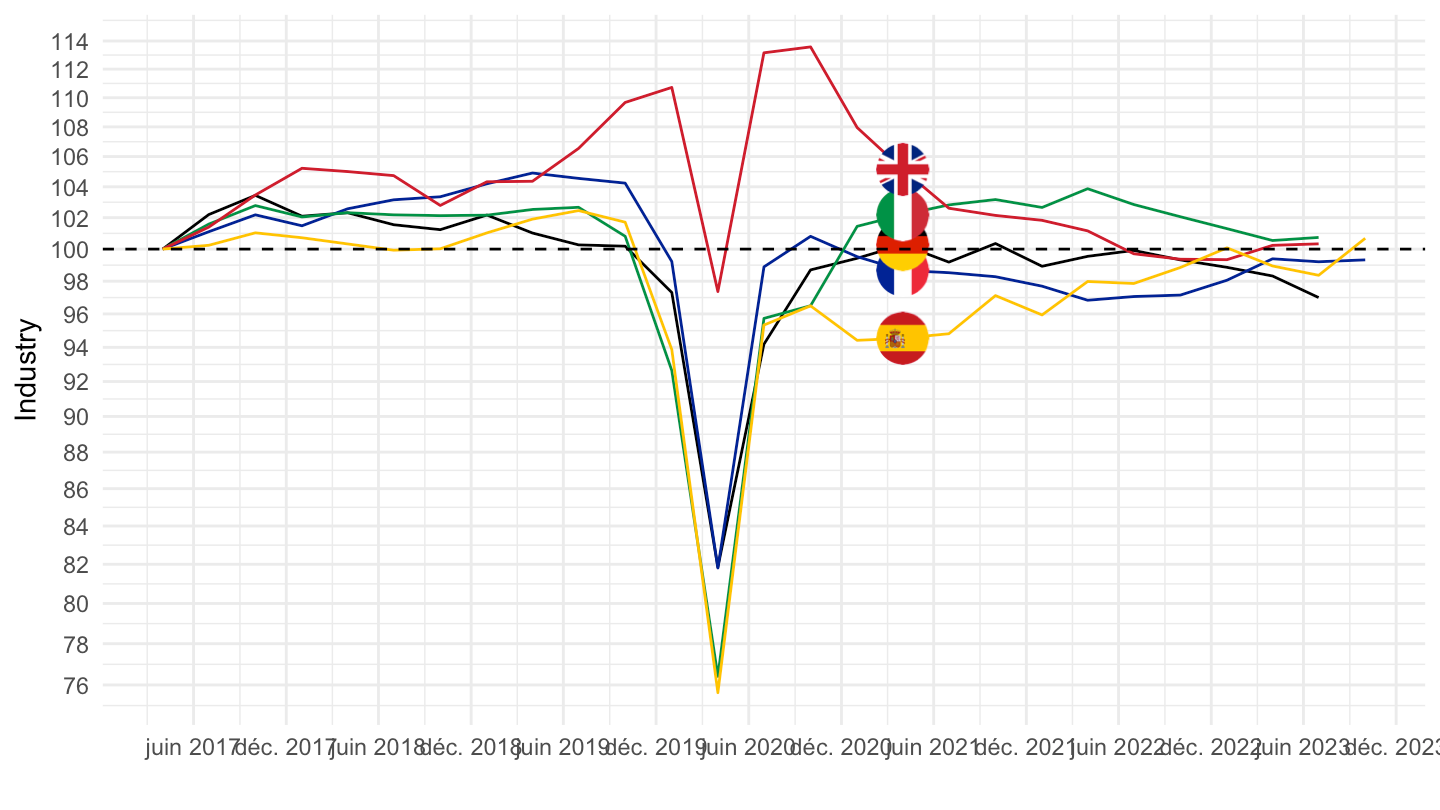
B1GVC
Code
rdb(ids = c("OECD/QNA/FRA.B1GVC.LNBQRSA.Q",
            "OECD/QNA/ITA.B1GVC.LNBQRSA.Q",
            "OECD/QNA/GBR.B1GVC.LNBQRSA.Q",
            "OECD/QNA/ESP.B1GVC.LNBQRSA.Q",
            "OECD/QNA/DEU.B1GVC.LNBQRSA.Q")) |>
  filter(period >= as.Date("2017-04-01")) |>
  add_flag_color("Country") |>
  group_by(Country) |>
  arrange(period) |>
  mutate(value = 100 * value / value[period == as.Date("2017-04-01")]) |>
  ggplot() + theme_minimal() + xlab("") + ylab("Industry") +
  geom_line(aes(x = period, y = value, color = color)) +
  add_5flags + scale_color_identity() +
  scale_x_date(breaks = "6 months",
               labels = date_format("%b %Y")) +
  theme(legend.position = "none") +
  scale_y_log10(breaks = seq(70, 200, 2)) +
  geom_hline(yintercept = 100, linetype = "dashed")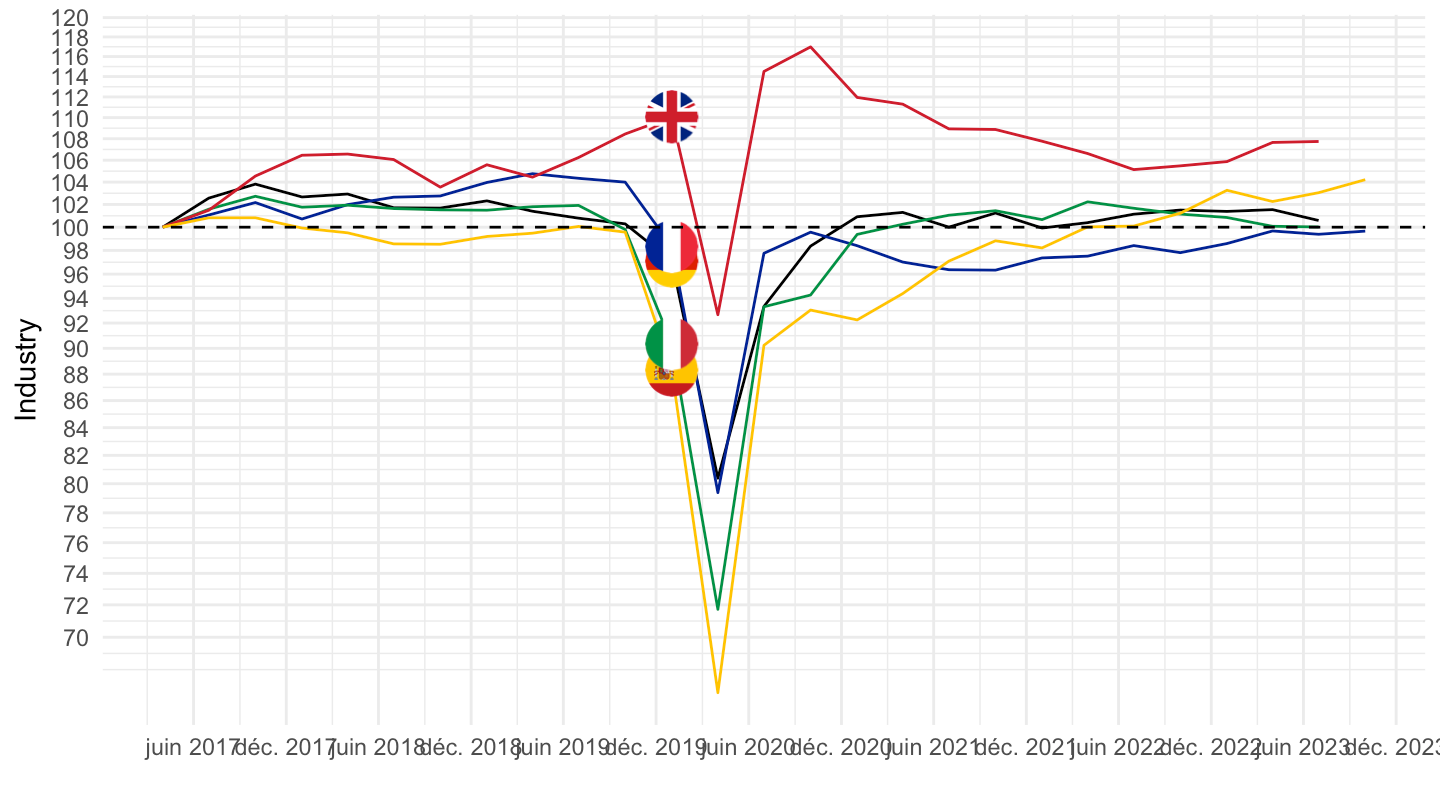
GDP
Nominal
Code
rdb(ids = c("OECD/QNA/FRA.B1_GE.CARSA.Q",
            "OECD/QNA/USA.B1_GE.CARSA.Q",
            "OECD/QNA/ITA.B1_GE.CARSA.Q",
            "OECD/QNA/GBR.B1_GE.CARSA.Q",
            "OECD/QNA/ESP.B1_GE.CARSA.Q",
            "OECD/QNA/DEU.B1_GE.CARSA.Q")) |>
  filter(period >= as.Date("2019-10-01")) |>
  select(Country, period, value) |>
  group_by(Country) |>
  mutate(value = 100*value/value[1]) |>
  ggplot() + geom_line(aes(x = period, y = value, color = Country)) +
  theme_minimal() + xlab("") + ylab("Nominal GDP") +
  theme(legend.position = c(0.85, 0.3),
        legend.title = element_blank()) +
  scale_x_date(breaks = "3 months",
               labels = date_format("%m-%Y")) +
  scale_y_continuous(breaks = seq(80, 120, 2))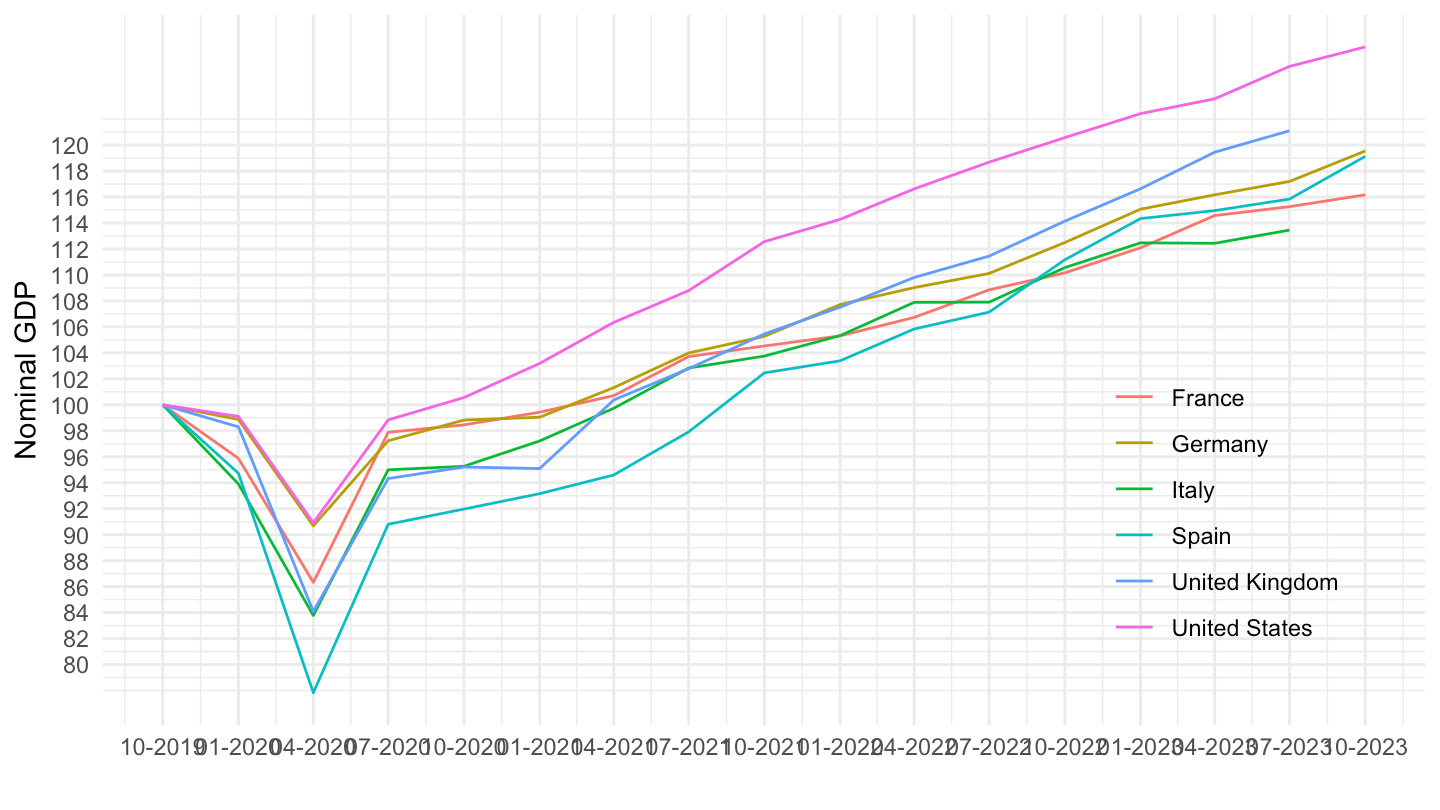
Real
Code
rdb(ids = c("OECD/QNA/FRA.B1_GE.VOBARSA.Q",
            "OECD/QNA/USA.B1_GE.VOBARSA.Q",
            "OECD/QNA/ITA.B1_GE.VOBARSA.Q",
            "OECD/QNA/GBR.B1_GE.VOBARSA.Q",
            "OECD/QNA/ESP.B1_GE.VOBARSA.Q",
            "OECD/QNA/DEU.B1_GE.VOBARSA.Q")) |>
  filter(period >= as.Date("2017-04-01")) |>
  add_flag_color("Country") |>
  group_by(Country) |>
  arrange(period) |>
  mutate(value = 100 * value / value[period == as.Date("2017-04-01")]) |>
  ggplot() + theme_minimal() + xlab("") + ylab("Real GDP (2017Q2 = 100)") +
  geom_line(aes(x = period, y = value, color = color)) +
  add_6flags + scale_color_identity() +
  scale_x_date(breaks = "6 months",
               labels = date_format("%b %Y")) +
  theme(legend.position = "none") +
  scale_y_log10(breaks = seq(70, 200, 2)) +
  geom_hline(yintercept = 100, linetype = "dashed")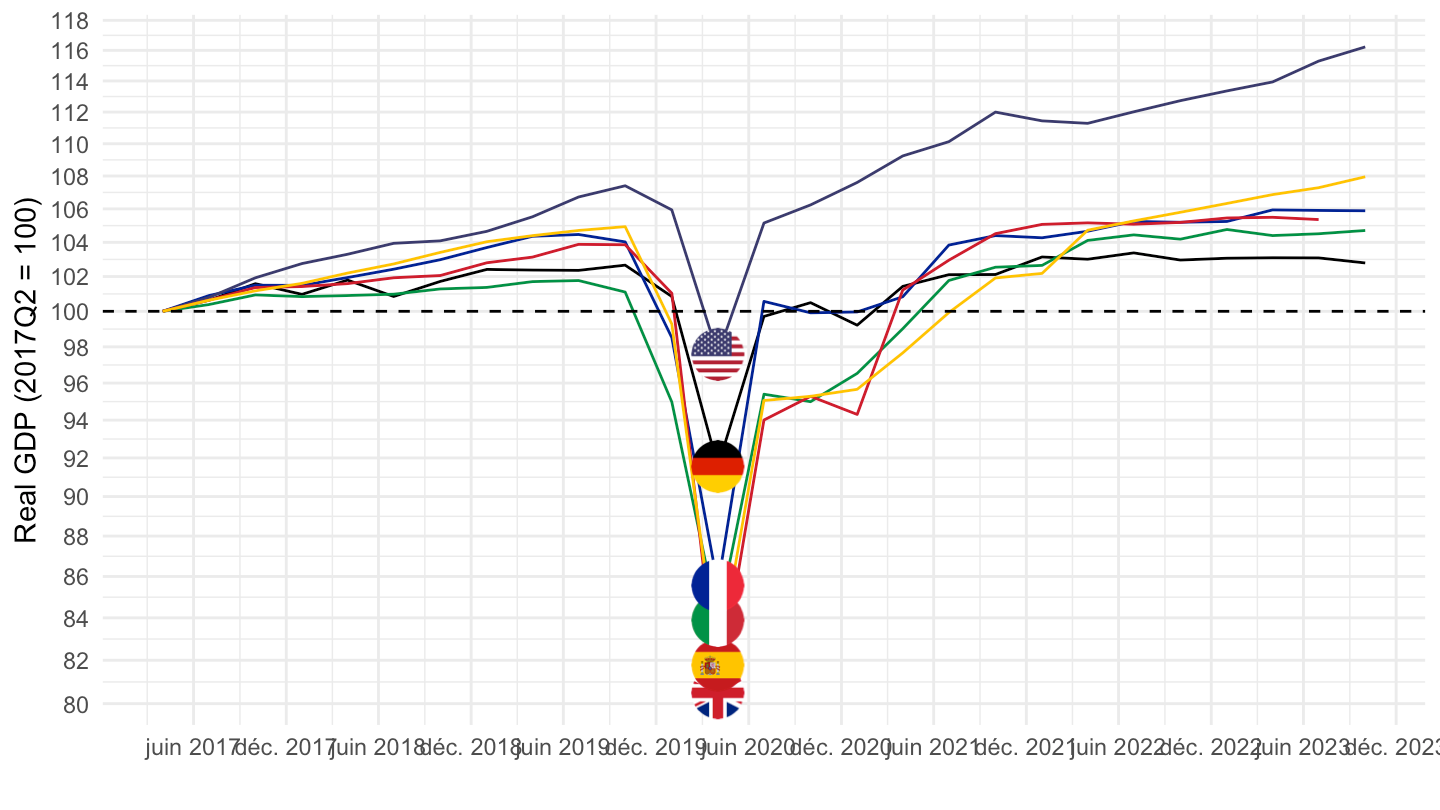
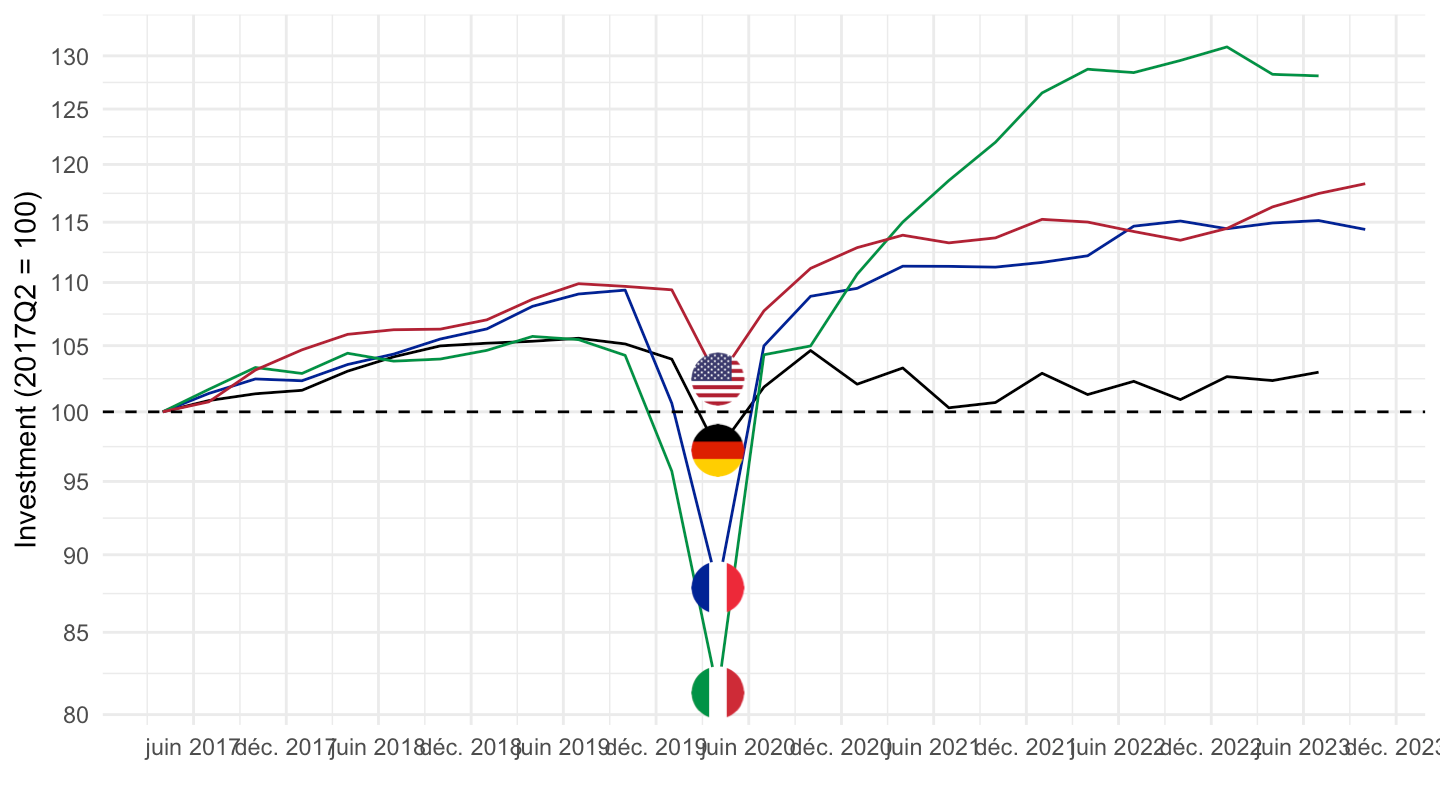
Investment
France, Italy, Lithuania, Poland
Code
rdb(ids = c("OECD/QNA/FRA.P51.VOBARSA.Q",
            "OECD/QNA/ITA.P51.VOBARSA.Q",
            "OECD/QNA/LTU.P51.VOBARSA.Q",
            "OECD/QNA/POL.P51.VOBARSA.Q")) |>
  filter(period >= as.Date("2017-04-01")) |>
  add_flag_color("Country") |>
  group_by(Country) |>
  arrange(period) |>
  mutate(value = 100 * value / value[period == as.Date("2017-04-01")]) |>
  ggplot() + theme_minimal() + xlab("") + ylab("Investment (2017Q2 = 100)") +
  geom_line(aes(x = period, y = value, color = color)) +
  add_4flags + scale_color_identity() +
  scale_x_date(breaks = "6 months",
               labels = date_format("%b %Y")) +
  theme(legend.position = "none") +
  scale_y_log10(breaks = seq(70, 200, 2)) +
  geom_hline(yintercept = 100, linetype = "dashed")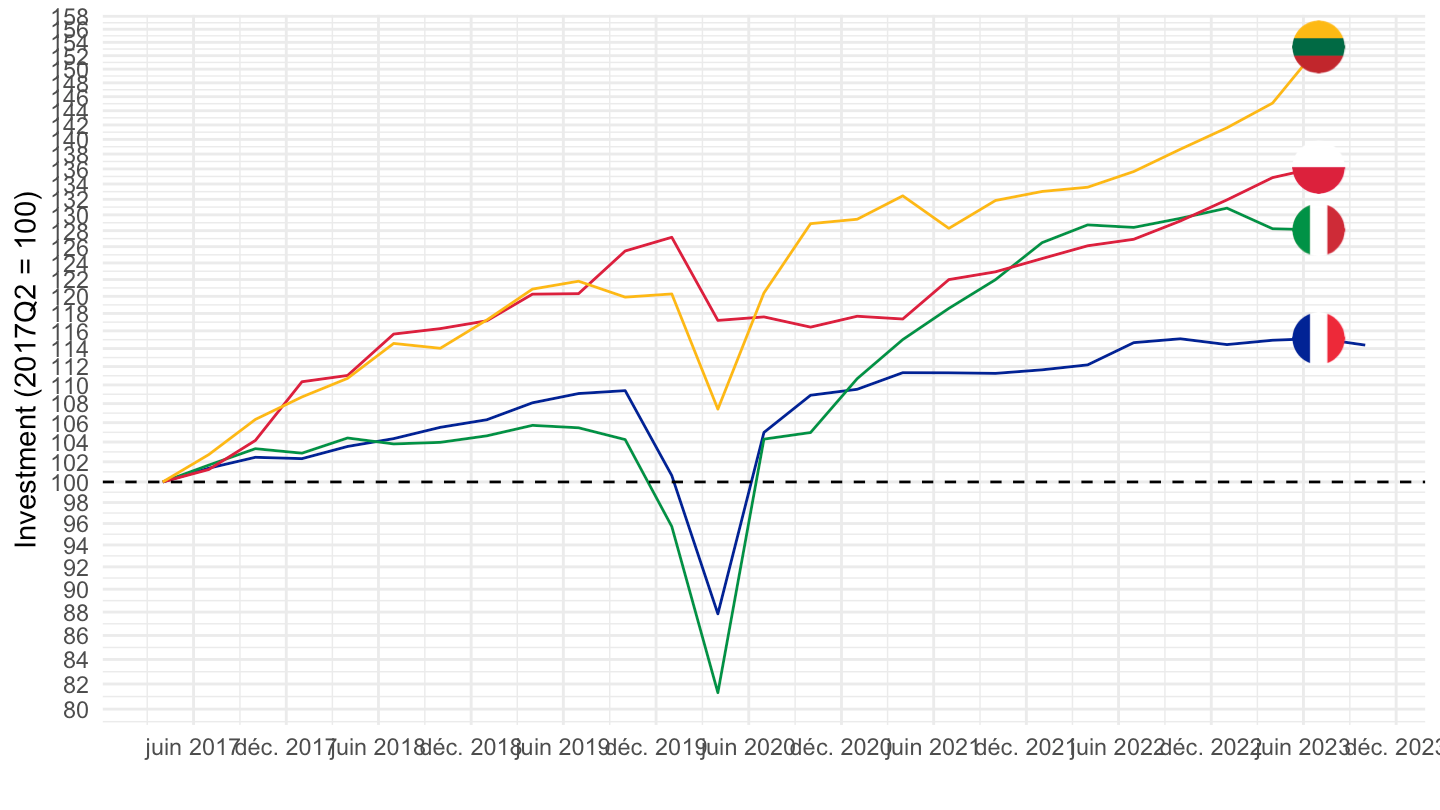
France, Germany, USA, Italy
Code
rdb(ids = c("OECD/QNA/FRA.P51.VOBARSA.Q",
            "OECD/QNA/ITA.P51.VOBARSA.Q",
            "OECD/QNA/DEU.P51.VOBARSA.Q",
            "OECD/QNA/USA.P51.VOBARSA.Q")) |>
  filter(period >= as.Date("2017-04-01")) |>
  add_flag_color("Country") |>
  group_by(Country) |>
  arrange(period) |>
  mutate(value = 100 * value / value[period == as.Date("2017-04-01")]) |>
  ggplot() + theme_minimal() + xlab("") + ylab("Investment (2017Q2 = 100)") +
  geom_line(aes(x = period, y = value, color = color)) +
  add_4flags + scale_color_identity() +
  scale_x_date(breaks = "6 months",
               labels = date_format("%b %Y")) +
  theme(legend.position = "none") +
  scale_y_log10(breaks = seq(70, 200, 5)) +
  geom_hline(yintercept = 100, linetype = "dashed")