Last data update: 15 oct. 2026, 22:32
Last compile: 15 oct. 2026, 22:32
tax_JPN %>%
{if (is_html_output()) print_table(.) else .}| date | sales_tax |
|---|---|
| 1989-03-01 | 0.00 |
| 1989-04-01 | 0.03 |
| 1997-04-01 | 0.05 |
| 2014-04-01 | 0.08 |
| 2019-10-01 | 0.10 |
| 2020-05-01 | 0.10 |
tax_JPN |>
  complete(date = seq.Date(min(date), max(date), by = "day")) |>
  fill(sales_tax) |>
  filter(date >= as.Date("1986-01-01")) |>
  gather(variable, value, -date) |>
  ggplot() + theme_minimal() +
  geom_line(aes(x = date, y = value)) +
  scale_x_date(breaks = seq(1920, 2100, 2) |> paste0("-01-01") |> as.Date(),
               labels = date_format("%Y")) +
  scale_y_continuous(breaks = 0.01*seq(0, 50, 1),
                     labels = percent_format(accuracy = 1)) +
  ylab("Japan Sales Tax Rate (%)") + xlab("")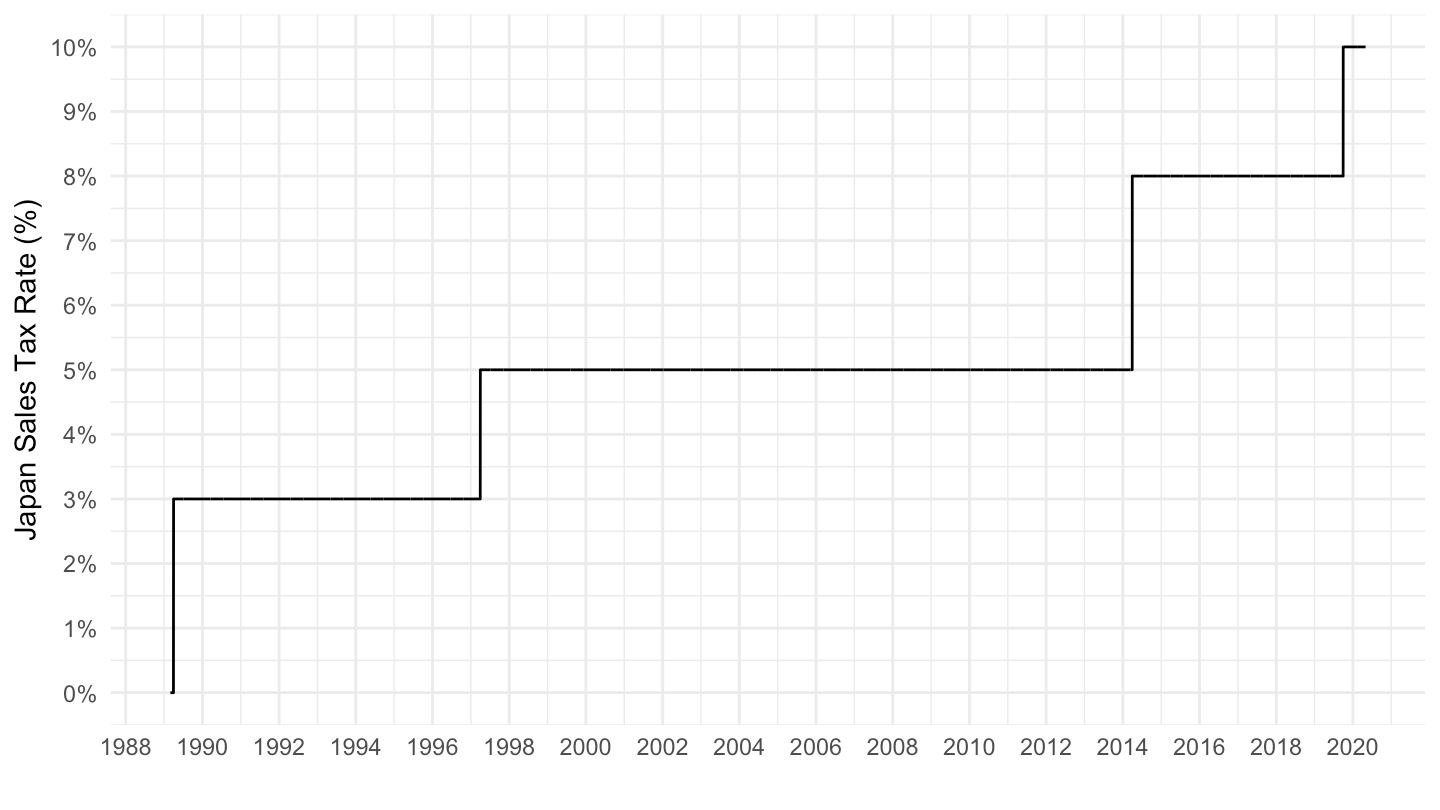
tax_JPN |>
  complete(date = seq.Date(min(date), max(date), by = "day")) |>
  fill(sales_tax) |>
  gather(variable, value, -date) |>
  ggplot() + theme_minimal() +
  geom_line(aes(x = date, y = value)) +
  scale_x_date(breaks = seq(1920, 2100, 5) |> paste0("-01-01") |> as.Date(),
               labels = date_format("%Y")) +
  scale_y_continuous(breaks = 0.01*seq(0, 50, 1),
                     labels = percent_format(accuracy = 1)) +
  ylab("Japan Sales Tax Rate (%)") + xlab("")
tax_DEU %>%
{if (is_html_output()) print_table(.) else .}| date | reduced_rate | sales_tax |
|---|---|---|
| 1968-01-01 | 0.050 | 0.10 |
| 1968-07-01 | 0.055 | 0.11 |
| 1978-01-01 | 0.060 | 0.12 |
| 1979-07-01 | 0.065 | 0.13 |
| 1983-07-01 | 0.070 | 0.14 |
| 1993-01-01 | 0.070 | 0.15 |
| 1998-04-01 | 0.070 | 0.16 |
| 2007-01-01 | 0.070 | 0.19 |
| 2020-07-01 | 0.070 | 0.16 |
| 2021-01-01 | 0.070 | 0.19 |
| 2021-02-23 | 0.070 | 0.19 |
tax_DEU |>
  complete(date = seq.Date(min(date), max(date), by = "day")) |>
  fill(sales_tax, reduced_rate) |>
  gather(variable, value, -date) |>
  mutate(variable_desc = case_when(variable == "reduced_rate" ~ "VAT Rate - Reduced (%)",
                                   variable == "sales_tax" ~ "VAT Rate - Main (%)")) |>
  ggplot() + geom_line(aes(x = date, y = value, color = variable_desc, linetype = variable_desc)) +
  scale_color_manual(values = viridis(4)[1:3]) +
  theme_minimal() +
  scale_x_date(breaks = seq(1920, 2100, 5) |> paste0("-01-01") |> as.Date(),
               labels = date_format("%Y")) +
  theme(legend.position = c(0.2, 0.9),
        legend.title = element_blank()) +
  scale_y_continuous(breaks = 0.01*seq(0, 50, 1),
                     labels = percent_format(accuracy = 1)) +
  ylab("Germany's VAT Tax Rate (%)") + xlab("")