
Last observation: 2018 (N = 13539)
First observation: 1967 (N = 13011)
Last data update: 01 août 2026, 21:29
Last compile: 10 oct. 2026, 00:10
tibble(id = c("CHELEM_2018_PIB_VA_BvD_20180702",
              "CHELEM_2018_PIB_VO_BvD_20180702",
              "bilateral_ER",
              "TRADHIST_EXCHANGE_RATES",
              "chel202016718_TT",
              "chel202016718",
              "chelem"),
       label = c("PIB.",
                 "PIB Réel",
                 "bilateral_ER",
                 "TRADHIST_EXCHANGE_RATES",
                 "chel202016718_TT",
                 "chel202016718",
                 "chelem")) %>%
  {if (is_html_output()) mutate(., html = paste0("[html](",id, ".html)")) else .} %>%
{if (is_html_output()) print_table(.) else .}| id | label | html |
|---|---|---|
| CHELEM_2018_PIB_VA_BvD_20180702 | PIB. | [html](CHELEM_2018_PIB_VA_BvD_20180702.html) |
| CHELEM_2018_PIB_VO_BvD_20180702 | PIB Réel | [html](CHELEM_2018_PIB_VO_BvD_20180702.html) |
| bilateral_ER | bilateral_ER | [html](bilateral_ER.html) |
| TRADHIST_EXCHANGE_RATES | TRADHIST_EXCHANGE_RATES | [html](TRADHIST_EXCHANGE_RATES.html) |
| chel202016718_TT | chel202016718_TT | [html](chel202016718_TT.html) |
| chel202016718 | chel202016718 | [html](chel202016718.html) |
| chelem | chelem | [html](chelem.html) |
produits |>
  select(1:4) %>%
{if (is_html_output()) datatable(., filter = 'top', rownames = F) else .}produits |>
select(1:3) %>%
{if (is_html_output()) datatable(., filter = 'top', rownames = F) else .}pays |>
select(1:3) %>%
{if (is_html_output()) datatable(., filter = 'top', rownames = F) else .}Long time series stretch back to 1967, in millions of current dollars.
chel201726716_FRA_DEU |>
  filter(k == "TT") |>
  mutate(date = paste0(t, "-01-01") |> as.Date(),
         value = v / 1000,
         country = i) |>
  ggplot() + theme_minimal() + xlab("") + ylab("") +
  geom_line(aes(x = date, y = value, linetype = country, color = country)) +
  scale_y_continuous(breaks = seq(0, 150, 10)) +
  scale_x_date(breaks = as.Date(paste0(seq(1960, 2020, 5), "-01-01")),
               labels = date_format("%Y")) +
  scale_color_manual(values = viridis(5)[1:4]) +
  theme(legend.title = element_blank(),
        legend.position = c(0.15, 0.80))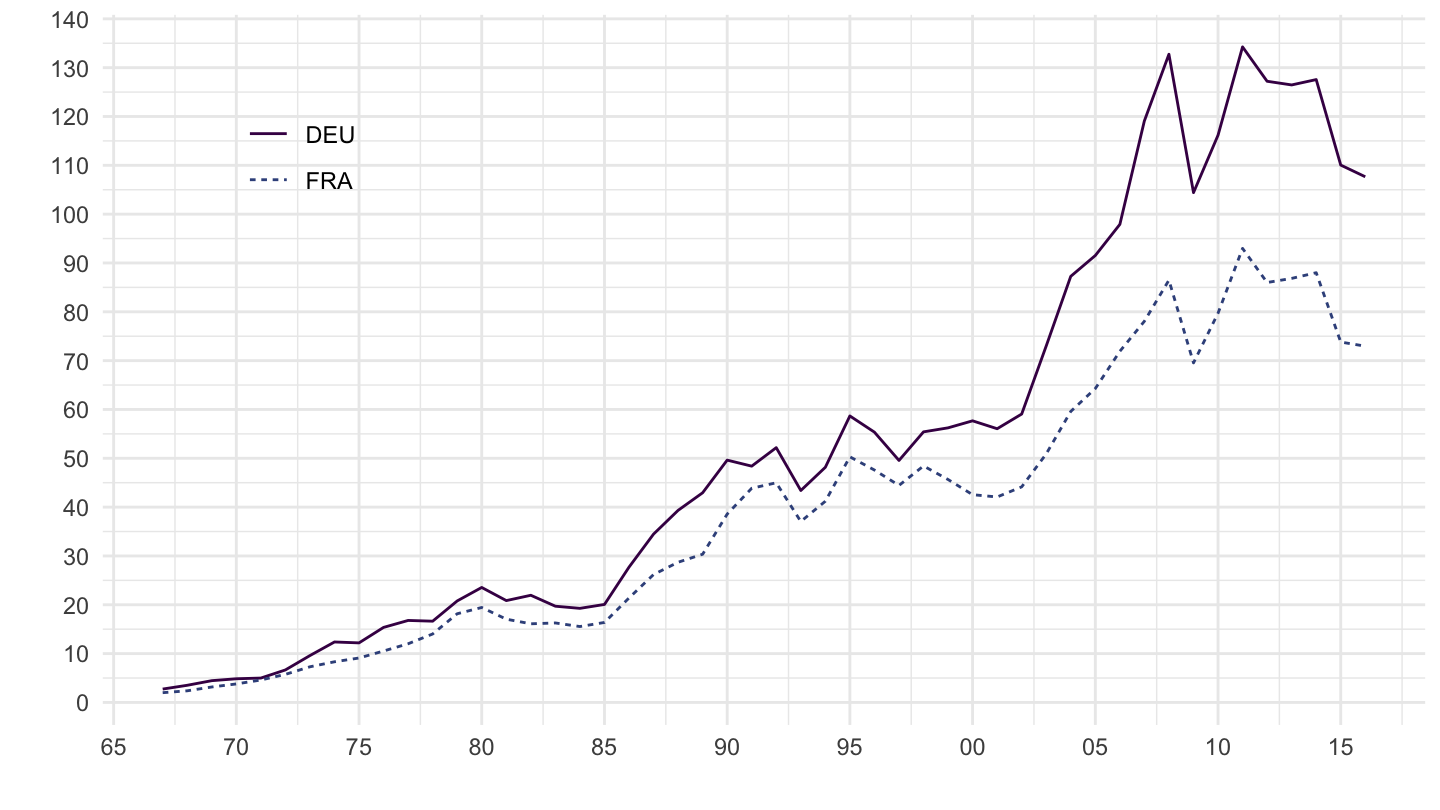
chelem_DEU_X |>
  year_to_date() |>
  filter(partner == "WLD",
         sector %in% c("ST6", "ST1", "ST2", "ST3", "ST4", "ST5")) |>
  left_join(produits |>
              select(2, 3) |>
              setNames(c("sector", "Sector")), by = "sector") |>
  ggplot() + theme_minimal() + xlab("") + ylab("") +
  geom_line(aes(x = date, y = value/1000, linetype = Sector, color = Sector)) +
  scale_y_continuous(breaks = seq(0, 1500, 100)) +
  scale_x_date(breaks = as.Date(paste0(seq(1960, 2020, 5), "-01-01")),
               labels = date_format("%Y")) +
  scale_color_manual(values = viridis(8)[1:7]) +
  theme(legend.title = element_blank(),
        legend.position = c(0.15, 0.80))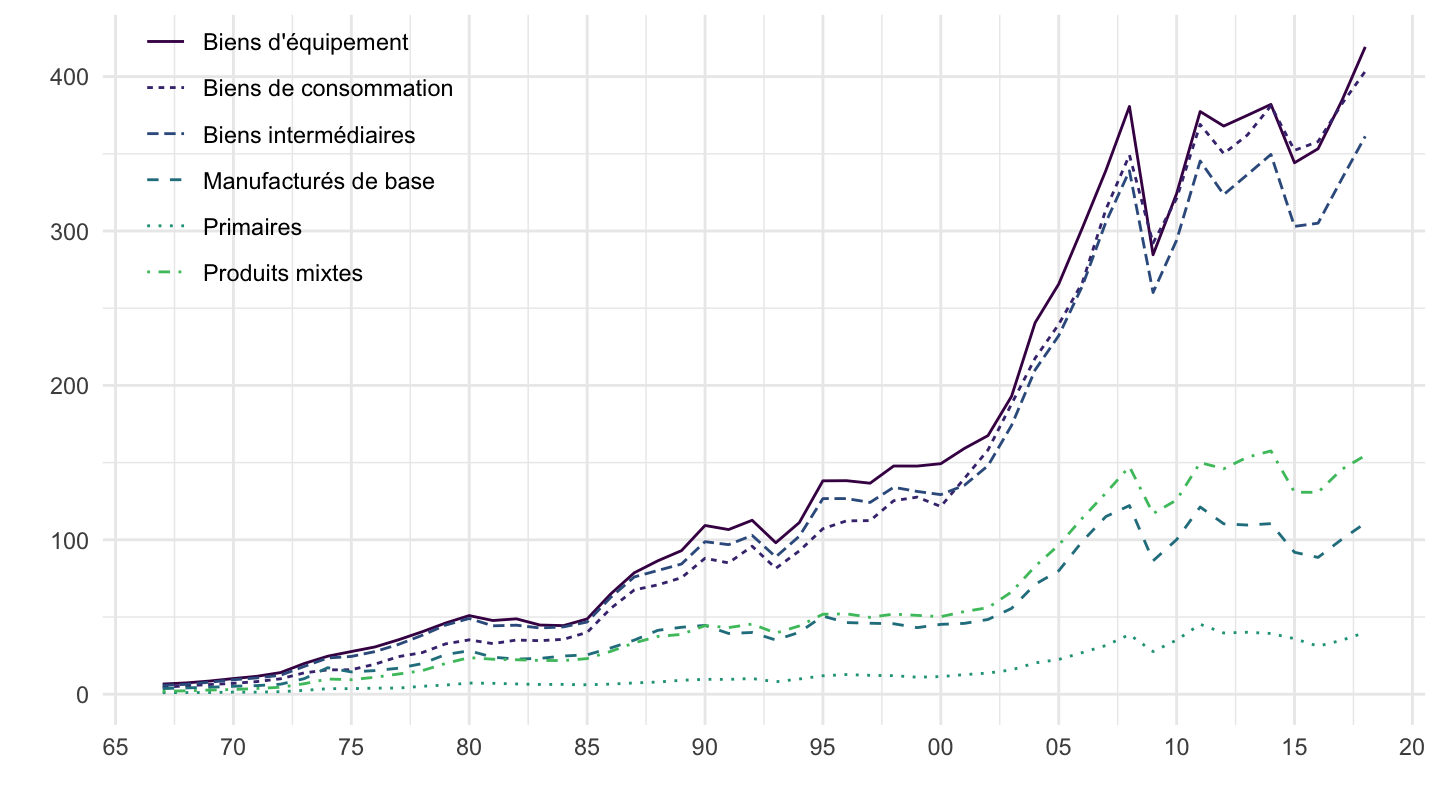
chelem_DEU_X |>
  year_to_date() |>
  filter(partner == "WLD",
         date == as.Date("2016-01-01")) |>
  left_join(produits |>
              select(2, 3) |>
              setNames(c("sector", "Sector")), by = "sector") |>
  select(sector, Sector, value) |>
  arrange(-value) |>
  mutate(value = round(value/1000) |> paste0(" Mds€")) %>%
{if (is_html_output()) datatable(., filter = 'top', rownames = F) else .}chelem_DEU_M |>
year_to_date() |>
filter(partner == "WLD",
sector %in% c("ST6", "ST1", "ST2", "ST3", "ST4", "ST5")) |>
left_join(produits |>
select(2, 3) |>
setNames(c("sector", "Sector")), by = "sector") |>
ggplot() + theme_minimal() + xlab("") + ylab("") +
geom_line(aes(x = date, y = value/1000, linetype = Sector, color = Sector)) +
scale_y_continuous(breaks = seq(0, 1500, 100)) +
scale_x_date(breaks = as.Date(paste0(seq(1960, 2020, 5), "-01-01")),
labels = date_format("%Y")) +
scale_color_manual(values = viridis(8)[1:7]) +
theme(legend.title = element_blank(),
legend.position = c(0.15, 0.80))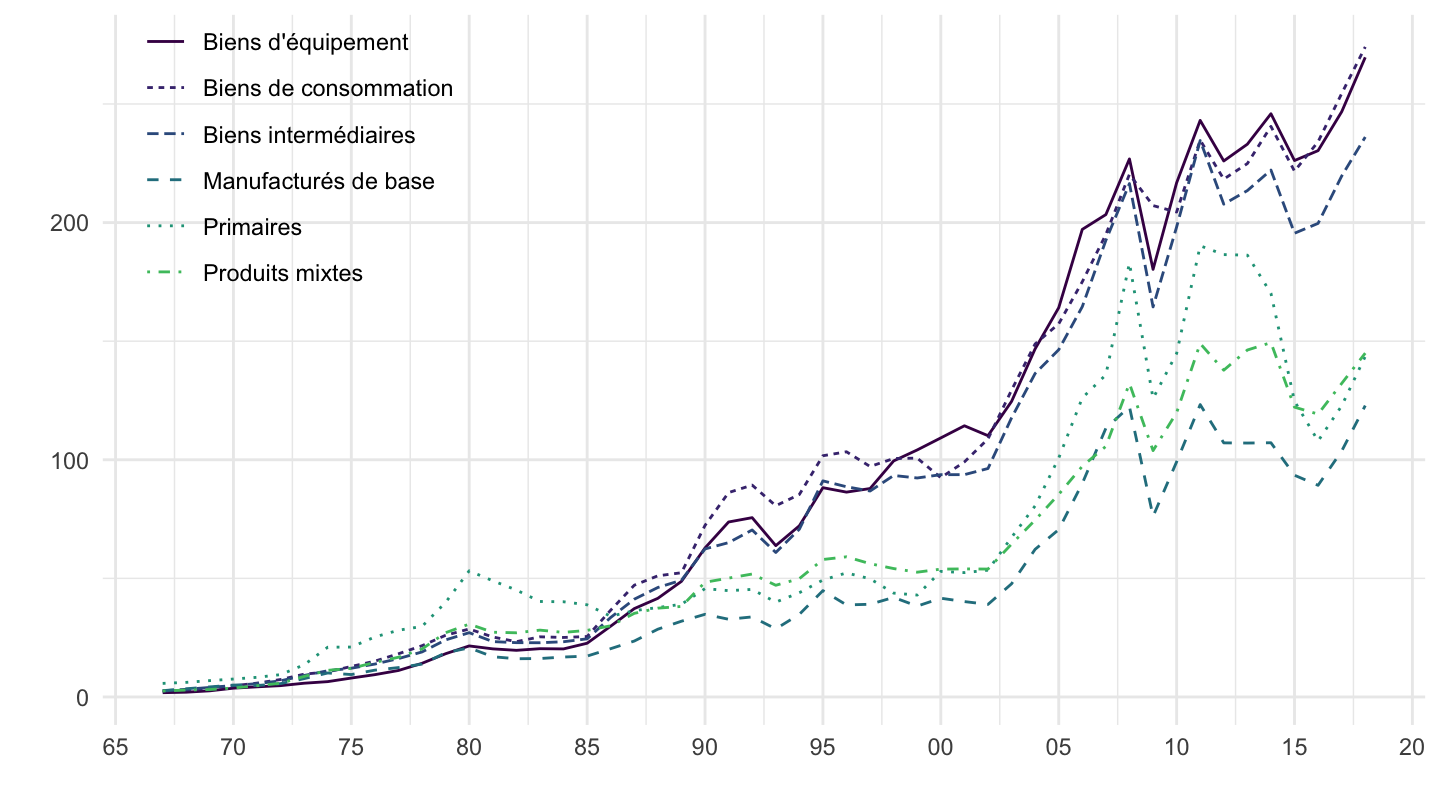
chelem_DEU_M |>
  year_to_date() |>
  filter(partner == "WLD",
         date == as.Date("2016-01-01")) |>
  left_join(produits |>
              select(2, 3) |>
              setNames(c("sector", "Sector")), by = "sector") |>
  select(sector, Sector, value) |>
  arrange(-value) |>
  mutate(value = round(value/1000) |> paste0(" Mds€")) %>%
  {if (is_html_output()) datatable(., filter = 'top', rownames = F) else .}