Trade
Data - Census
Info
LAST_COMPILE
| LAST_COMPILE |
|---|
| 2025-07-28 |
geo
Code
trade %>%
  group_by(CTY_CODE, CTYNAME) %>%
  summarise(Nobs = n()) %>%
  mutate(Flag = gsub(" ", "-", str_to_lower(gsub(" ", "-", CTYNAME))),
         Flag = paste0('<img src="../../icon/flag/vsmall/', Flag, '.png" alt="Flag">')) %>%
  select(Flag, everything()) %>%
  {if (is_html_output()) datatable(., filter = 'top', rownames = F, escape = F) else .}
year
Code
trade %>%
  filter(year == "2024") %>%
  transmute(Geo = CTYNAME,
            IYR, EYR,
            values = (IYR - EYR)/IYR) %>%
  arrange(-IYR) %>%
  print_table_conditional()
2024
World, Seasonally Adjusted
2020-
All
Code
trade %>%
  filter(CTYNAME %in% c("World, Seasonally Adjusted")) %>%
  transmute(Geo = CTYNAME,
            date = as.Date(paste0(year, "-01-01")),
            values = (IYR - EYR)/IYR) %>%
  left_join(colors, by = c("Geo" = "country")) %>%
  ggplot + geom_line(aes(x = date, y = values)) +
  scale_x_date(breaks = seq.Date(as.Date("1970-01-01"), as.Date("2024-01-01"), "1 year"),
               labels = date_format("%Y")) +
  theme_minimal() + xlab("") + ylab("Tariff rate (%)") +
  scale_y_continuous(breaks = 0.01*seq(0, 100, 5),
                     labels = percent_format(a = 1)) +
  theme(legend.position = c(0.25, 0.90),
        legend.title = element_blank(),
        axis.text.x = element_text(angle = 45, vjust = 1, hjust = 1))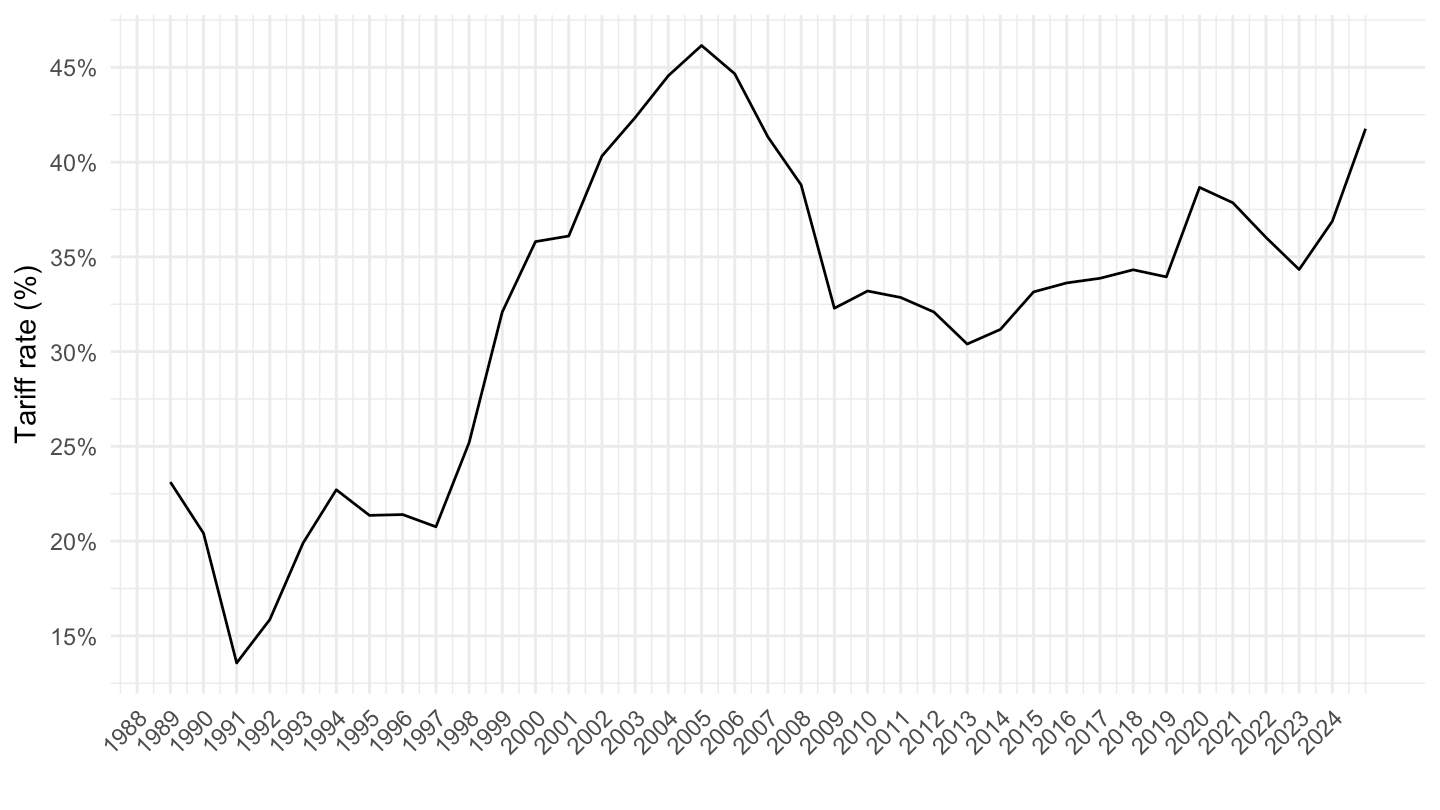
Ireland
2020-
All
Code
trade %>%
  filter(CTYNAME %in% c("Ireland")) %>%
  transmute(Geo = CTYNAME,
            date = as.Date(paste0(year, "-01-01")),
            values = (IYR - EYR)/IYR) %>%
  left_join(colors, by = c("Geo" = "country")) %>%
  ggplot + geom_line(aes(x = date, y = values)) +
  scale_x_date(breaks = seq.Date(as.Date("1970-01-01"), as.Date("2024-01-01"), "1 year"),
               labels = date_format("%Y")) +
  theme_minimal() + xlab("") + ylab("Tariff rate (%)") +
  scale_y_continuous(breaks = 0.01*seq(-100, 100, 5),
                     labels = percent_format(a = 1)) +
  theme(legend.position = c(0.25, 0.90),
        legend.title = element_blank(),
        axis.text.x = element_text(angle = 45, vjust = 1, hjust = 1))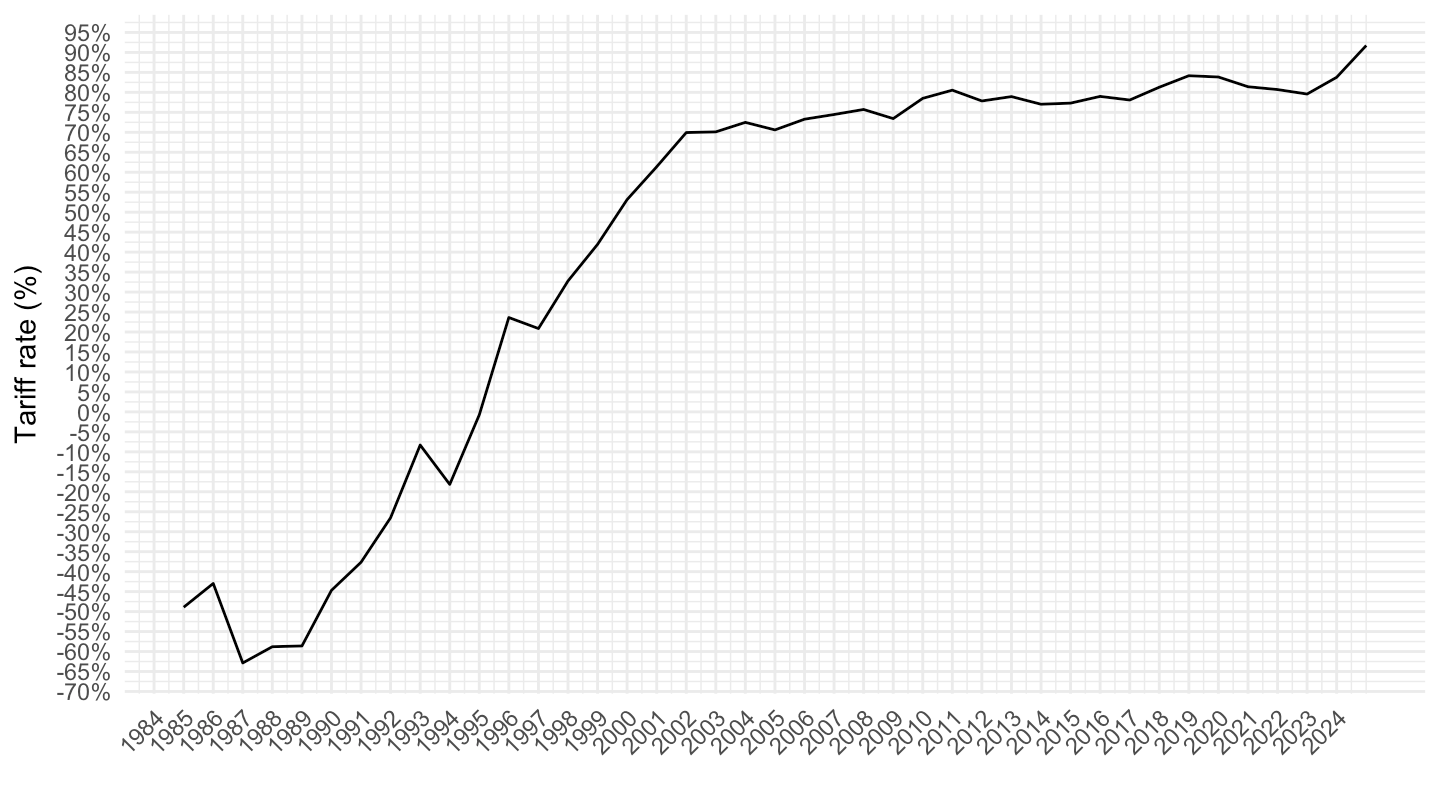
Europe, Germany, France, United Kingdom
2020-
All
Code
trade %>%
  filter(CTYNAME %in% c("European Union", "France", "Germany", "United Kingdom")) %>%
  transmute(Geo = CTYNAME,
            date = as.Date(paste0(year, "-01-01")),
            values = (IYR - EYR)/IYR) %>%
  left_join(colors, by = c("Geo" = "country")) %>%
  filter(date <= as.Date("2024-01-01"),
         date >= as.Date("1997-01-01")) %>%
  ggplot + geom_line(aes(x = date, y = values, color = color)) +
  scale_color_identity() + add_4flags +
  scale_x_date(breaks = seq.Date(as.Date("1970-01-01"), as.Date("2024-01-01"), "1 year"),
               labels = date_format("%Y")) +
  theme_minimal() + xlab("") + ylab("Tariff rate (%)") +
  scale_y_continuous(breaks = 0.01*seq(-100, 100, 5),
                     labels = percent_format(a = 1)) +
  theme(legend.position = c(0.25, 0.90),
        legend.title = element_blank(),
        axis.text.x = element_text(angle = 45, vjust = 1, hjust = 1)) +
  geom_label(data = . %>% filter(date == max(date)),
             aes(x = date, y = values, color = color, label = percent(values)))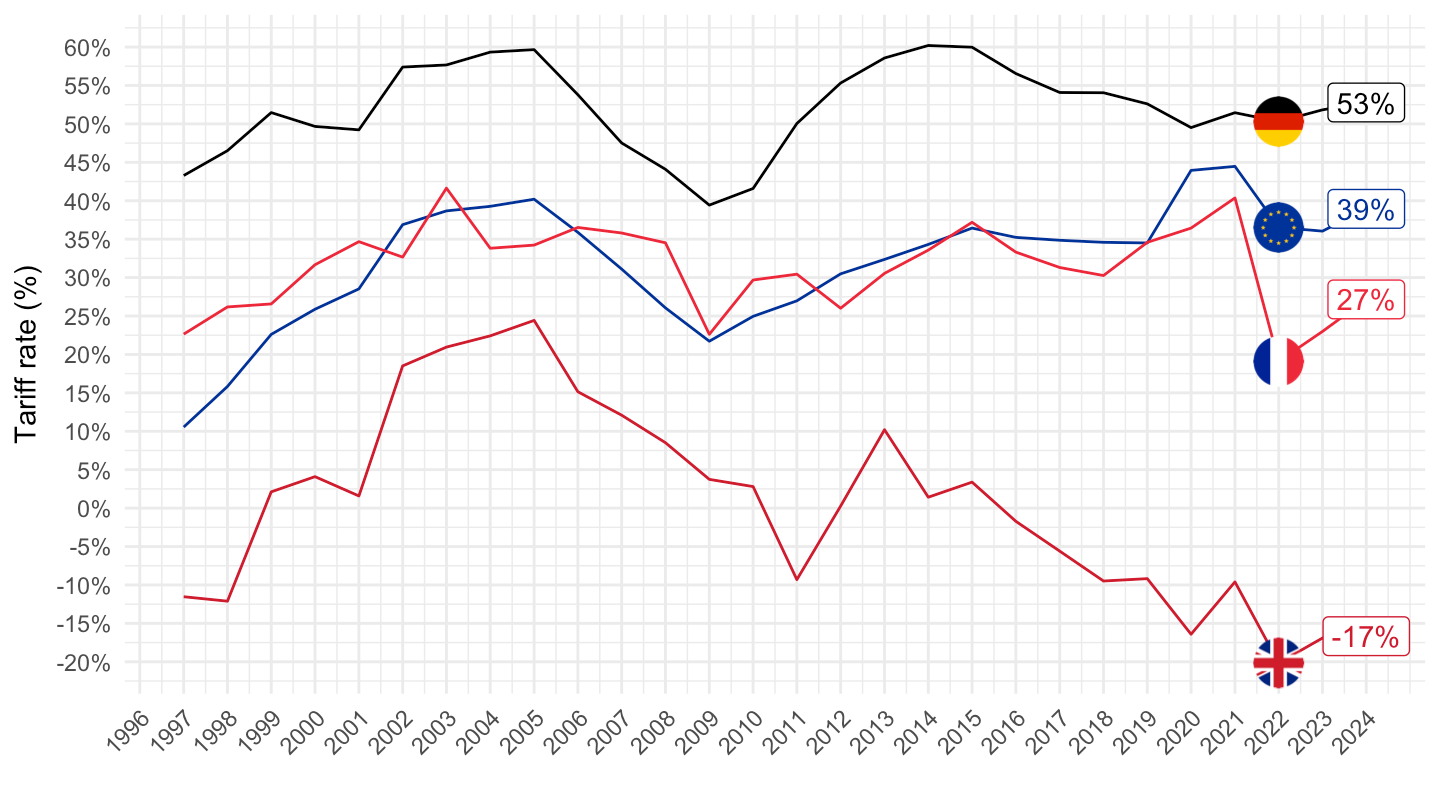
2020-
All
Code
trade %>%
  filter(CTYNAME %in% c("European Union", "France", "Germany", "United Kingdom", "Japan")) %>%
  transmute(Geo = CTYNAME,
            date = as.Date(paste0(year, "-01-01")),
            values = (IYR - EYR)/IYR) %>%
  left_join(colors, by = c("Geo" = "country")) %>%
  filter(date <= as.Date("2024-01-01"),
         date >= as.Date("1997-01-01")) %>%
  ggplot + geom_line(aes(x = date, y = values, color = color)) +
  scale_color_identity() + add_5flags +
  scale_x_date(breaks = seq.Date(as.Date("1970-01-01"), as.Date("2024-01-01"), "1 year"),
               labels = date_format("%Y")) +
  theme_minimal() + xlab("") + ylab("Tariff rate (%)") +
  scale_y_continuous(breaks = 0.01*seq(-100, 100, 5),
                     labels = percent_format(a = 1)) +
  theme(legend.position = c(0.25, 0.90),
        legend.title = element_blank(),
        axis.text.x = element_text(angle = 45, vjust = 1, hjust = 1)) +
  geom_label(data = . %>% filter(date == max(date)),
             aes(x = date, y = values, color = color, label = percent(values)))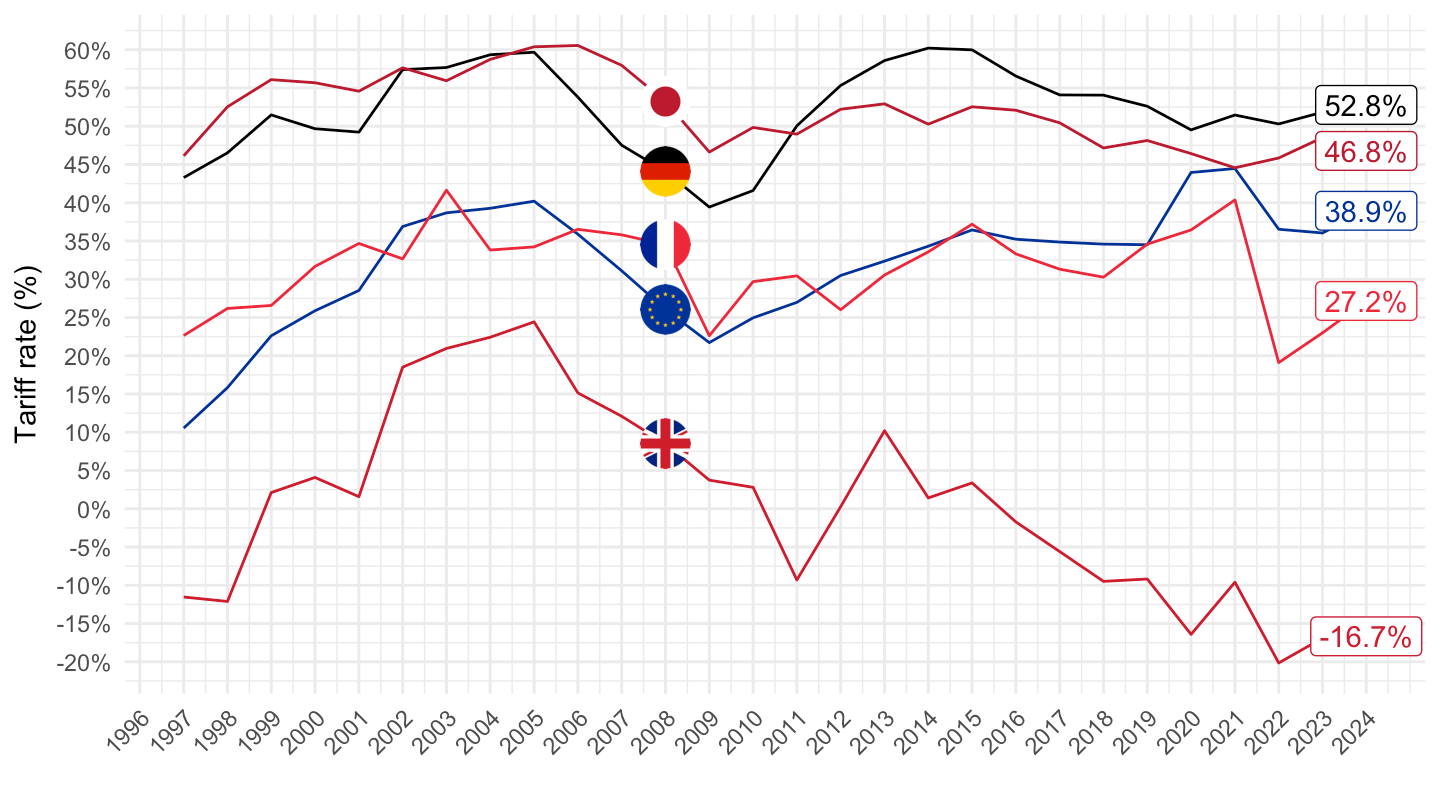
Europe, Germany, France
2020-
All
Code
trade %>%
  filter(CTYNAME %in% c("European Union", "France", "Germany")) %>%
  transmute(Geo = CTYNAME,
            date = as.Date(paste0(year, "-01-01")),
            values = (IYR - EYR)/IYR) %>%
  left_join(colors, by = c("Geo" = "country")) %>%
  filter(date <= as.Date("2024-01-01"),
         date >= as.Date("1997-01-01")) %>%
  ggplot + geom_line(aes(x = date, y = values, color = color)) +
  scale_color_identity() + add_3flags +
  scale_x_date(breaks = seq.Date(as.Date("1970-01-01"), as.Date("2024-01-01"), "1 year"),
               labels = date_format("%Y")) +
  theme_minimal() + xlab("") + ylab("Tariff rate (%)") +
  scale_y_continuous(breaks = 0.01*seq(0, 100, 5),
                     labels = percent_format(a = 1)) +
  theme(legend.position = c(0.25, 0.90),
        legend.title = element_blank(),
        axis.text.x = element_text(angle = 45, vjust = 1, hjust = 1)) +
  geom_label(data = . %>% filter(date == max(date)),
             aes(x = date, y = values, color = color, label = percent(values)))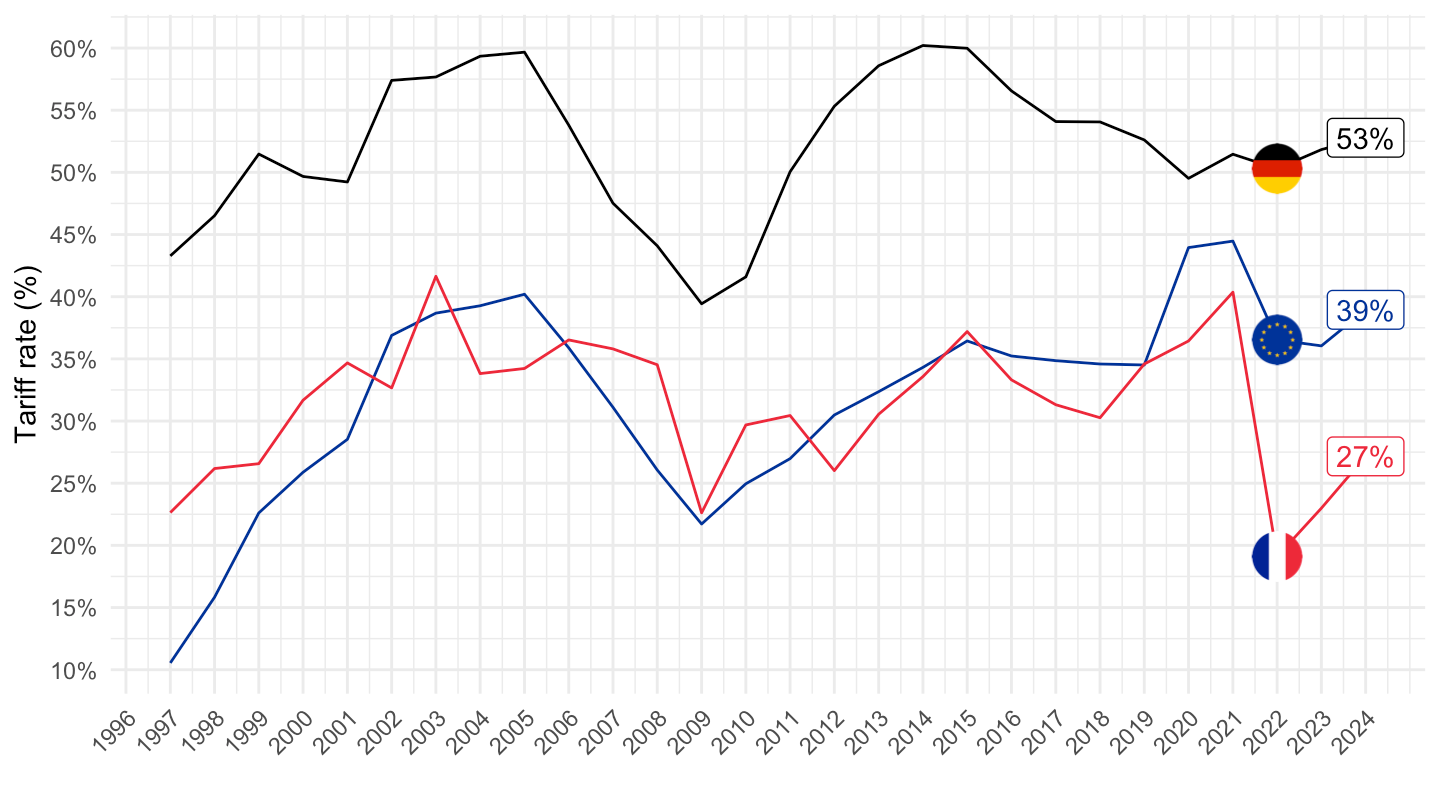
Divisé par 2
Code
trade %>%
  filter(CTYNAME %in% c("European Union", "France", "Germany")) %>%
  transmute(Geo = CTYNAME,
            date = as.Date(paste0(year, "-01-01")),
            values = (IYR - EYR)/IYR/2) %>%
  left_join(colors, by = c("Geo" = "country")) %>%
  filter(date <= as.Date("2024-01-01"),
         date >= as.Date("1997-01-01")) %>%
  ggplot + geom_line(aes(x = date, y = values, color = color)) +
  scale_color_identity() + add_3flags +
  scale_x_date(breaks = seq.Date(as.Date("1970-01-01"), Sys.Date(), "1 year"),
               labels = date_format("%Y")) +
  theme_minimal() + xlab("") + ylab("Tariff rate (%)") +
  scale_y_continuous(breaks = 0.01*seq(0, 100, 2),
                     labels = percent_format(a = 1)) +
  theme(legend.position = c(0.25, 0.90),
        legend.title = element_blank(),
        axis.text.x = element_text(angle = 45, vjust = 1, hjust = 1)) +
  geom_label(data = . %>% filter(date == max(date)),
             aes(x = date, y = values, color = color, label = percent(values)))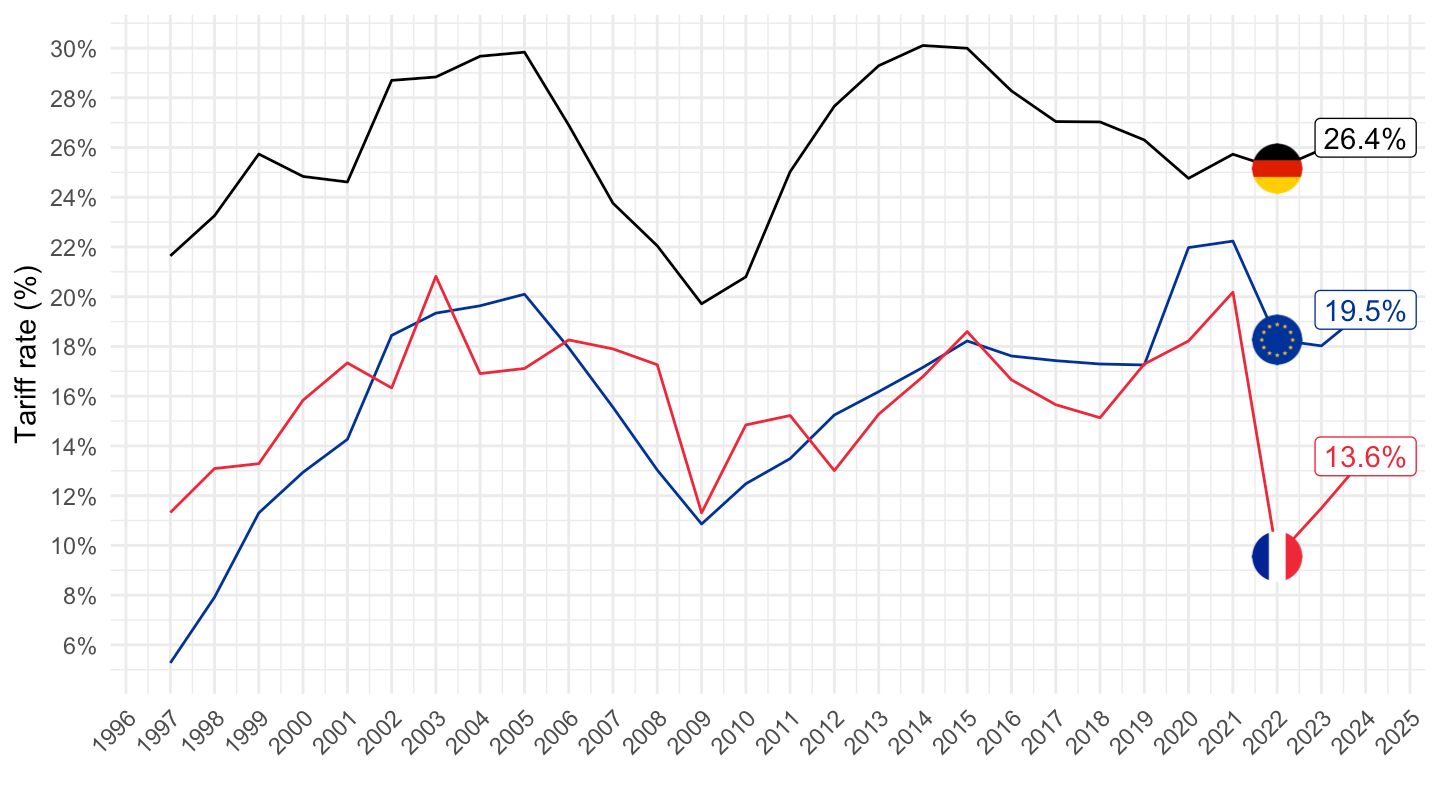
Divisé par 2
Code
trade %>%
  filter(CTYNAME %in% c("European Union", "France", "Germany", "Ireland", "Italy", "Austria")) %>%
  transmute(Geo = CTYNAME,
            date = as.Date(paste0(year, "-01-01")),
            values = (IYR - EYR)/IYR/2) %>%
  left_join(colors, by = c("Geo" = "country")) %>%
  filter(date <= as.Date("2024-01-01"),
         date >= as.Date("1997-01-01")) %>%
  ggplot + geom_line(aes(x = date, y = values, color = color, group = Geo)) +
  scale_color_identity() + add_6flags +
  scale_x_date(breaks = seq.Date(as.Date("1970-01-01"), Sys.Date(), "1 year"),
               labels = date_format("%Y")) +
  theme_minimal() + xlab("") + ylab("Tariff rate (%)") +
  scale_y_continuous(breaks = 0.01*seq(0, 100, 2),
                     labels = percent_format(a = 1)) +
  theme(legend.position = c(0.25, 0.90),
        legend.title = element_blank(),
        axis.text.x = element_text(angle = 45, vjust = 1, hjust = 1)) +
  geom_label(data = . %>% filter(date == max(date)),
             aes(x = date, y = values, color = color, label = percent(values)))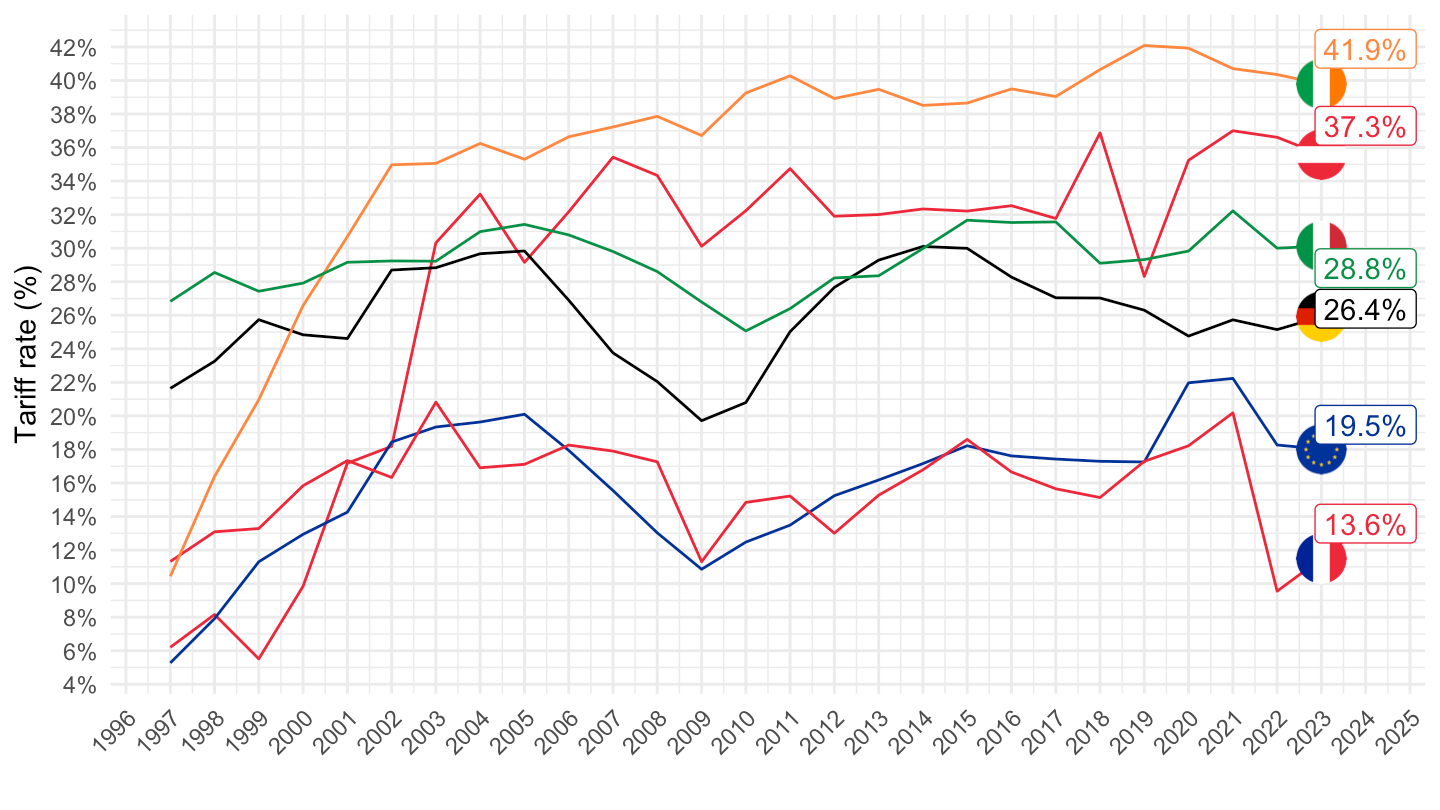
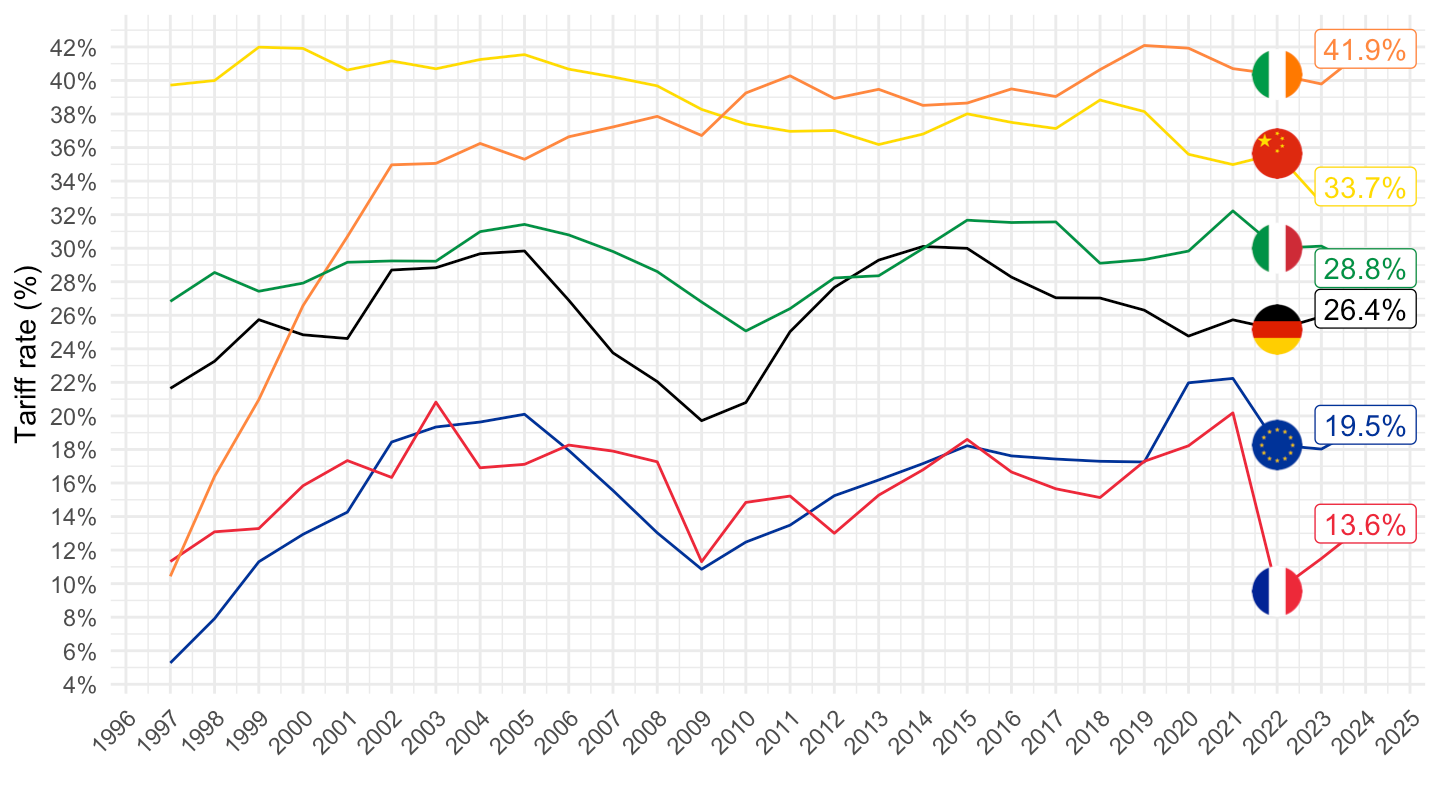
European Union, France, Germany, Italy, Ireland, China
2020-
Divisé par 2
Code
trade %>%
  filter(CTYNAME %in% c("European Union", "France", "Germany", "Italy", "Ireland", "China")) %>%
  transmute(Geo = CTYNAME,
            date = as.Date(paste0(year, "-01-01")),
            values = (IYR - EYR)/IYR/2) %>%
  left_join(colors, by = c("Geo" = "country")) %>%
  filter(date <= as.Date("2024-01-01"),
         date >= as.Date("1997-01-01")) %>%
  ggplot + geom_line(aes(x = date, y = values, color = color, group = Geo)) +
  scale_color_identity() + add_6flags +
  scale_x_date(breaks = seq.Date(as.Date("1970-01-01"), Sys.Date(), "1 year"),
               labels = date_format("%Y")) +
  theme_minimal() + xlab("") + ylab("Tariff rate (%)") +
  scale_y_continuous(breaks = 0.01*seq(0, 100, 2),
                     labels = percent_format(a = 1)) +
  theme(legend.position = c(0.25, 0.90),
        legend.title = element_blank(),
        axis.text.x = element_text(angle = 45, vjust = 1, hjust = 1)) +
  geom_label(data = . %>% filter(date == max(date)),
             aes(x = date, y = values, color = color, label = percent(values)))