Inheritance Flows in France
Using Estate and Gift Tax Data to Measure Long-Term Trends
Motivation
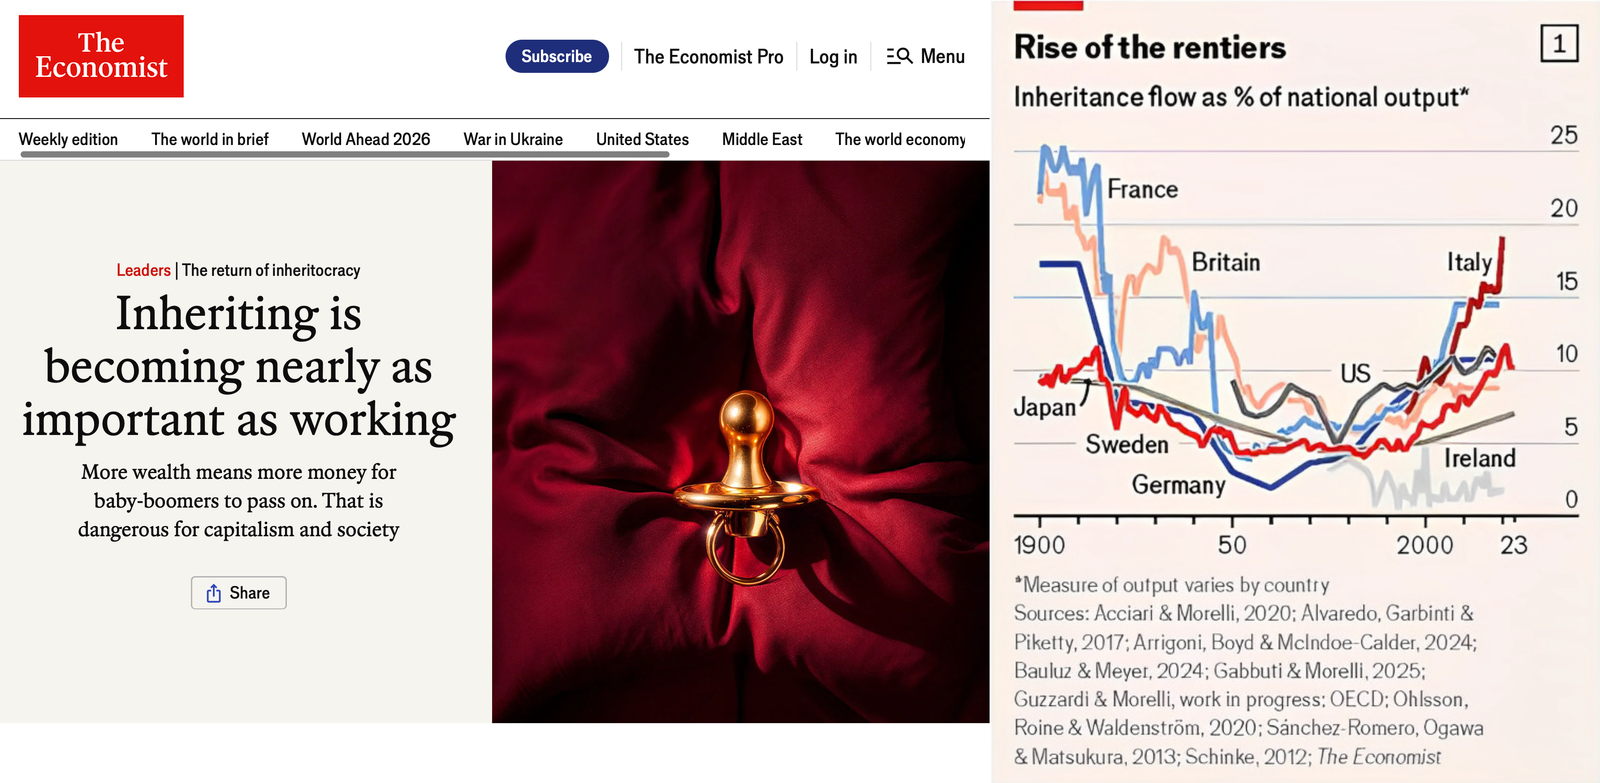
“The return of inheritocracy”
Capital in the 21st century
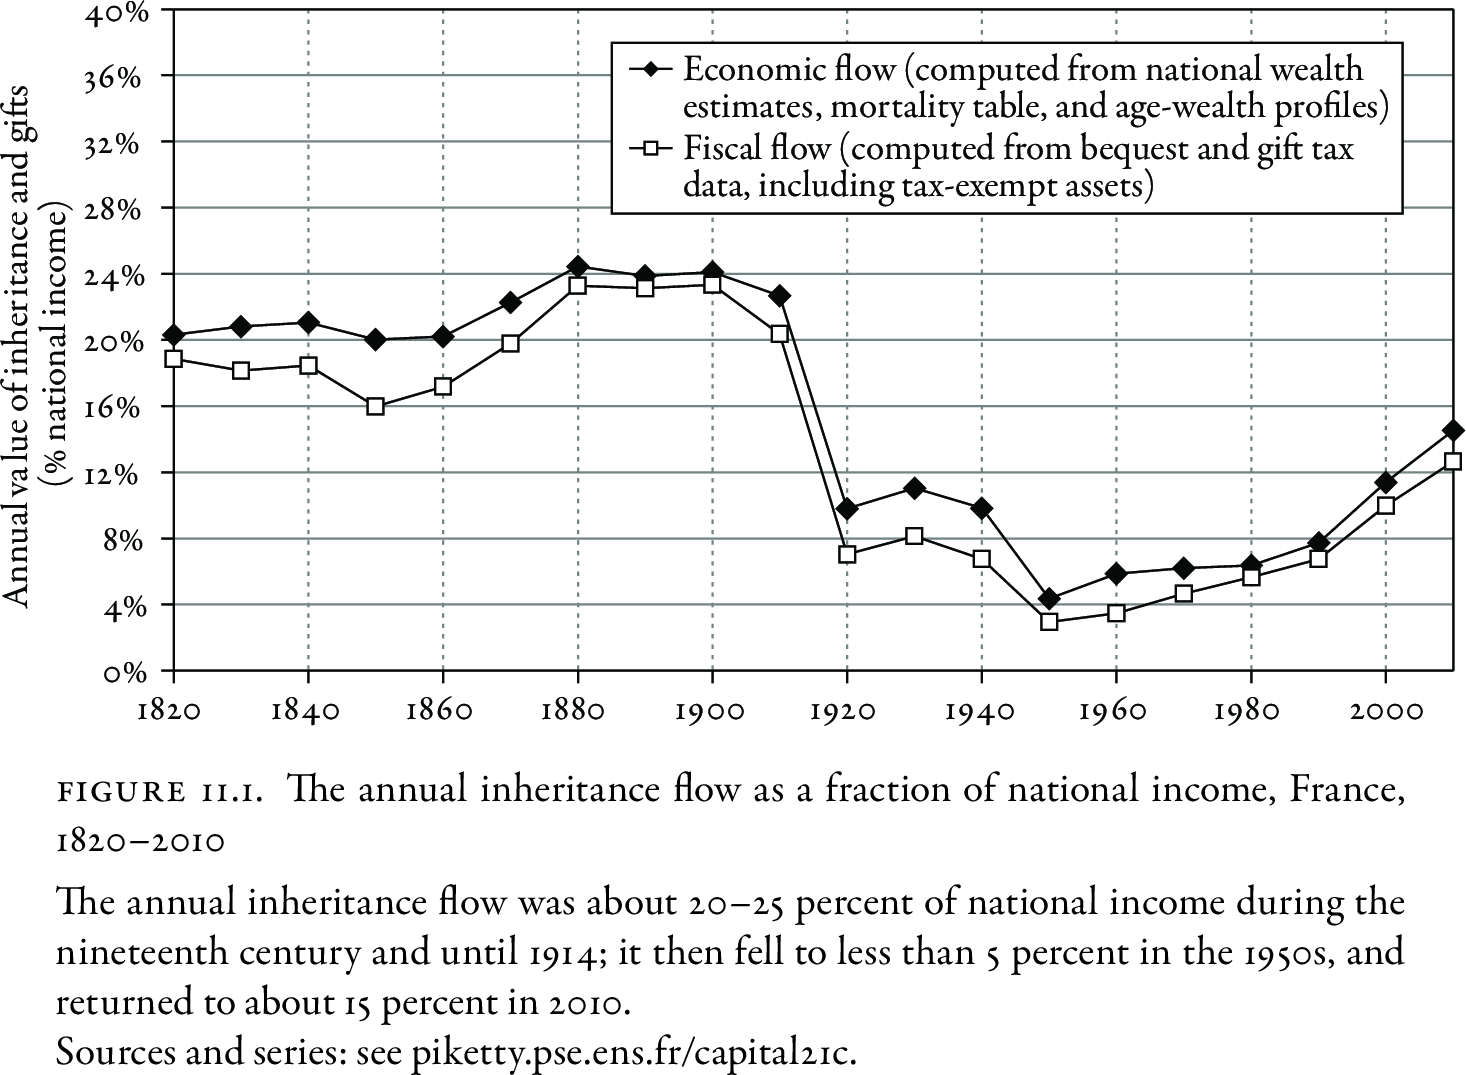
A figure that became a policy benchmark
Piketty (2011): the annual flow of bequests and gifts in France is “close to 15%” of national income in 2008, up from less than 5% in the 1950s.
Used in Capital (Piketty 2014, ch. 11), Piketty and Zucman (2015), and to compute the share of inherited wealth in total wealth (Alvaredo et al. 2017).
Dherbécourt et al. (2021): “more than 15% of GDP, or 300 billion euros”.
Concerns about the return of inherited wealth emphasize the importance of accurately measuring inheritance flows.
This paper
Starts from the published series and replication files of Piketty (2011), reproduced exactly.
Makes each adjustment to raw tax data explicit, and documents its effect step by step.
Proposes alternative assumptions when they can be checked against official sources; sensitivity analysis otherwise.
Approach of Auten and Splinter (2024) for U.S. top income shares: start from seminal tax-based estimates, show each adjustment, let readers combine assumptions.
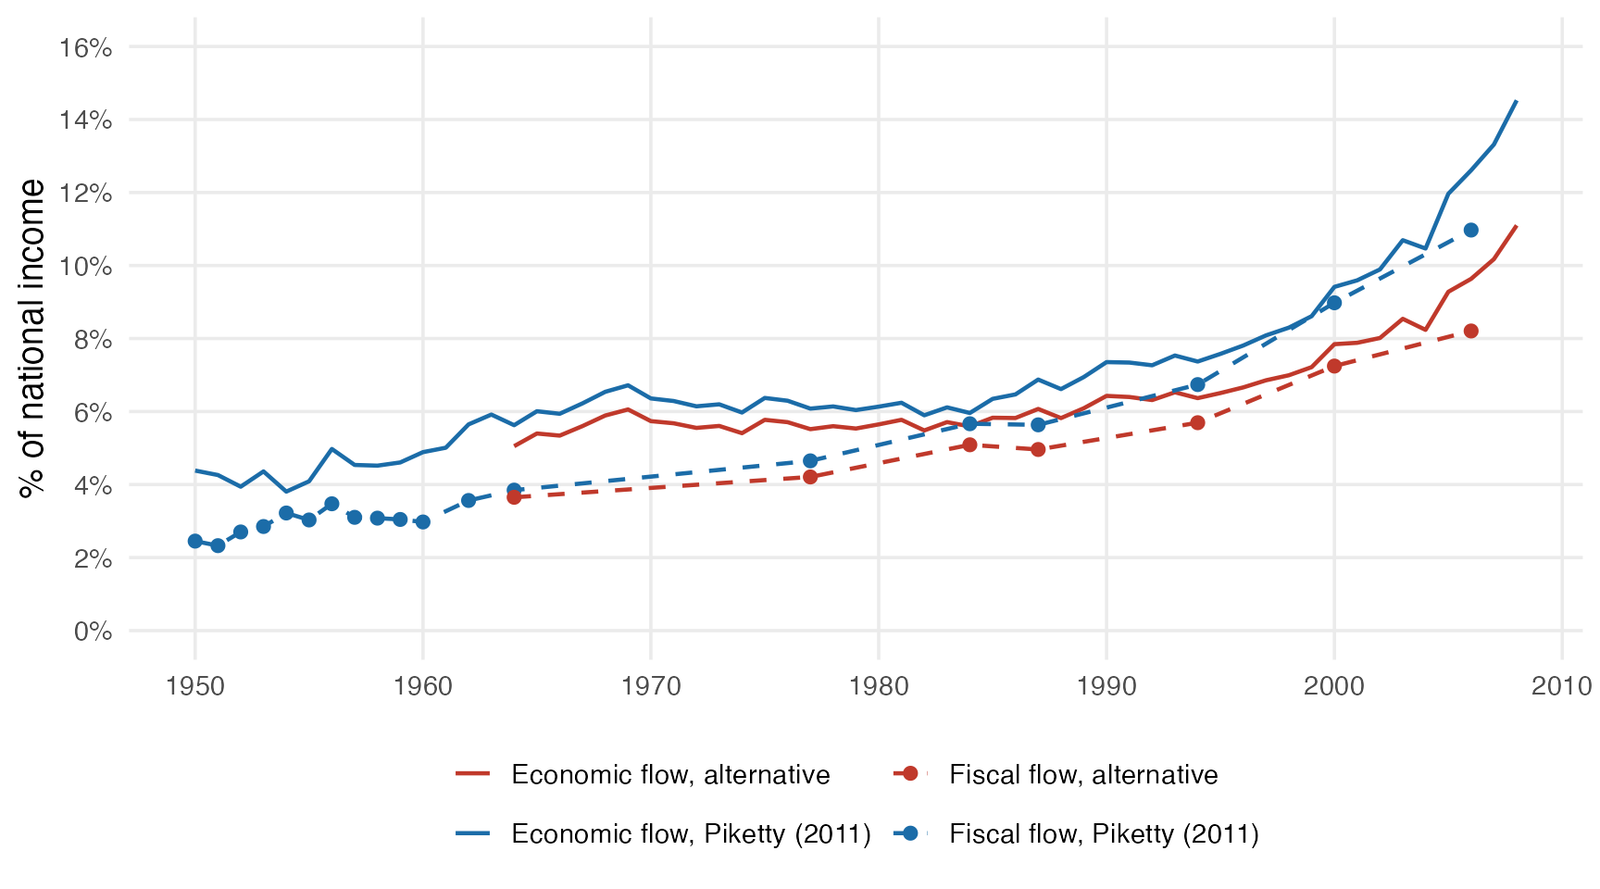
Main result
Main result in numbers
2006 (last year with tax data): fiscal flow 8.2% instead of 11.0%; economic flow 9.6% instead of 12.6% of national income.
2008 (the year usually quoted): economic flow 11.1% instead of 14.5%.
Increase 1984–2006: 3.1 points instead of 5.3 (fiscal), 4.0 instead of 6.6 (economic): about 40% smaller.
The U-shaped pattern and the rise since the 1950s are confirmed.
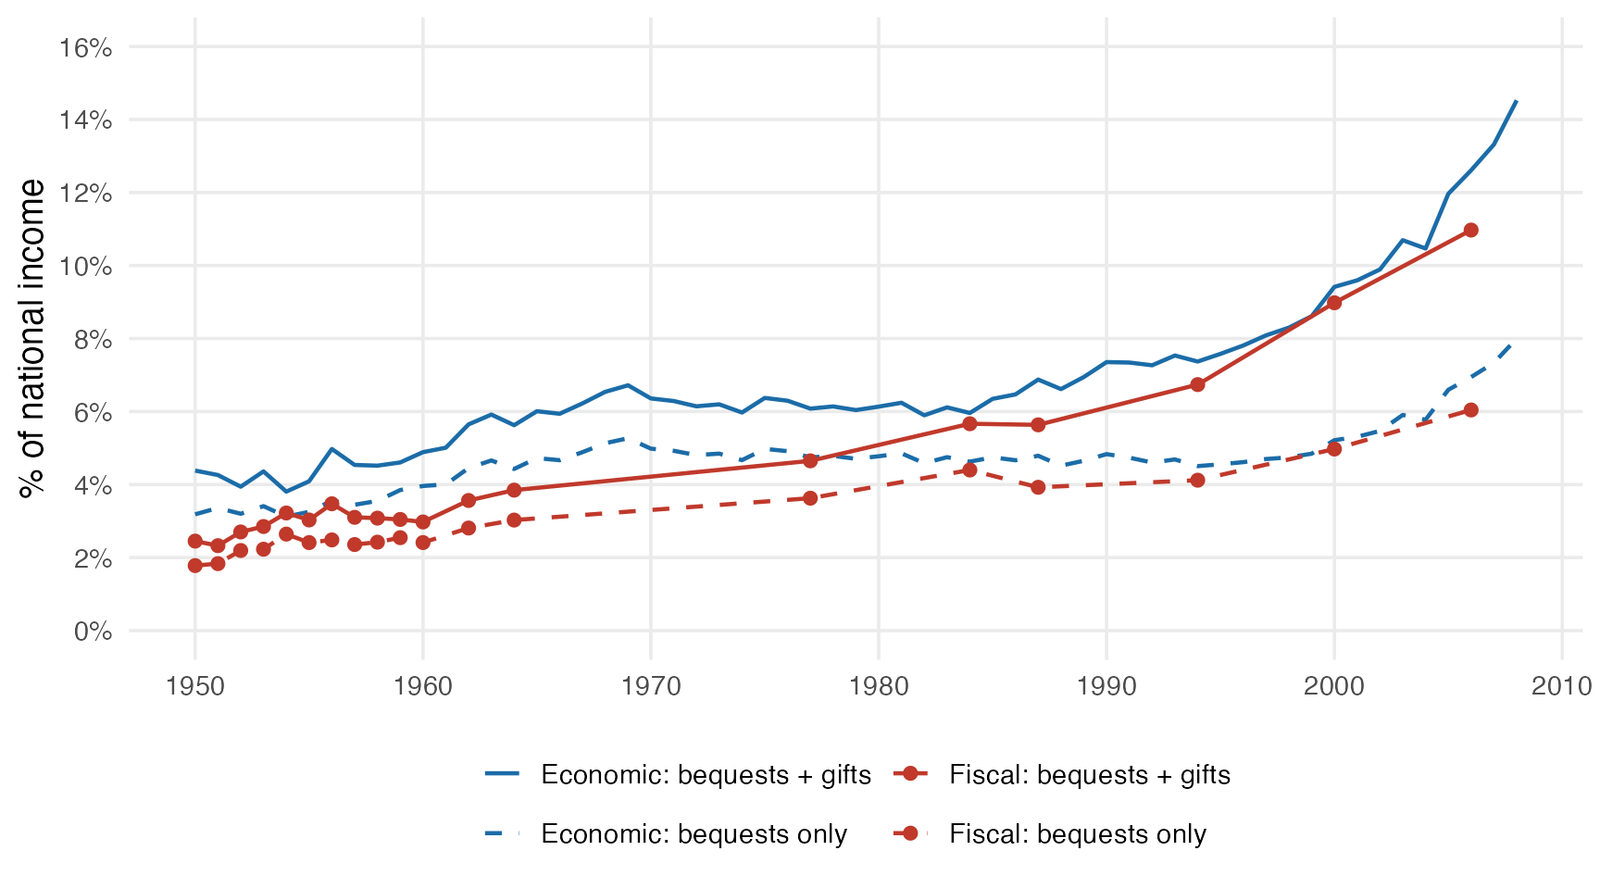
About four-fifths of the difference comes from the treatment of inter vivos gifts.
Measuring the inheritance flow
Two approaches
Fiscal flow: raw bequests and gifts from tax returns, upgraded for non-filers and tax-exempt assets \[ B^f_t = \left(B^{f0}_t + V^{f0}_t\right)\, u^{nf}_t\, u^{te}_t = B^{f0}_t\, u^{nf}_t\, u^{te}_t\, (1+v_t), \qquad v_t = V^{f0}_t / B^{f0}_t \]
Economic flow: national wealth, mortality, relative wealth of decedents \[ \frac{B_t}{Y_t} = \mu_t\,(1+v_t)\; m_t\; \beta_t \]
Described as “two fully independent estimates of the inheritance flow”.
But they share the same gift-bequest ratio \(v_t\), and \(\mu_t\) comes from estate tax returns (age-wealth profiles of decedents).
Bequests only vs. bequests + gifts
French estate tax data: rich in the long run, sparse today
Universal estate tax since 1791: an exceptional historical record (Piketty et al. 2006).
For the recent period, much sparser and harder to interpret:
filing threshold since 1956: returns for about two-thirds of decedents in 2006;
only six benchmark samples (DMTG) of 3,000–5,000 returns: 1977, 1984, 1987, 1994, 2000, 2006;
nothing published since 2006: 2008 and later figures are extrapolations;
gift-bequest ratio observed in a handful of years.
From raw tax data to 11% of national income (2006)
| Component | Bn euros | % nat. income |
|---|---|---|
| Raw bequests (estate tax returns) | 58.9 | 3.7 |
| Raw gifts (gift tax returns) | 48.0 | 3.0 |
| of which 1/3 of 2004-05 cash-gift scheme | 8.6 | 0.5 |
| + Non-filers (bequests + gifts) | 8.4 | 0.5 |
| + Tax-exempt assets, bequests | 31.9 | 2.0 |
| + Tax-exempt assets, gifts | 26.1 | 1.6 |
| Fiscal inheritance flow | 173.3 | 11.0 |
- The adjusted flow is about three times the raw bequest flow.
Gifts
Gift tax reforms and the benchmark years
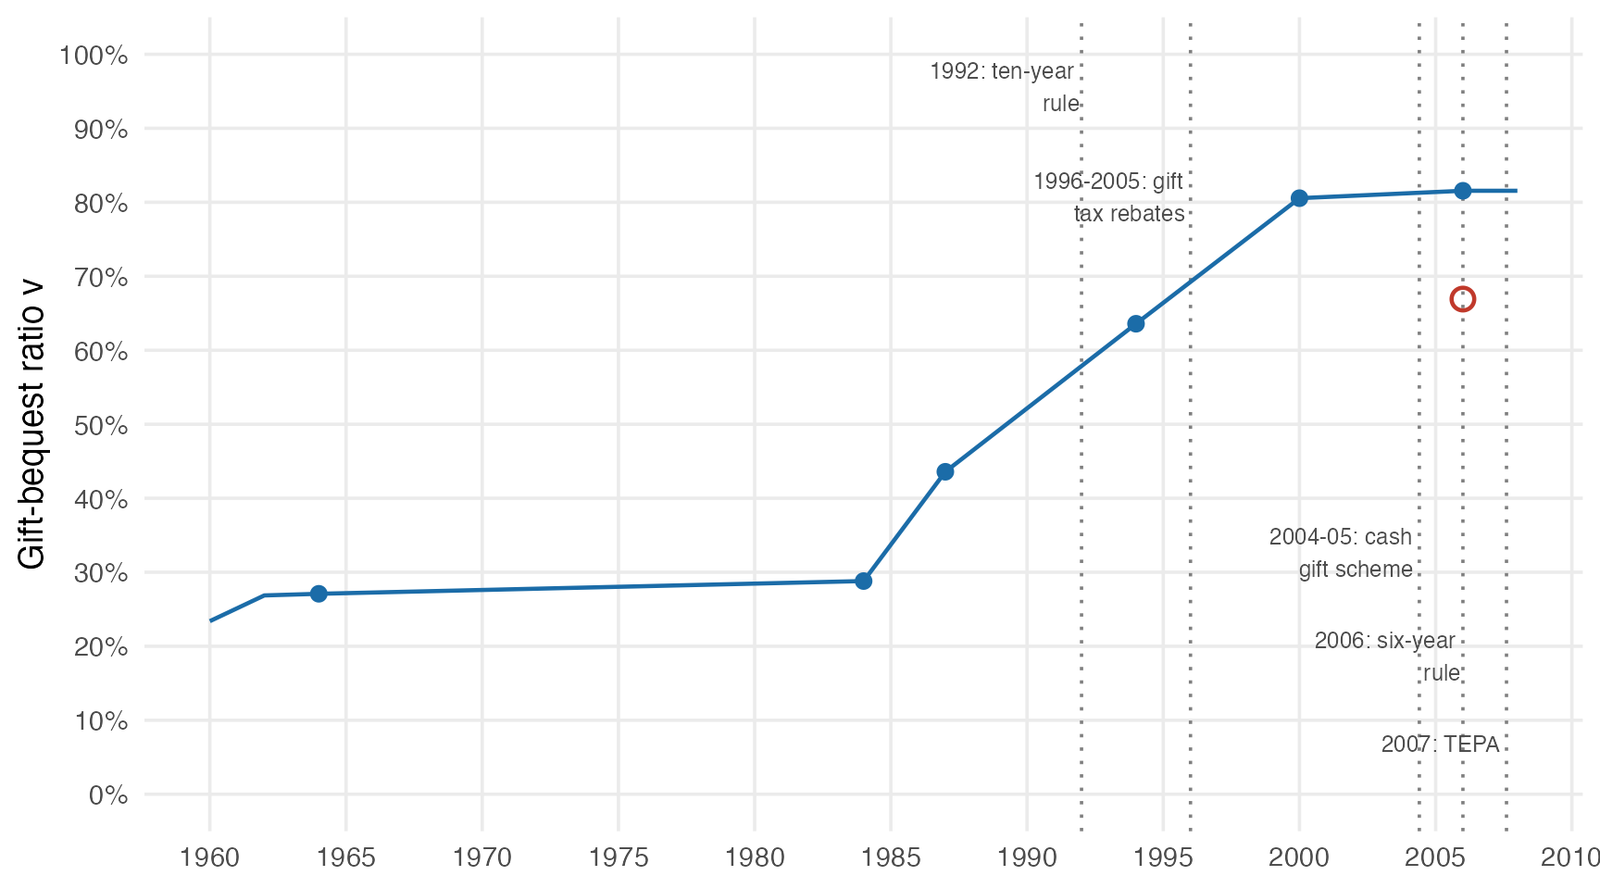
Main reforms
| Period | Measure |
|---|---|
| 1992 | “Ten-year rule”: gifts made more than ten years before are no longer recalled |
| 1996–2005 | Rebates on gift tax (30% in 1998–2001, 50% in 2003–2005) |
| June 2004–Dec. 2005 | Temporary exemption of cash gifts: €25.8bn in 18 months |
| 2006 | Recall period reduced from ten to six years |
| 2007 | TEPA law: higher allowances, permanent exemption for family cash gifts |
| 2011–2012 | Recall period back to ten, then fifteen years |
- Benchmark years 1994, 2000 and 2006 all fall in periods of new or temporary incentives.
(1) The 2006 benchmark
Gift flow for 2006 = regular gifts (€39.4bn) + “the average yearly 2004–2006 flow under the special cash-gifts regime (8.6 billions)”.
But the scheme ran from 1 June 2004 to 31 December 2005 (Conseil des prélèvements obligatoires 2008): no such gifts in 2006.
Through the constant \(v_t\), this flow is propagated to 2007 and 2008.
Excluding it: \(v_{2006}\) = 67% instead of 82% (as noted in the data appendix of Piketty (2010)).
Effect: fiscal flow 11.0% → 10.1%; economic flow 12.6% → 11.6%.
Gifts as anticipated bequests
Tax incentives bring transfers forward: gifts rise now, bequests fall only later.
During the transition, gifts + bequests exceed their steady-state level.
Piketty (2010) recognizes “a little bit of overshooting in the rise of gifts since the 1980s (possibly due to tax incentives)”.
The data cannot separate tax incentives from longer life expectancy: \(v_t\) is only observed in years when incentives were in place.
Not corrected in the alternative estimates; bound in the sensitivity analysis (\(v\) held at its 1987 level).
(2) Upgrading recorded gifts
Recorded gifts receive the same upgrade for tax-exempt assets as bequests (+€26.1bn in 2006).
But the main exempt asset, life insurance, is transmitted at death, not through gifts; gifts of real estate and donations-partages are recorded at full value in notarial deeds.
Same issue in the economic flow: gifts = \(v_t \times\) economic bequests, i.e. recorded gifts implicitly multiplied by 1.86 in 2006.
Alternative: recorded gifts with the non-filer upgrade only.
Effect: fiscal 10.1% → 8.7%; economic 11.6% → 9.6%.
Bequests
Imputed tax-exempt assets
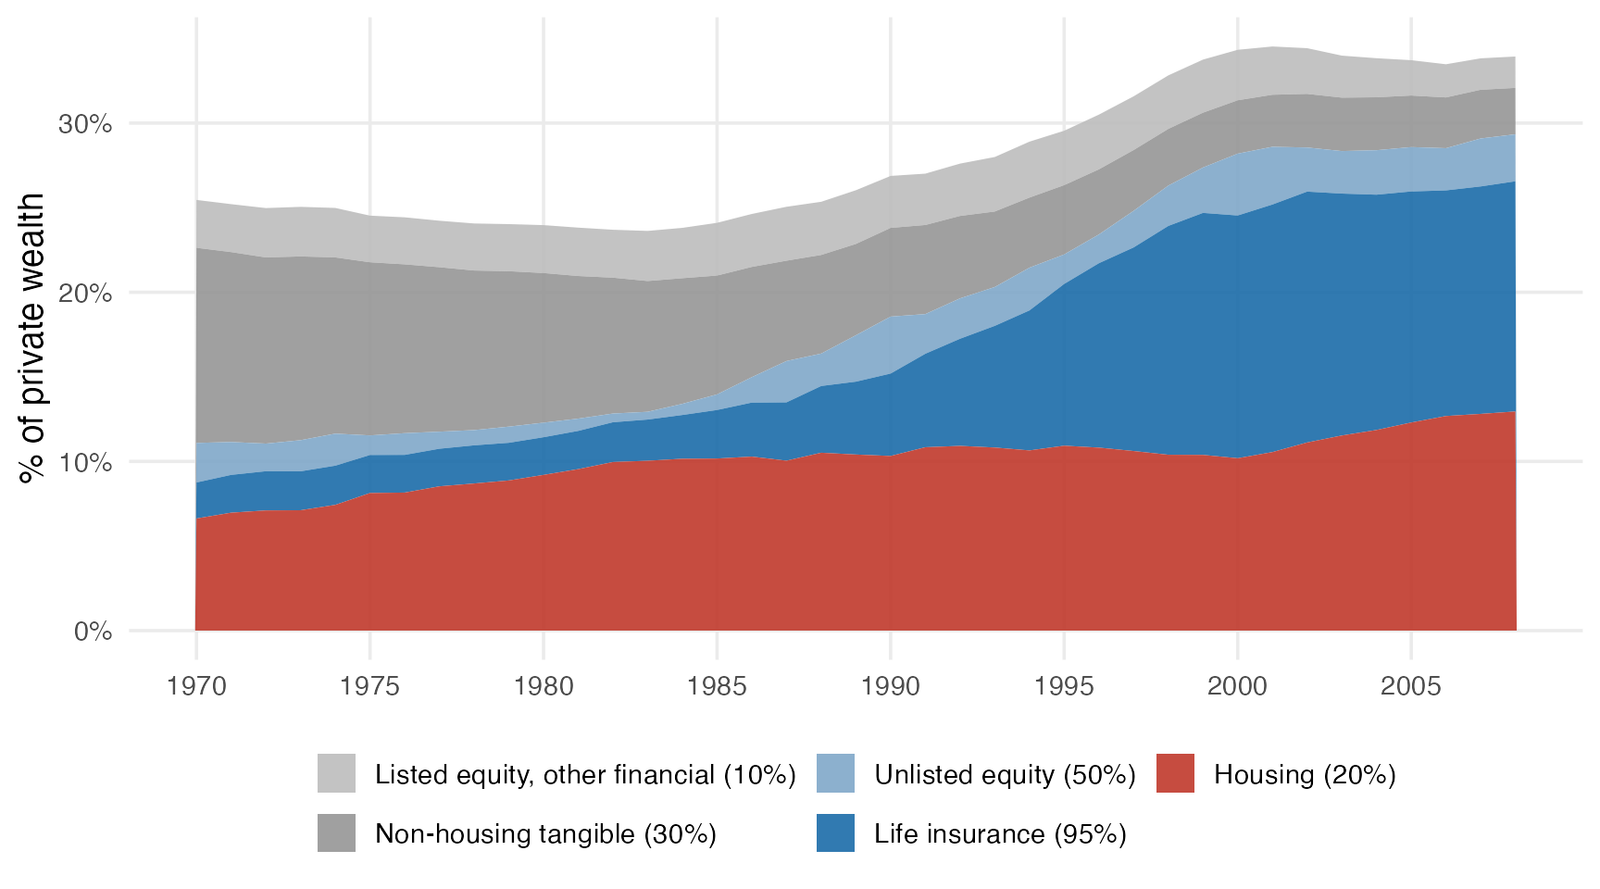
(3) Tax-exempt assets, non-filers, spouses
Housing (20% exempt): the 20% rebate on the principal residence (art. 764 bis CGI) applies only if the home is occupied by the surviving spouse or minor/protected children; the 1947–1973 construction exemption faded. Alternative: 10%.
Life insurance (95% exempt): implies about €13bn transmitted in 2006, vs. €31–33bn of death benefits in 2011–2014 (Conseil supérieur du notariat 2026): if anything too low. Unchanged.
Non-filers: factor 1.079 vs. 1.052 in Conseil des prélèvements obligatoires (2008). Small.
Spouses: 17.9% of bequests in 2006 (Conseil des prélèvements obligatoires 2008), vs. “about 10%”; not intergenerational transfers. Sensitivity only.
Results
The economic flow, 1984–2008
| Factor | 1984 | 2008 | Log points |
|---|---|---|---|
| Wealth-income ratio β | 3.02 | 5.63 | 62 |
| Gift factor 1 + v | 1.288 | 1.816 | 34 |
| Relative wealth of decedents μ | 1.121 | 1.226 | 9 |
| Mortality rate m | 1.37% | 1.16% | -16 |
| Economic flow | 6.0% | 14.5% | 89 |
- The wealth-income ratio (house prices) and the gift factor account for the rise; 2008 is the peak of the housing cycle.
Step-by-step adjustments (% of national income)
| Estimate | 1984 | 1994 | 2000 | 2006 | Δ 1984-2006 |
|---|---|---|---|---|---|
| Fiscal: Piketty (2011) | 5.7 | 6.7 | 9.0 | 11.0 | 5.3 |
| (1) Excl. 2004-05 cash gifts | 5.7 | 6.7 | 9.0 | 10.1 | 4.4 |
| (2) + No exempt-asset upgrade on gifts | 5.4 | 6.0 | 7.6 | 8.7 | 3.4 |
| (3) + Housing exemption 10% | 5.1 | 5.7 | 7.2 | 8.2 | 3.1 |
| Economic: Piketty (2011) | 6.0 | 7.4 | 9.4 | 12.6 | 6.6 |
| (1) Excl. 2004-05 cash gifts | 6.0 | 7.4 | 9.4 | 11.6 | 5.6 |
| (2)-(3) Recorded gifts | 5.6 | 6.4 | 7.8 | 9.6 | 4.0 |
Sensitivity analysis (% of national income, 2006)
| Assumption | Fiscal 2006 | Δ fiscal | Economic 2006 | Δ economic |
|---|---|---|---|---|
| Piketty (2011) | 11.0 | 5.3 | 12.6 | 6.6 |
| Alternative | 8.2 | 3.1 | 9.6 | 4.0 |
| Housing exemption 5% | 8.0 | 3.0 | 9.6 | 4.0 |
| Housing exemption 20% | 8.7 | 3.4 | 9.6 | 4.0 |
| Incl. 2004-05 cash gifts | 8.8 | 3.7 | 10.2 | 4.6 |
| v held at 1987 level | 7.3 | 2.2 | 8.7 | 3.1 |
| Excl. spouses (10%) | 7.7 | 3.0 | 8.9 | 3.8 |
- Across assumptions: about 7–10% of national income in 2006, vs. 11–13%.
Comparison with other sources
1977: Laferrère (1990) implies \(v\) = 49% (vs. 28% interpolated): higher 1970s level, smaller increase.
Bequests in the 2010s: €153bn in 2015 (Dherbécourt 2017); wealth at death €159bn in 2018 (Insee survey-based microsimulation, Cour des comptes (2024); Conseil supérieur du notariat (2026)).
The bequest component is consistent across sources; totals of €300–400bn come from adding gifts and other components.
Other countries (Germany, Italy) use the same framework: not independent checks.
Conclusion
Conclusion
Adjustments roughly triple raw reported bequests; they determine the level and much of the trend.
Alternative estimates: 8–10% of national income in 2006 rather than 11–13%; increase since the mid-1980s about 40% smaller.
Most of the difference comes from gifts: benchmark years coinciding with temporary tax incentives, and the same upgrades as bequests.
No benchmark data since 2006: annual statistics on bequests and gifts from notaries’ and insurers’ declarations (Dherbécourt et al. 2021) would settle these questions with data rather than assumptions.
References
Auten, Gerald, and David Splinter. 2024. “Income Inequality in the United States: Using Tax Data to Measure Long-Term Trends.” Journal of Political Economy 132 (7). https://doi.org/10.1086/728741.
Conseil des prélèvements obligatoires. 2008. La répartition des prélèvements obligatoires entre générations et la question de l’équité intergénérationnelle. Cour des comptes.
Conseil supérieur du notariat. 2026. Étude « Grande transmission ». Conseil supérieur du notariat.
Cour des comptes. 2024. Les droits de succession. Cour des comptes.
Dherbécourt, Clément. 2017. Peut-on éviter une société d’héritiers ? Note d'analyse No. 51. France Stratégie.
Dherbécourt, Clément, Gabrielle Fack, Camille Landais, and Stefanie Stantcheva. 2021. Repenser l’héritage. Les notes du conseil d'analyse économique No. 69. Conseil d’analyse économique.
Laferrère, Anne. 1990. Successions et héritiers. INSEE.
Piketty, Thomas. 2010. On the Long-Run Evolution of Inheritance: France 1820–2050. Working Paper. Paris School of Economics.
Piketty, Thomas. 2011. “On the Long-Run Evolution of Inheritance: France 1820–2050.” The Quarterly Journal of Economics 126 (3): 1071–131. https://doi.org/10.1093/qje/qjr020.
Piketty, Thomas. 2014. Capital in the Twenty-First Century. Harvard University Press.
Piketty, Thomas, Gilles Postel-Vinay, and Jean-Laurent Rosenthal. 2006. “Wealth Concentration in a Developing Economy: Paris and France, 1807–1994.” American Economic Review 96 (1): 236–56.
Piketty, Thomas, and Gabriel Zucman. 2015. “Wealth and Inheritance in the Long Run.” In Handbook of Income Distribution, edited by Anthony B. Atkinson and François Bourguignon, vol. 2. Elsevier. https://doi.org/10.1016/B978-0-444-59429-7.00016-9.