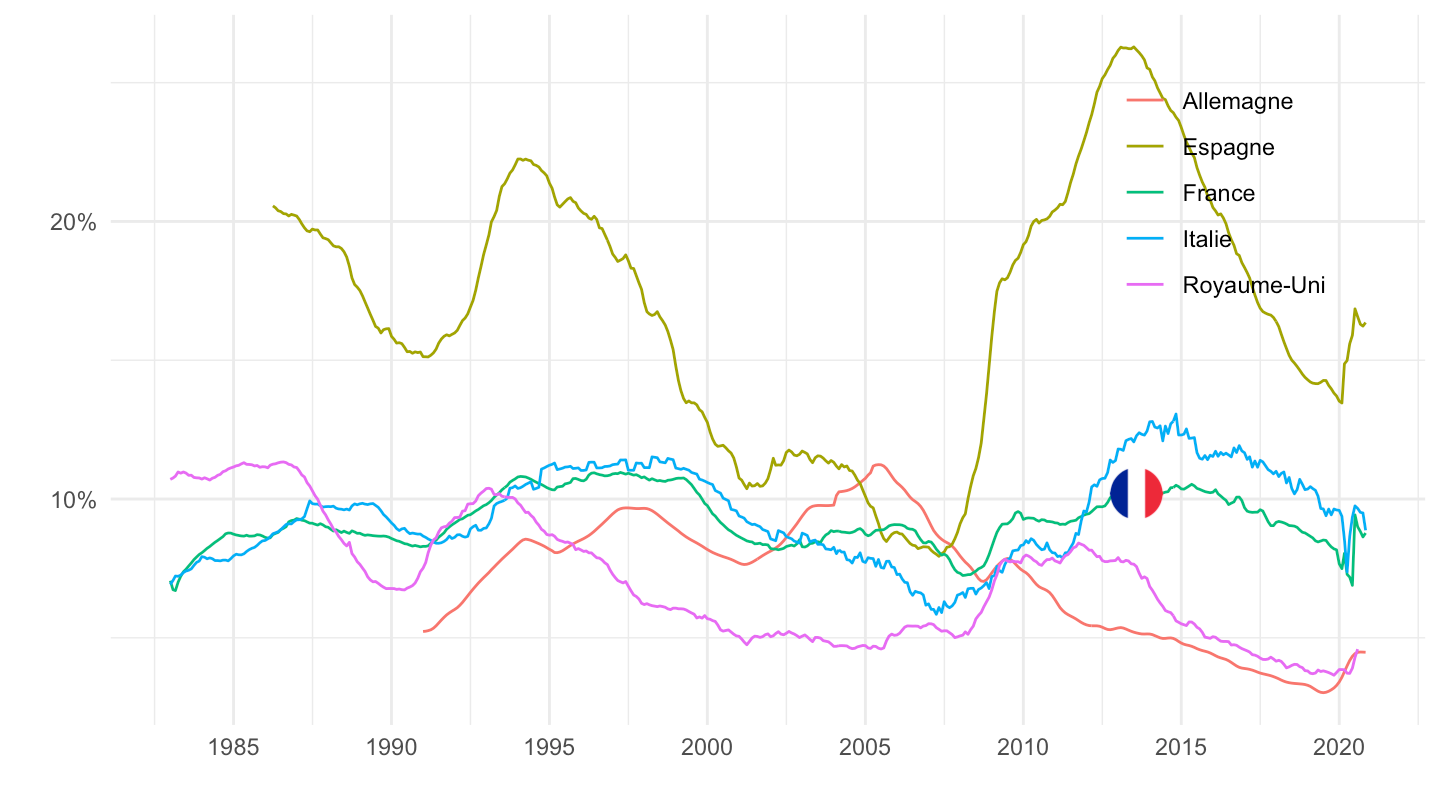
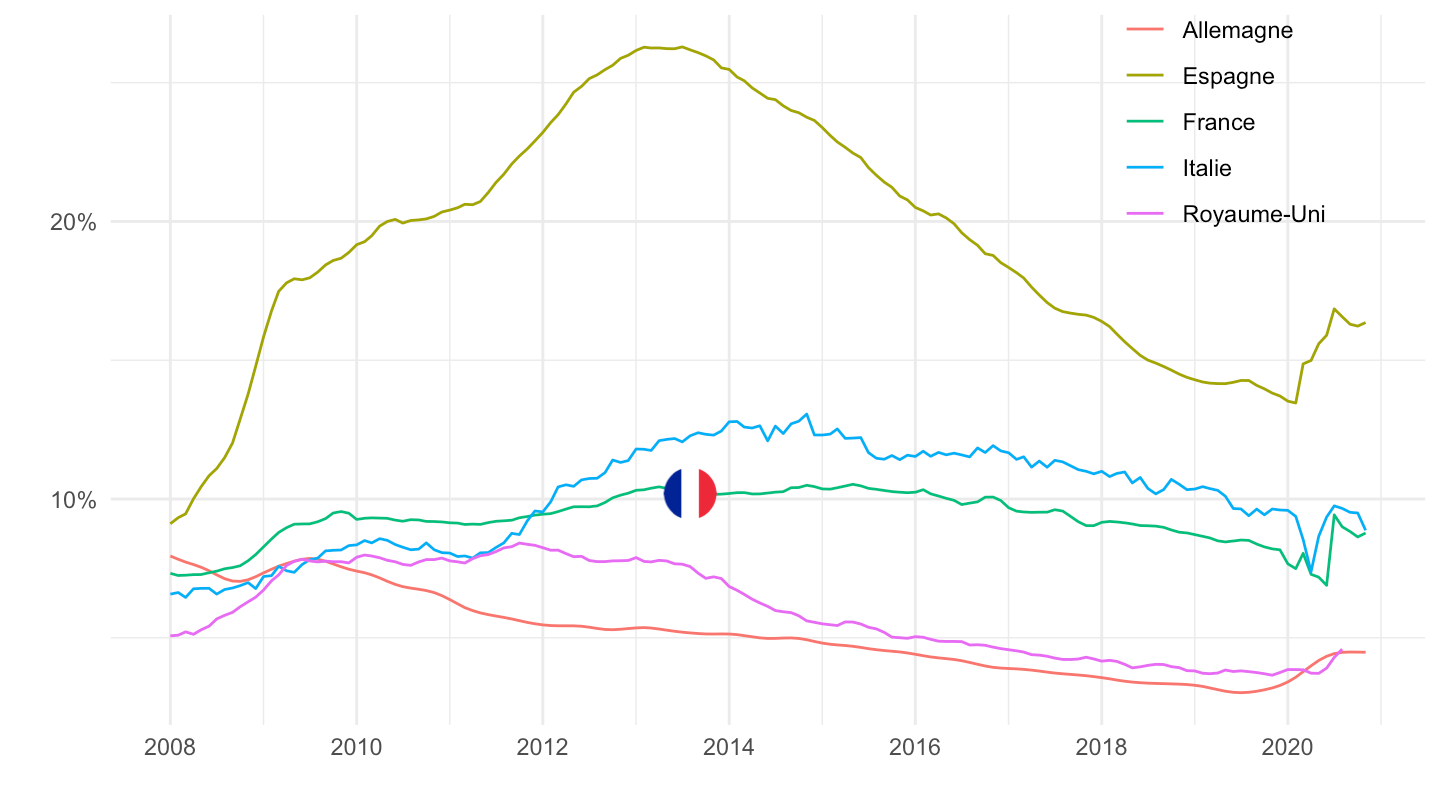
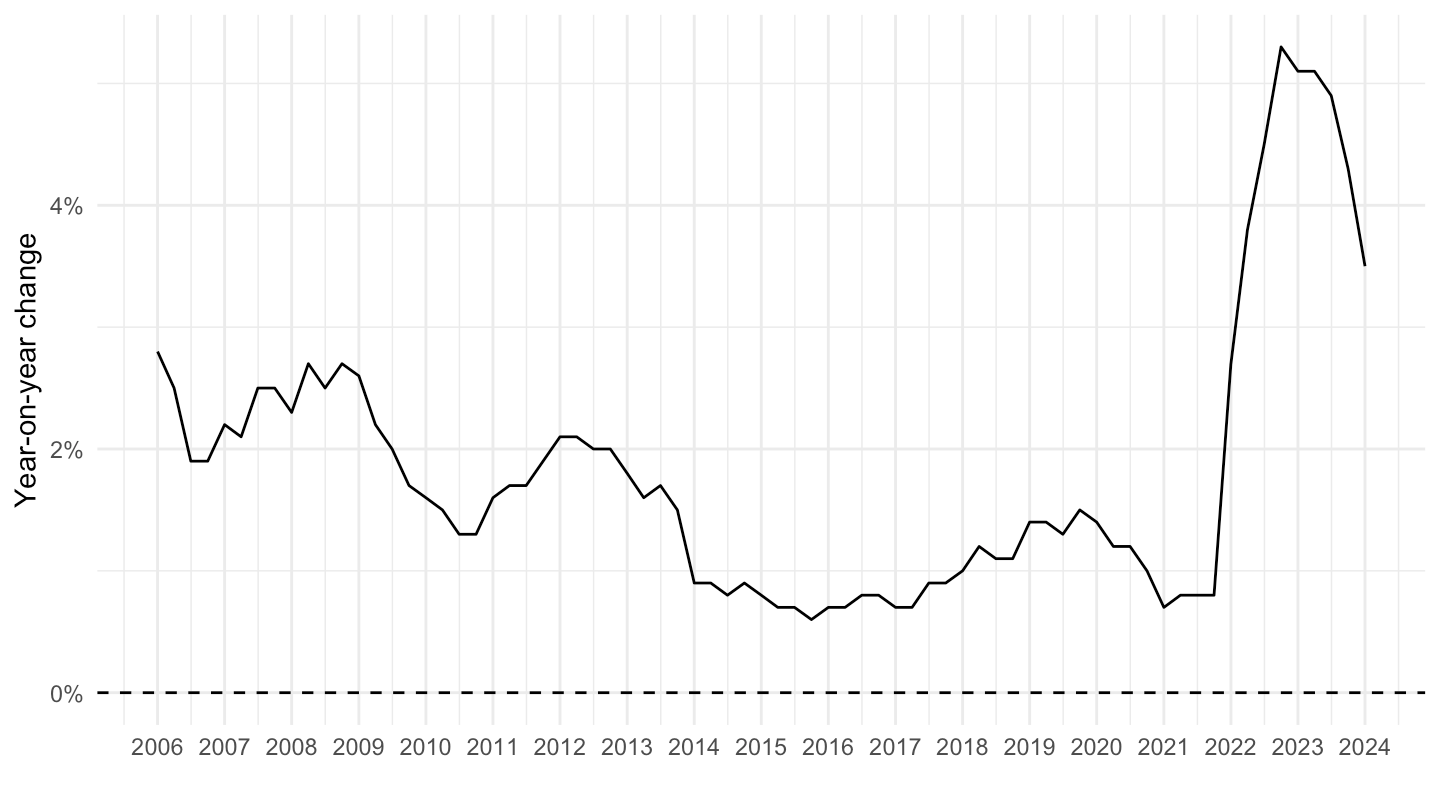
STS |>


  filter(REF_AREA %in% c("FR", "DE", "IT", "ES", "GB"),
         STS_CONCEPT == "UNEH",
         ADJUSTMENT == "S",
         FREQ == "M") |>
  arrange(date) |>
  ggplot() + geom_line(aes(x = date, y = value, color = Ref_area)) +
  xlab("") + ylab("") + theme_minimal() + add_5flags +
  scale_x_date(breaks = seq(1960, 2100, 5) |> paste0("-01-01") |> as.Date(),
               labels = date_format("%Y")) +
  scale_y_continuous(labels = scales::percent_format(accuracy = 1, scale = 1)) +
  theme(legend.position = c(0.85, 0.75),
        legend.title = element_blank())
 Data - Banque de France