| source | dataset | Title | Download | Compile |
|---|---|---|---|---|
| zillow | County_MedianRentalPricePerSqft_AllHomes | Median Rental Price Per Square Feet, All Homes, County | 2020-03-01 | [2026-07-24] |
Median Rental Price Per Square Feet, All Homes, County
Data - Zillow
Info
LAST_DOWNLOAD
LAST_COMPILE
| LAST_COMPILE |
|---|
| 2026-07-25 |
Last
Code
County_MedianRentalPricePerSqft_AllHomes %>%
  group_by(date) %>%
  summarise(Nobs = n()) %>%
  arrange(desc(date)) %>%
  head(1) %>%
print_table_conditional()| date | Nobs |
|---|---|
| 2019-12 | 703 |
RegionID
Code
County_MedianRentalPricePerSqft_AllHomes %>%
  group_by(SizeRank, RegionName, State, Metro, StateCodeFIPS, MunicipalCodeFIPS) %>%
  summarise(Nobs = n()) %>%
  {if (is_html_output()) datatable(., filter = 'top', rownames = F) else .}
date
Code
County_MedianRentalPricePerSqft_AllHomes %>%
  group_by(date) %>%
  summarise(Nobs = n()) %>%
  {if (is_html_output()) datatable(., filter = 'top', rownames = F) else .}
2012-Q4
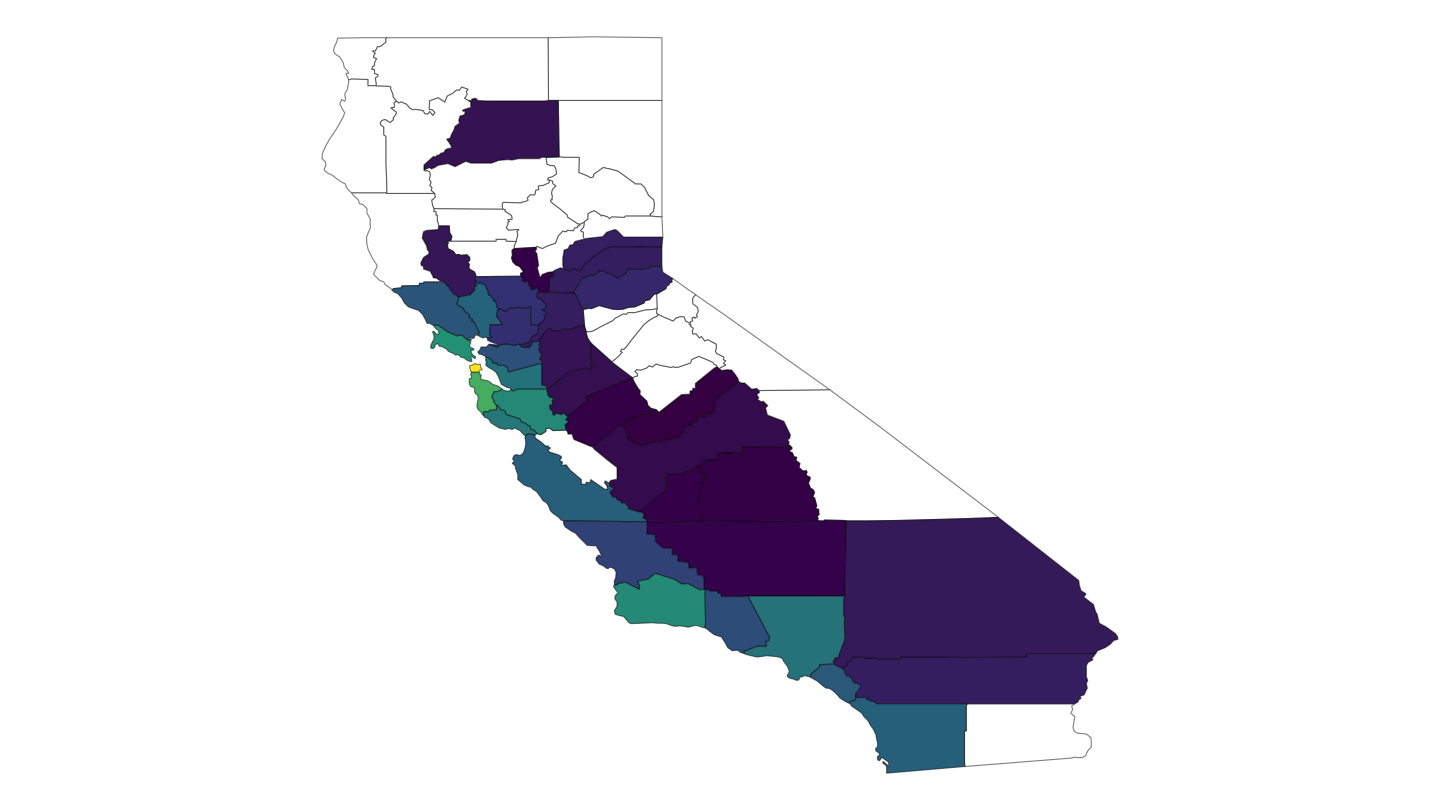
(ref:california-2012-Q4) Price per Square Feet, 2012-Q4, FRB
Code
County_MedianRentalPricePerSqft_AllHomes %>%
  mutate(year = date %>% paste %>% substr(1, 4) %>% as.numeric,
         month = date %>% paste %>% substr(6, 7) %>% as.numeric,
         county_code = StateCodeFIPS*1000 + MunicipalCodeFIPS,
         date = paste0(date, "-01") %>% as.Date) %>%
  filter(date == as.Date("2012-10-01")) %>%
  select(county_code, value) %>%
  left_join(county_code_name %>%
              select(county_code, subregion = county_name3, region = state_name3),
            by = "county_code") %>%
  right_join(county %>%
               filter(region == "california"),
             by = c("region", "subregion")) %>%
  ggplot(aes(long, lat, group = group)) +
  geom_polygon(aes(fill = value), colour = alpha("black", 1/2), size = 0.2)  +
  scale_fill_viridis_c(labels = scales::dollar_format(accuracy = 1),
                       na.value = "white",
                       breaks = seq(0,5000, 250),
                       values = c(0, 0.2, 0.4, 0.6, 0.8, 1)) +
  theme_void() +
  theme(legend.position = c(0.8, 0.8)) +
  labs(fill = "Median Rental Price \nAll Homes") + coord_fixed(ratio = 1)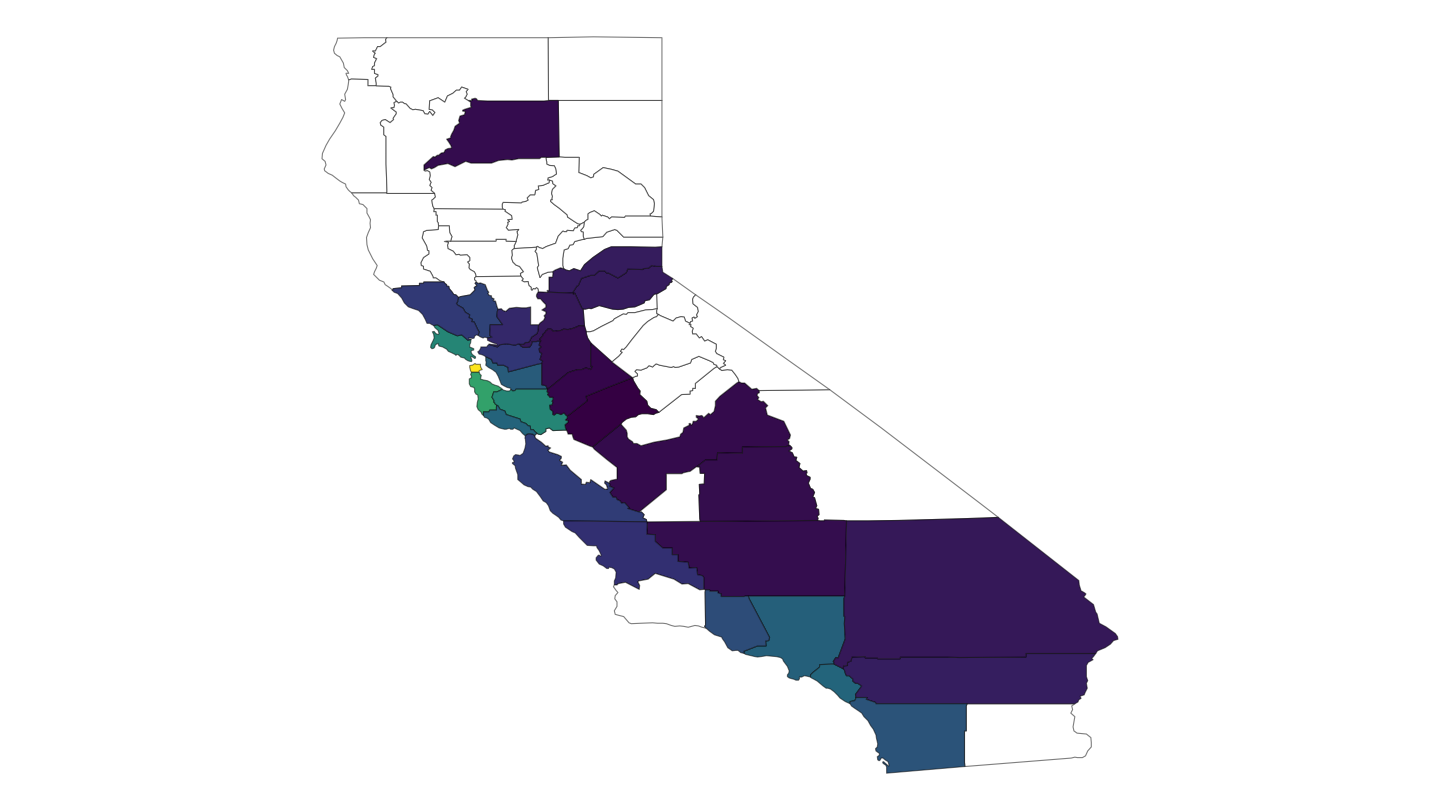
2012-Q4
(ref:california-2018-Q4) Price per Square Feet, 2018-Q4, FRB
Code
County_MedianRentalPricePerSqft_AllHomes %>%
  mutate(year = date %>% paste %>% substr(1, 4) %>% as.numeric,
         month = date %>% paste %>% substr(6, 7) %>% as.numeric,
         county_code = StateCodeFIPS*1000 + MunicipalCodeFIPS,
         date = paste0(date, "-01") %>% as.Date) %>%
  filter(date == as.Date("2018-10-01")) %>%
  select(county_code, value) %>%
  left_join(county_code_name %>%
              select(county_code, subregion = county_name3, region = state_name3),
            by = "county_code") %>%
  right_join(county %>%
               filter(region == "california"),
             by = c("region", "subregion")) %>%
  ggplot(aes(long, lat, group = group)) +
  geom_polygon(aes(fill = value), colour = alpha("black", 1/2), size = 0.2)  +
  scale_fill_viridis_c(labels = scales::dollar_format(accuracy = 1),
                       na.value = "white",
                       breaks = seq(0,5000, 250),
                       values = c(0, 0.2, 0.4, 0.6, 0.8, 1)) +
  theme_void() +
  theme(legend.position = c(0.8, 0.8)) +
  labs(fill = "Median Rental Price \nAll Homes") + coord_fixed(ratio = 1)