Gross capital formation (current USD)

Data - WDI

Info

LAST_DOWNLOAD

Code
tibble(source = c("wdi", "wdi", "wdi", "wdi", "wdi", "oecd", "oecd", "oecd", "eurostat", "eurostat", "eurostat", "eurostat", "eurostat", "eurostat"),
       dataset = c("NE.GDI.TOTL.CD", "NE.GDI.TOTL.CD", "NY.GDP.PCAP.PP.KD", "NY.GDP.MKTP.PP.CD", "NY.GDP.PCAP.CD", "QNA", "SNA_TABLE1", "SNA_TABLE2", "nama_10_a10_e", "nama_10_a10", "namq_10_a10", "nama_10_gdp", "nama_10_lp_ulc", "namq_10_lp_ulc")) %>%
  mutate(Title = read_lines(paste0("~/Library/Mobile\ Documents/com~apple~CloudDocs/website/data/", source, "/",dataset, ".qmd"), skip = 1, n_max = 1) %>% gsub("title: ", "", .) %>% gsub("\"", "", .)) %>%
  mutate(Download = as.Date(file.info(paste0("~/Library/Mobile\ Documents/com~apple~CloudDocs/website/data/", source, "/", dataset, ".RData"))$mtime),
         Compile = as.Date(file.info(paste0("~/Library/Mobile\ Documents/com~apple~CloudDocs/website/data/", source, "/", dataset, ".html"))$mtime)) %>%
  mutate(Compile = paste0("[", Compile, "](https://fgeerolf.com/data/", source, "/", dataset, '.html)')) %>%
  print_table_conditional_20()
source dataset Title Download Compile
wdi NE.GDI.TOTL.CD Gross capital formation (current USD) 2024-04-14 [2024-06-19]
wdi NY.GDP.PCAP.PP.KD GDP per capita, PPP (constant 2011 international D) 2024-05-06 [2024-06-19]
wdi NY.GDP.MKTP.PP.CD GDP, PPP (current international D) 2024-04-14 [2024-06-19]
wdi NY.GDP.PCAP.CD GDP per capita (current USD) 2024-04-22 [2024-06-19]
oecd QNA Quarterly National Accounts, Per Capita 2024-06-05 [2024-06-06]
oecd SNA_TABLE1 Gross domestic product (GDP) 2024-06-01 [2024-06-19]
oecd SNA_TABLE2 Disposable income and net lending - net borrowing 2024-04-11 [2024-06-19]
eurostat nama_10_a10_e Employment by A*10 industry breakdowns 2024-06-18 [2024-06-20]
eurostat nama_10_a10 Gross value added and income by A*10 industry breakdowns 2024-06-08 [2024-06-20]
eurostat namq_10_a10 Gross value added and income A*10 industry breakdowns 2024-06-18 [2024-06-20]
eurostat nama_10_gdp GDP and main components (output, expenditure and income) 2024-06-18 [2024-06-20]
eurostat nama_10_lp_ulc Labour productivity and unit labour costs 2024-06-08 [2024-06-20]
eurostat namq_10_lp_ulc Labour productivity and unit labour costs 2024-06-08 [2024-06-19]

LAST_COMPILE

LAST_COMPILE
2024-06-20

Last

Code
NE.GDI.TOTL.CD %>%
  group_by(year) %>%
  summarise(Nobs = n()) %>%
  arrange(desc(year)) %>%
  head(1) %>%
  print_table_conditional()
year Nobs
2022 188

Nobs - Javascript

Code
NE.GDI.TOTL.CD %>%
  left_join(iso2c, by = "iso2c") %>%
  group_by(iso2c, Iso2c) %>%
  mutate(value = round(value/10^6)) %>%
  summarise(Nobs = n(),
            `Year 1` = first(year),
            `Investment 1 (Bn)` = first(value) %>% paste0("$ ", .),
            `Year 2` = last(year),
            `Investment 2 (Bn)` = last(value) %>% paste0("$ ", .)) %>%
  arrange(-Nobs) %>%
  {if (is_html_output()) datatable(., filter = 'top', rownames = F) else .}

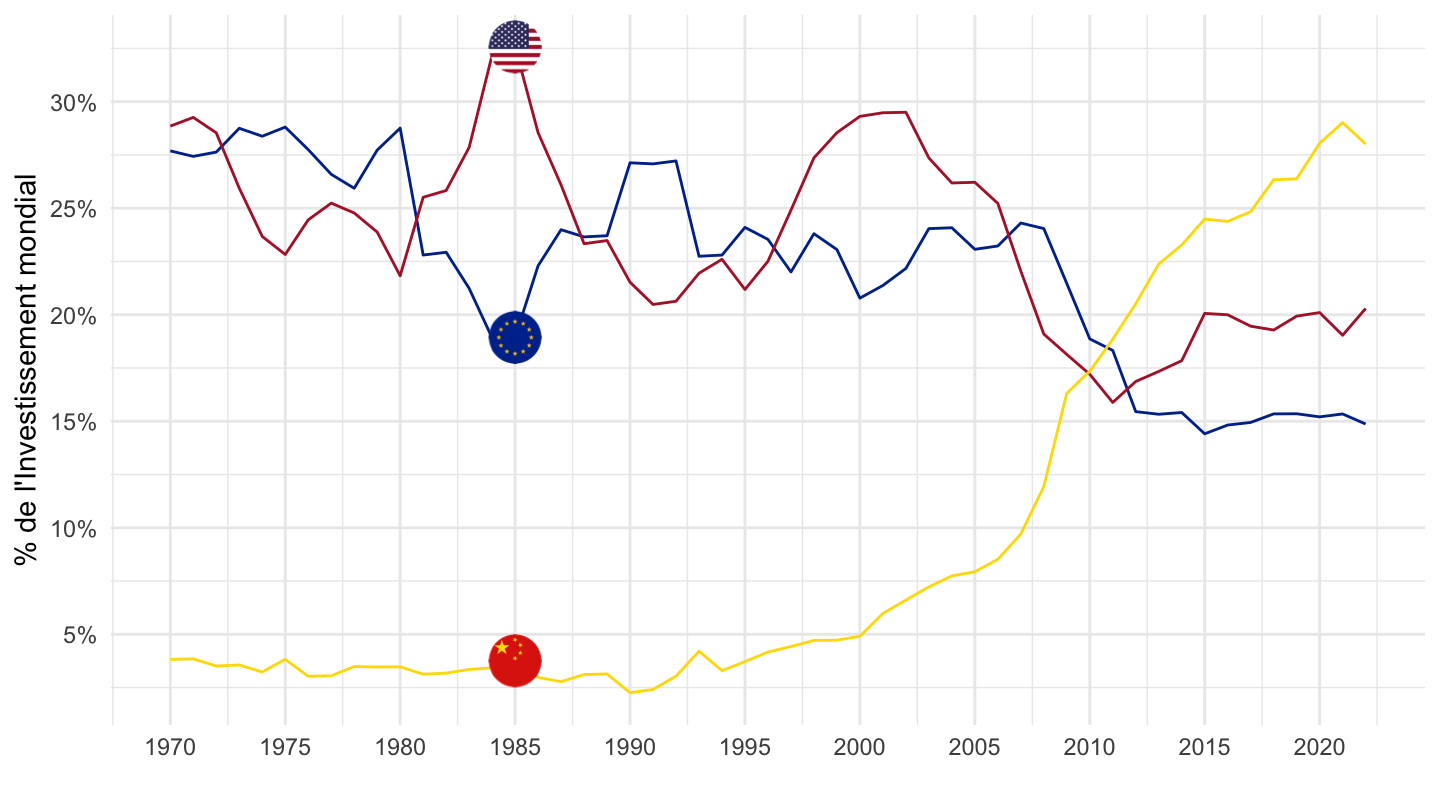
China, E.U., U.S.

Linear

All

Code
NE.GDI.TOTL.CD %>%
  right_join(iso2c, by = "iso2c") %>%
  filter(iso2c %in% c("1W", "US", "CN", "EU")) %>%
  group_by(year) %>%
  filter(n() > 3) %>%
  mutate(value = value/value[iso2c == "1W"]) %>%
  year_to_date %>%
  filter(!(iso2c == "1W")) %>%
  mutate(Iso2c = ifelse(iso2c == "EU", "Europe", Iso2c)) %>%
  left_join(colors, by = c("Iso2c" = "country")) %>%
  mutate(color = ifelse(iso2c == "US", color2, color)) %>%
  ggplot(.) + theme_minimal() + scale_color_identity() +
  geom_line(aes(x = date, y = value, color = color)) +
  add_3flags +
  scale_x_date(breaks = seq(1950, 2020, 5) %>% paste0("-01-01") %>% as.Date,
               labels = date_format("%Y")) +
  scale_y_continuous(breaks = 0.01*seq(0, 70, 5),
                     labels = scales::percent_format(accuracy = 1)) + 
  xlab("") + ylab("% de l'Investissement mondial")

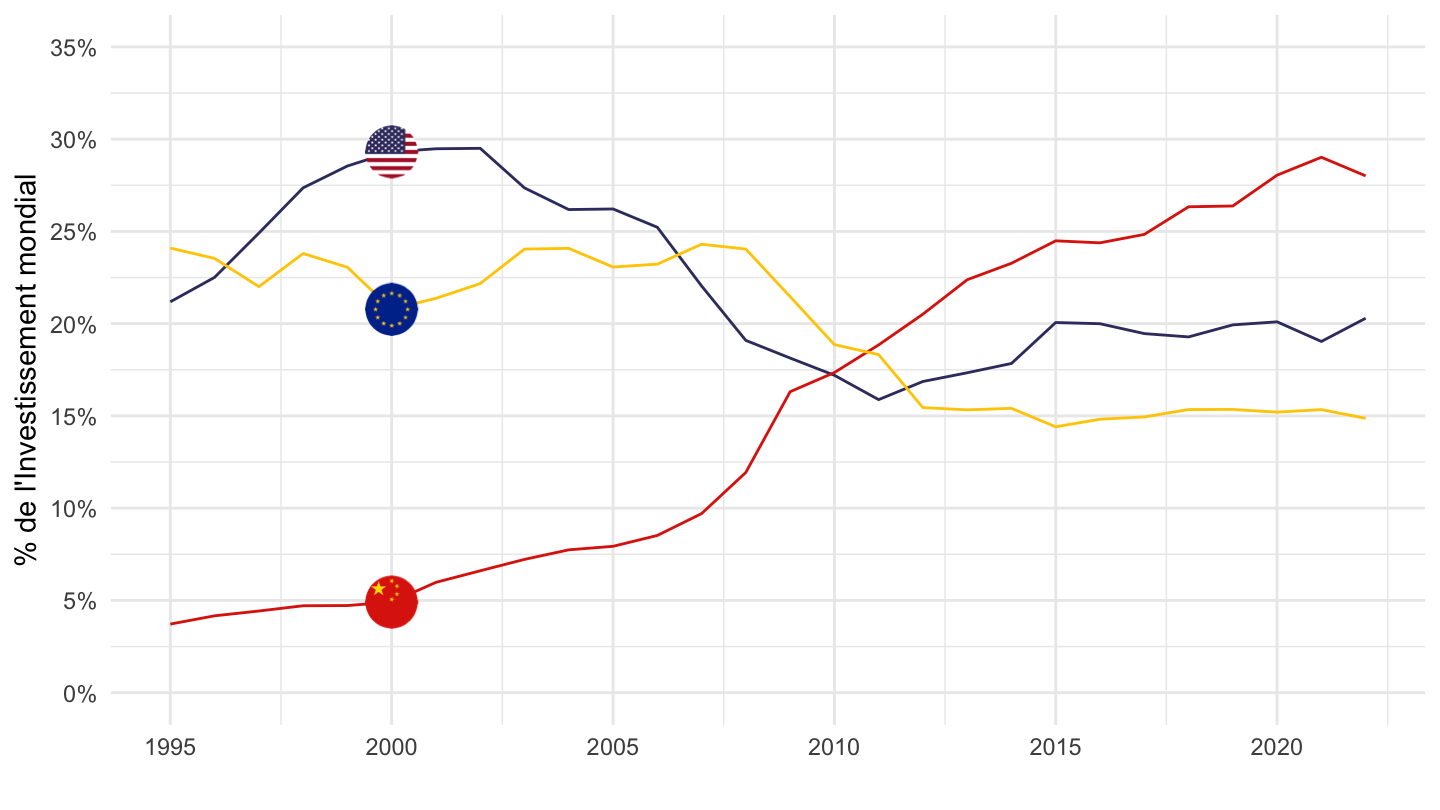
1995-

Code
NE.GDI.TOTL.CD %>%
  right_join(iso2c, by = "iso2c") %>%
  filter(iso2c %in% c("1W", "US", "CN", "EU")) %>%
  group_by(year) %>%
  filter(n() > 3) %>%
  mutate(value = value/value[iso2c == "1W"]) %>%
  year_to_date %>%
  filter(!(iso2c == "1W")) %>%
  mutate(Iso2c = ifelse(iso2c == "EU", "Europe", Iso2c)) %>%
  left_join(colors, by = c("Iso2c" = "country")) %>%
  mutate(color = ifelse(iso2c != "US", color2, color)) %>%
  filter(date >= as.Date("1995-01-01")) %>%
  ggplot(.) + theme_minimal() + scale_color_identity() +
  geom_line(aes(x = date, y = value, color = color)) +
  add_3flags +
  scale_x_date(breaks = seq(1950, 2020, 5) %>% paste0("-01-01") %>% as.Date,
               labels = date_format("%Y")) +
  scale_y_continuous(breaks = 0.01*seq(0, 70, 5),
                     labels = scales::percent_format(accuracy = 1),
                     limits = 0.01*c(0, 35)) + 
  xlab("") + ylab("% de l'Investissement mondial")

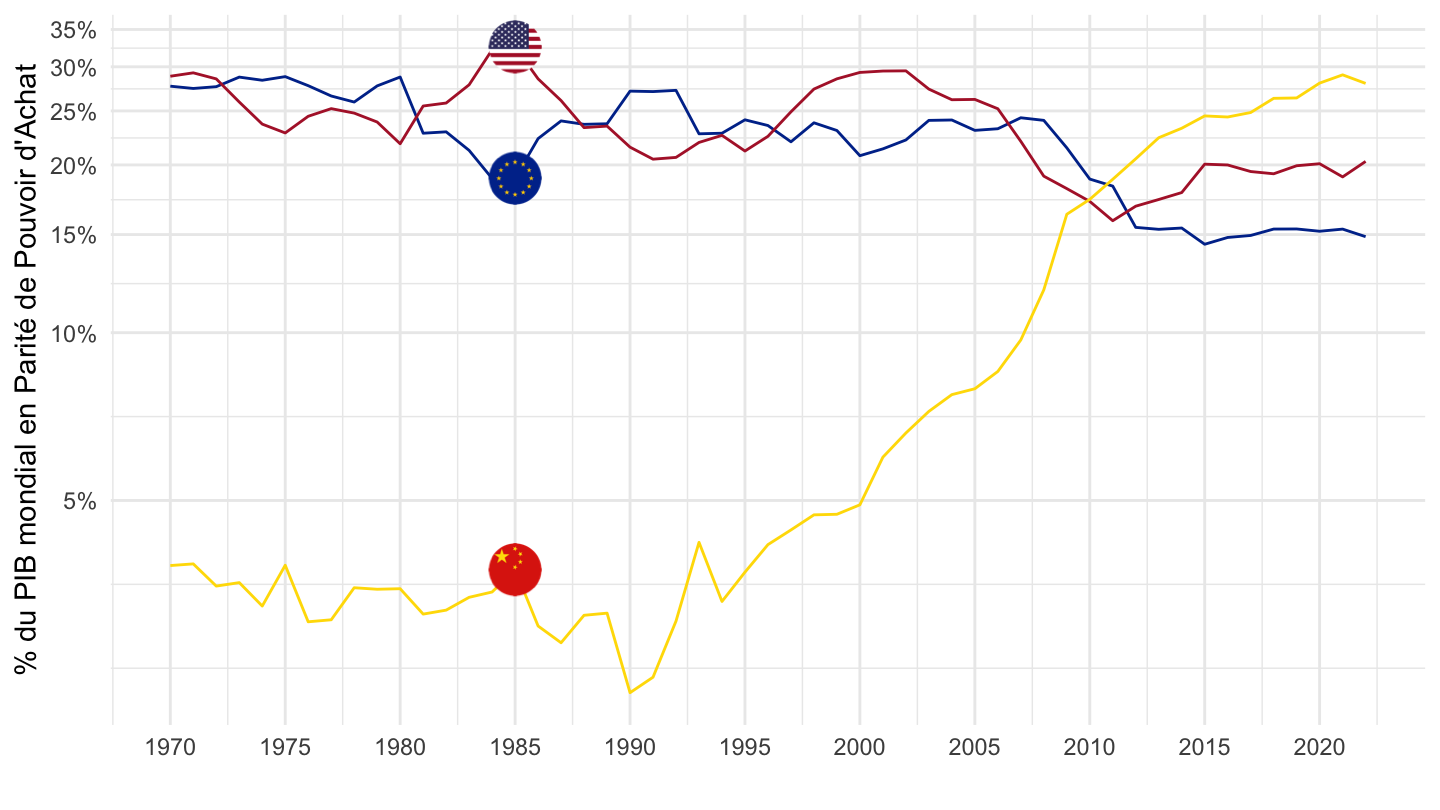
Log

Code
NE.GDI.TOTL.CD %>%
  right_join(iso2c, by = "iso2c") %>%
  filter(iso2c %in% c("1W", "US", "CN", "EU")) %>%
  group_by(year) %>%
  filter(n() > 3) %>%
  mutate(value = value/value[iso2c == "1W"]) %>%
  year_to_date %>%
  filter(!(iso2c == "1W")) %>%
  mutate(Iso2c = ifelse(iso2c == "EU", "Europe", Iso2c)) %>%
  left_join(colors, by = c("Iso2c" = "country")) %>%
  mutate(color = ifelse(iso2c == "US", color2, color)) %>%
  ggplot(.) + theme_minimal() + scale_color_identity() +
  geom_line(aes(x = date, y = value, color = color)) +
  add_3flags +
  scale_x_date(breaks = seq(1950, 2020, 5) %>% paste0("-01-01") %>% as.Date,
               labels = date_format("%Y")) +
  scale_y_log10(breaks = 0.01*seq(0, 70, 5),
                     labels = scales::percent_format(accuracy = 1)) + 
  xlab("") + ylab("% du PIB mondial en Parité de Pouvoir d'Achat")

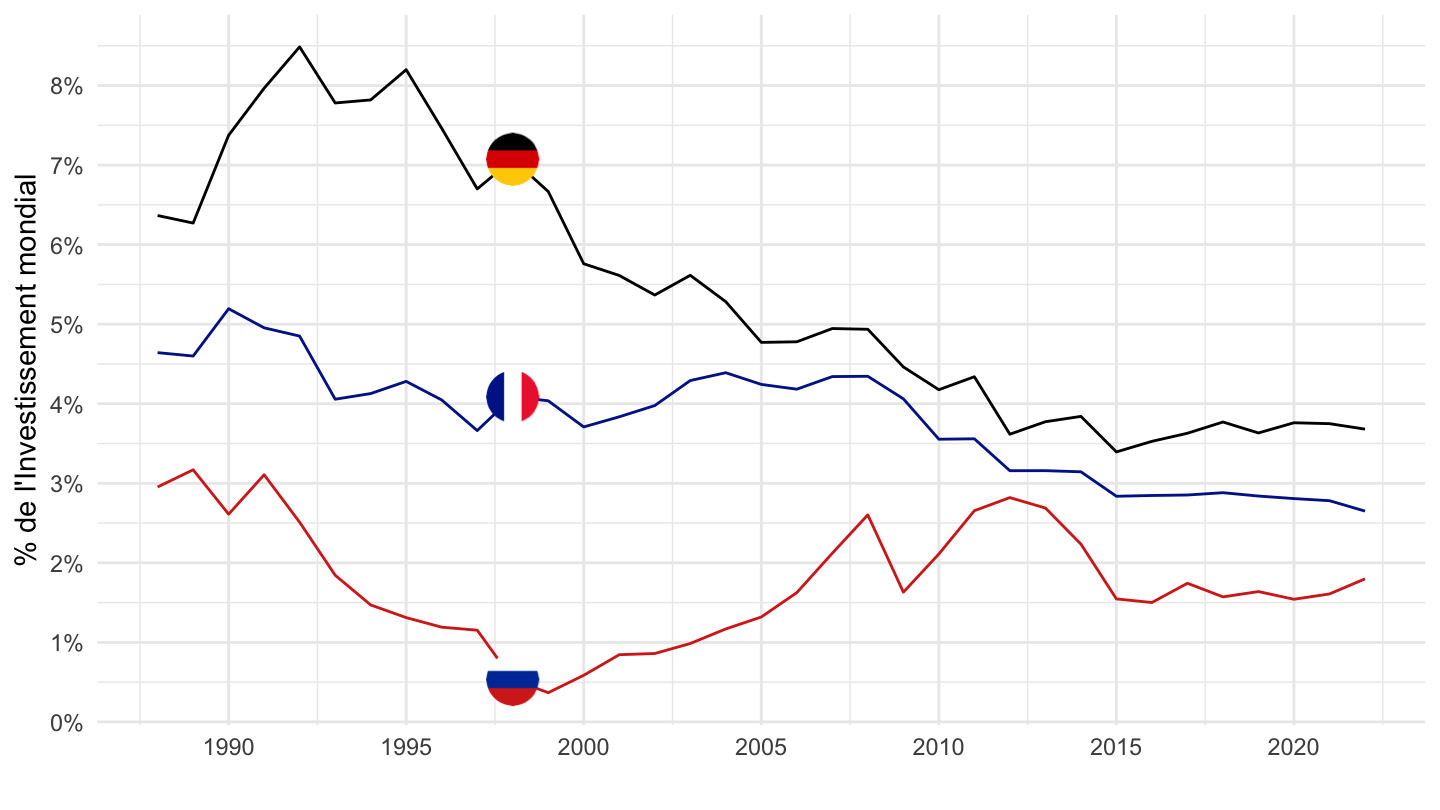
Russia, France, Germany

Linear

All

Code
NE.GDI.TOTL.CD %>%
  right_join(iso2c, by = "iso2c") %>%
  filter(iso2c %in% c("1W", "RU", "FR", "DE")) %>%
  group_by(year) %>%
  filter(n() > 3) %>%
  mutate(value = value/value[iso2c == "1W"]) %>%
  year_to_date %>%
  filter(!(iso2c == "1W")) %>%
  mutate(Iso2c = ifelse(iso2c == "EU", "Europe", Iso2c)) %>%
  mutate(Iso2c = ifelse(iso2c == "RU", "Russia", Iso2c)) %>%
  left_join(colors, by = c("Iso2c" = "country")) %>%
  mutate(color = ifelse(iso2c == "FR", color2, color)) %>%
  ggplot(.) + theme_minimal() + scale_color_identity() +
  geom_line(aes(x = date, y = value, color = color)) +
  add_3flags +
  scale_x_date(breaks = seq(1950, 2020, 5) %>% paste0("-01-01") %>% as.Date,
               labels = date_format("%Y")) +
  scale_y_continuous(breaks = 0.01*seq(0, 70, 1),
                     labels = scales::percent_format(accuracy = 1)) + 
  xlab("") + ylab("% de l'Investissement mondial")

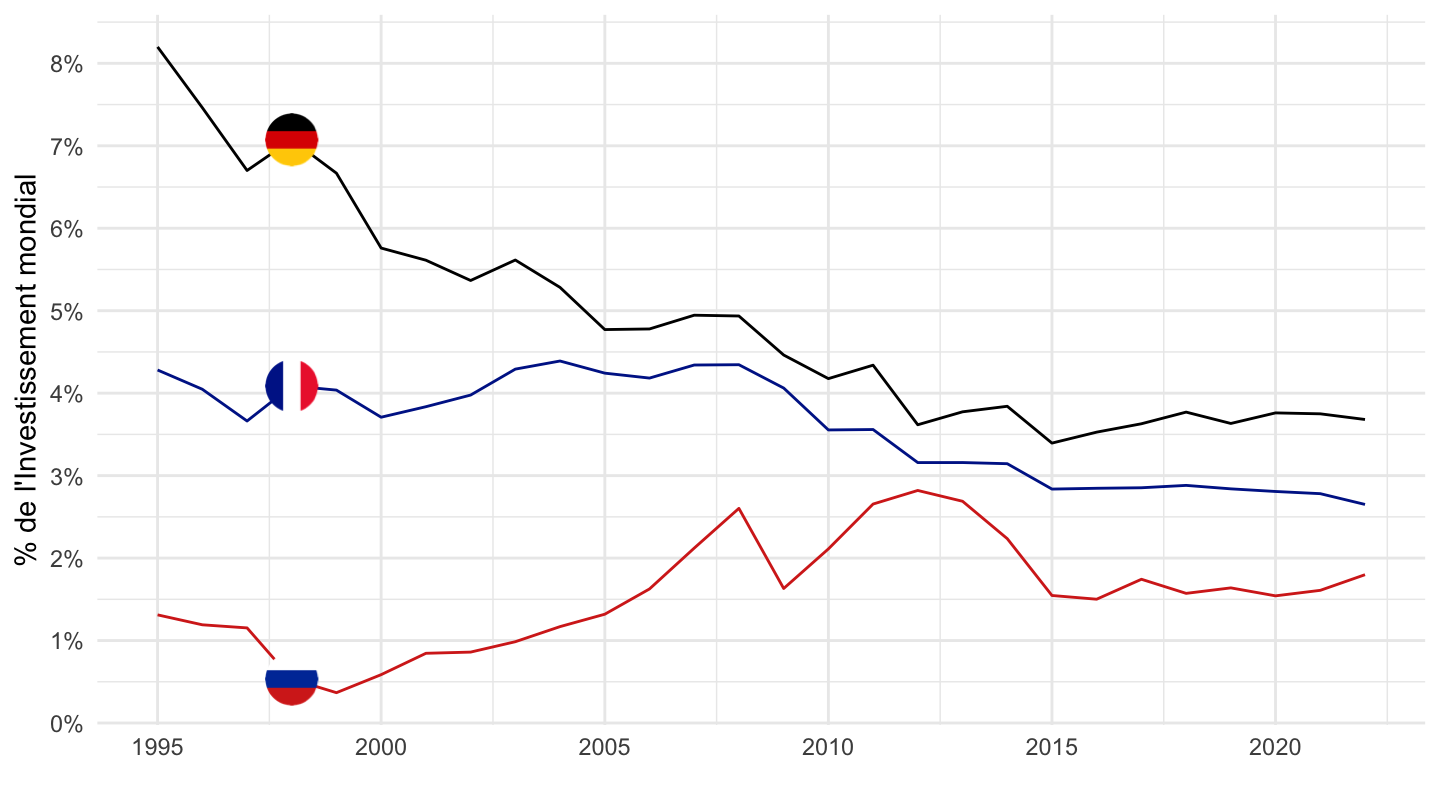
1995-

Code
NE.GDI.TOTL.CD %>%
  right_join(iso2c, by = "iso2c") %>%
  filter(iso2c %in% c("1W", "RU", "FR", "DE")) %>%
  group_by(year) %>%
  filter(n() > 3) %>%
  mutate(value = value/value[iso2c == "1W"]) %>%
  year_to_date %>%
  filter(!(iso2c == "1W")) %>%
  mutate(Iso2c = ifelse(iso2c == "EU", "Europe", Iso2c)) %>%
  mutate(Iso2c = ifelse(iso2c == "RU", "Russia", Iso2c)) %>%
  left_join(colors, by = c("Iso2c" = "country")) %>%
  mutate(color = ifelse(iso2c == "FR", color2, color)) %>%
  filter(date >= as.Date("1995-01-01")) %>%
  ggplot(.) + theme_minimal() + scale_color_identity() +
  geom_line(aes(x = date, y = value, color = color)) +
  add_3flags +
  scale_x_date(breaks = seq(1950, 2020, 5) %>% paste0("-01-01") %>% as.Date,
               labels = date_format("%Y")) +
  scale_y_continuous(breaks = 0.01*seq(0, 70, 1),
                     labels = scales::percent_format(accuracy = 1)) + 
  xlab("") + ylab("% de l'Investissement mondial")