Exports of goods and services (% of GDP) - NE.EXP.GNFS.ZS
Data - WDI
François Geerolf
Nobs - Javascript
NE.EXP.GNFS.ZS %>%
  left_join(iso2c, by = "iso2c") %>%
  group_by(iso2c, Iso2c) %>%
  mutate(NE.EXP.GNFS.ZS = round(NE.EXP.GNFS.ZS, 2)) %>%
  summarise(Nobs = n(),
            `Year 1` = first(year),
            `NX 1 (%)` = first(NE.EXP.GNFS.ZS),
            `Year 2` = last(year),
            `NX 2 (%)` = last(NE.EXP.GNFS.ZS)) %>%
  arrange(-Nobs) %>%
  {if (is_html_output()) datatable(., filter = 'top', rownames = F) else .}
Crises in Emerging Markets (Source: Vegh (2013))
1982: Southern Cone - Argentina, Chile, Uruguay
NE.EXP.GNFS.ZS %>%
  year_to_enddate %>%
  filter(iso2c %in% c("AR", "CL", "UY"),
         date >= as.Date("1976-01-01"),
         date <= as.Date("1987-01-01")) %>%
  left_join(iso2c, by = "iso2c") %>%
  ggplot(.) +
  geom_line(aes(x = date, y = NE.EXP.GNFS.ZS/100, color = Iso2c, linetype = Iso2c)) +
  theme_minimal() + scale_color_manual(values = viridis(4)[1:3]) +
  theme(legend.title = element_blank(),
        legend.position = c(0.8, 0.2)) +
  scale_x_date(breaks = seq(1950, 2020, 1) %>% paste0("-01-01") %>% as.Date,
               labels = date_format("%y")) +
  scale_y_continuous(breaks = 0.01*seq(-60, 60, 2),
                     labels = scales::percent_format(accuracy = 1)) +
  xlab("") + ylab("Exports of goods and services (% of GDP)")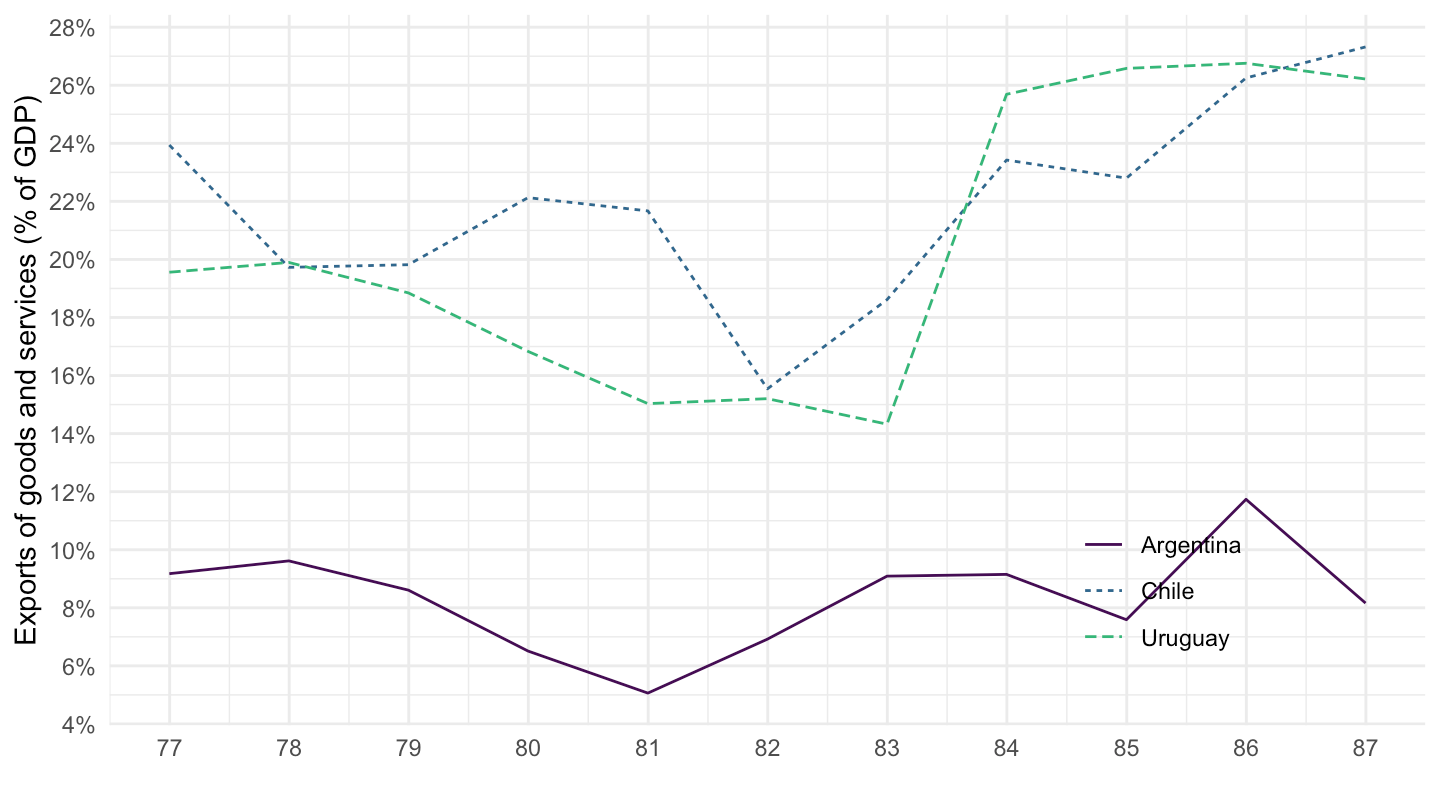
1994: Mexico
NE.EXP.GNFS.ZS %>%
  year_to_enddate %>%
  filter(iso2c %in% c("MX"),
         date <= as.Date("1999-01-01"),
         date >= as.Date("1989-01-01")) %>%
  left_join(iso2c, by = "iso2c") %>%
  ggplot(.) +
  geom_line(aes(x = date, y = NE.EXP.GNFS.ZS/100)) +
  theme_minimal() + scale_color_manual(values = viridis(5)[1:4]) +
  theme(legend.title = element_blank(),
        legend.position = c(0.2, 0.8)) +
  scale_x_date(breaks = seq(1950, 2020, 1) %>% paste0("-01-01") %>% as.Date,
               labels = date_format("%y")) +
  scale_y_continuous(breaks = 0.01*seq(-60, 60, 1),
                     labels = scales::percent_format(accuracy = 1)) +
  xlab("") + ylab("Exports of goods and services (% of GDP)")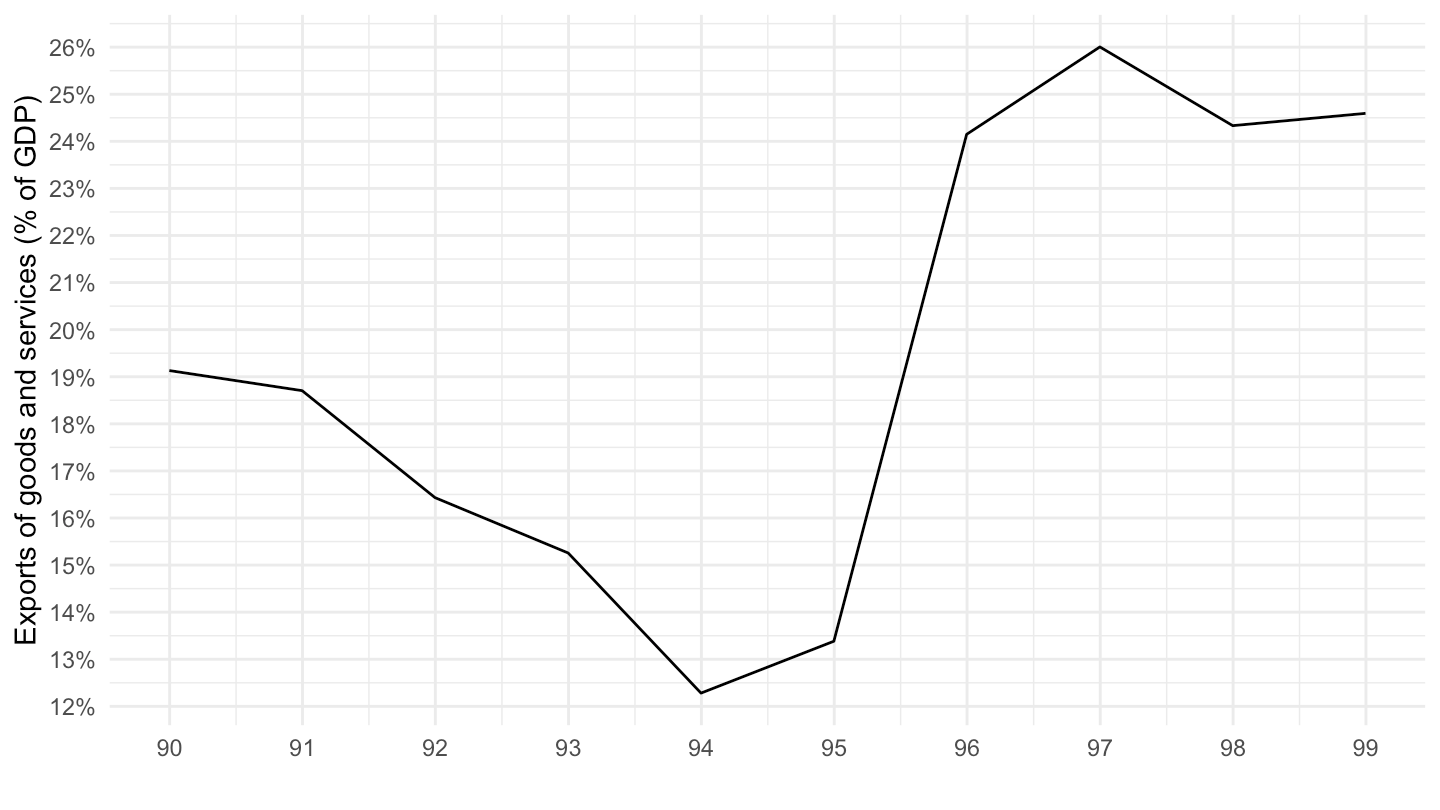
1997: East Asia - Indonesia, Korea, Malaysia, Thailand
NE.EXP.GNFS.ZS %>%
  year_to_enddate %>%
  filter(iso2c %in% c("ID", "KR", "MY", "TH"),
         date <= as.Date("2002-01-01"),
         date >= as.Date("1992-01-01")) %>%
  left_join(iso2c, by = "iso2c") %>%
  ggplot(.) +
  geom_line(aes(x = date, y = NE.EXP.GNFS.ZS/100, color = Iso2c, linetype = Iso2c)) +
  theme_minimal() + scale_color_manual(values = viridis(5)[1:4]) +
  theme(legend.title = element_blank(),
        legend.position = c(0.2, 0.8)) +
  scale_x_date(breaks = seq(1950, 2020, 1) %>% paste0("-01-01") %>% as.Date,
               labels = date_format("%y")) +
  scale_y_continuous(breaks = 0.01*seq(-60, 60, 2),
                     labels = scales::percent_format(accuracy = 1)) +
  xlab("") + ylab("Exports of goods and services (% of GDP)")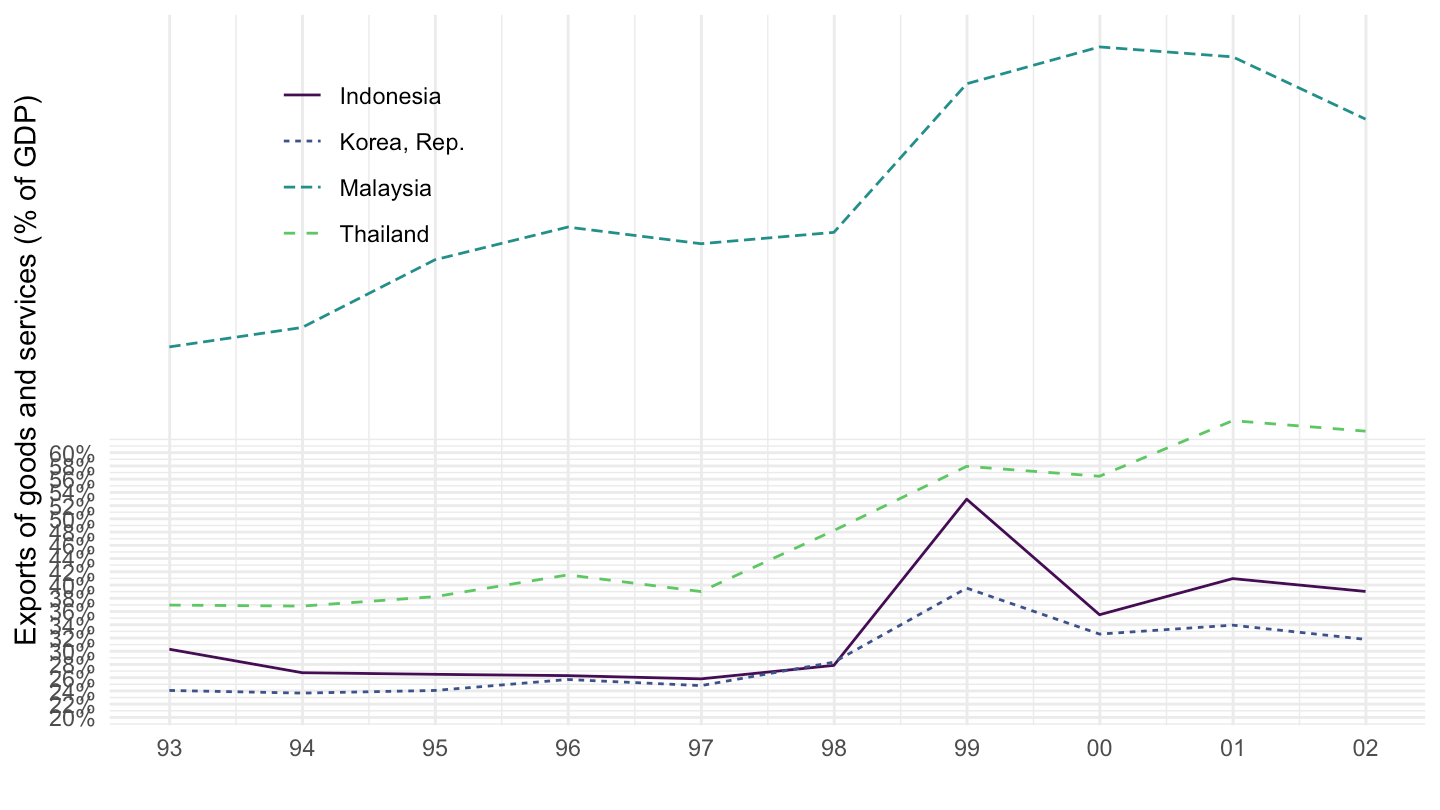
2001: Turkey
NE.EXP.GNFS.ZS %>%
  year_to_enddate %>%
  filter(iso2c %in% c("TR"),
         date <= as.Date("2006-01-01"),
         date >= as.Date("1996-01-01")) %>%
  left_join(iso2c, by = "iso2c") %>%
  ggplot(.) +
  geom_line(aes(x = date, y = NE.EXP.GNFS.ZS/100)) +
  theme_minimal() + scale_color_manual(values = viridis(5)[1:4]) +
  theme(legend.title = element_blank(),
        legend.position = c(0.2, 0.8)) +
  scale_x_date(breaks = seq(1950, 2020, 1) %>% paste0("-01-01") %>% as.Date,
               labels = date_format("%y")) +
  scale_y_continuous(breaks = 0.01*seq(-60, 60, 1),
                     labels = scales::percent_format(accuracy = 1)) +
  xlab("") + ylab("Exports of goods and services (% of GDP)")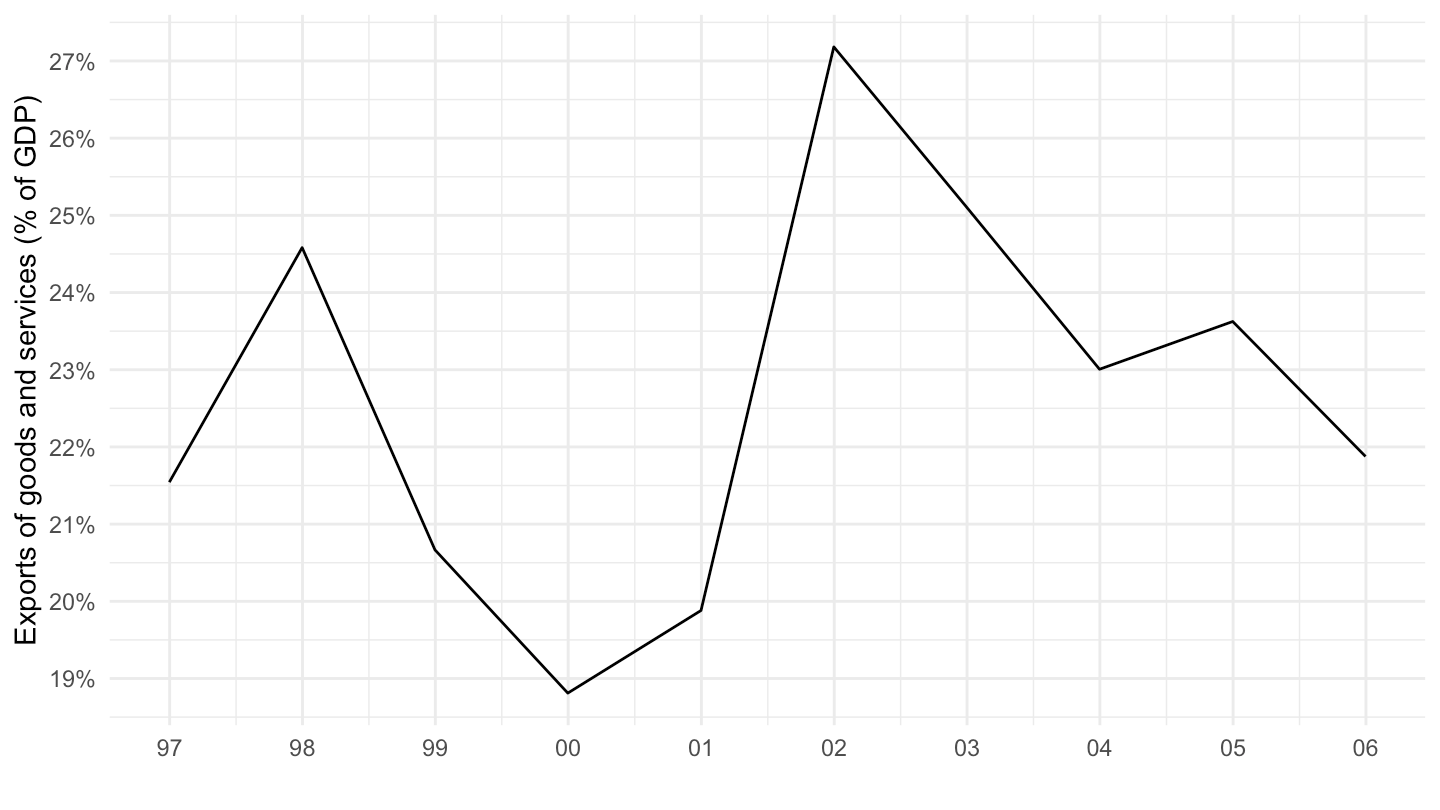
France, Germany, Italy
NE.EXP.GNFS.ZS %>%
  filter(iso2c %in% c("IT", "FR", "DE")) %>%
  left_join(iso2c, by = "iso2c") %>%
  year_to_enddate %>%
  ggplot(.) +
  geom_line(aes(x = date, y = NE.EXP.GNFS.ZS/100, color = Iso2c, linetype = Iso2c)) +
  theme_minimal() + scale_color_manual(values = viridis(4)[1:3]) +
  theme(legend.title = element_blank(),
        legend.position = c(0.2, 0.9)) +
  scale_x_date(breaks = seq(1950, 2020, 5) %>% paste0("-01-01") %>% as.Date,
               labels = date_format("%y")) +
  scale_y_continuous(breaks = 0.01*seq(-60, 60, 1),
                     labels = scales::percent_format(accuracy = 1)) +
  xlab("") + ylab("Exports of goods and services (% of GDP)")
Saudi Arabia, Jordan, Kuwait
NE.EXP.GNFS.ZS %>%
  filter(iso2c %in% c("SA", "JO", "KW")) %>%
  left_join(iso2c, by = "iso2c") %>%
  year_to_enddate %>%
  ggplot(.) +
  geom_line(aes(x = date, y = NE.EXP.GNFS.ZS/100, color = Iso2c, linetype = Iso2c)) +
  theme_minimal() + scale_color_manual(values = viridis(4)[1:3]) +
  theme(legend.title = element_blank(),
        legend.position = c(0.6, 0.9),
        legend.direction = "horizontal") +
  scale_x_date(breaks = seq(1950, 2020, 5) %>% paste0("-01-01") %>% as.Date,
               labels = date_format("%y")) +
  scale_y_continuous(breaks = 0.01*seq(-60, 60, 5),
                     labels = scales::percent_format(accuracy = 1)) +
  xlab("") + ylab("Exports of goods and services (% of GDP)")
Canada, Israel, The Netherlands
NE.EXP.GNFS.ZS %>%
  filter(iso2c %in% c("CA", "IL", "NL")) %>%
  left_join(iso2c, by = "iso2c") %>%
  year_to_enddate %>%
  ggplot(.) +
  geom_line(aes(x = date, y = NE.EXP.GNFS.ZS/100, color = Iso2c, linetype = Iso2c)) +
  theme_minimal() + scale_color_manual(values = viridis(4)[1:3]) +
  theme(legend.title = element_blank(),
        legend.position = c(0.2, 0.9)) +
  scale_x_date(breaks = seq(1950, 2020, 5) %>% paste0("-01-01") %>% as.Date,
               labels = date_format("%y")) +
  scale_y_continuous(breaks = 0.01*seq(-60, 60, 2),
                     labels = scales::percent_format(accuracy = 1)) +
  xlab("") + ylab("Exports of goods and services (% of GDP)")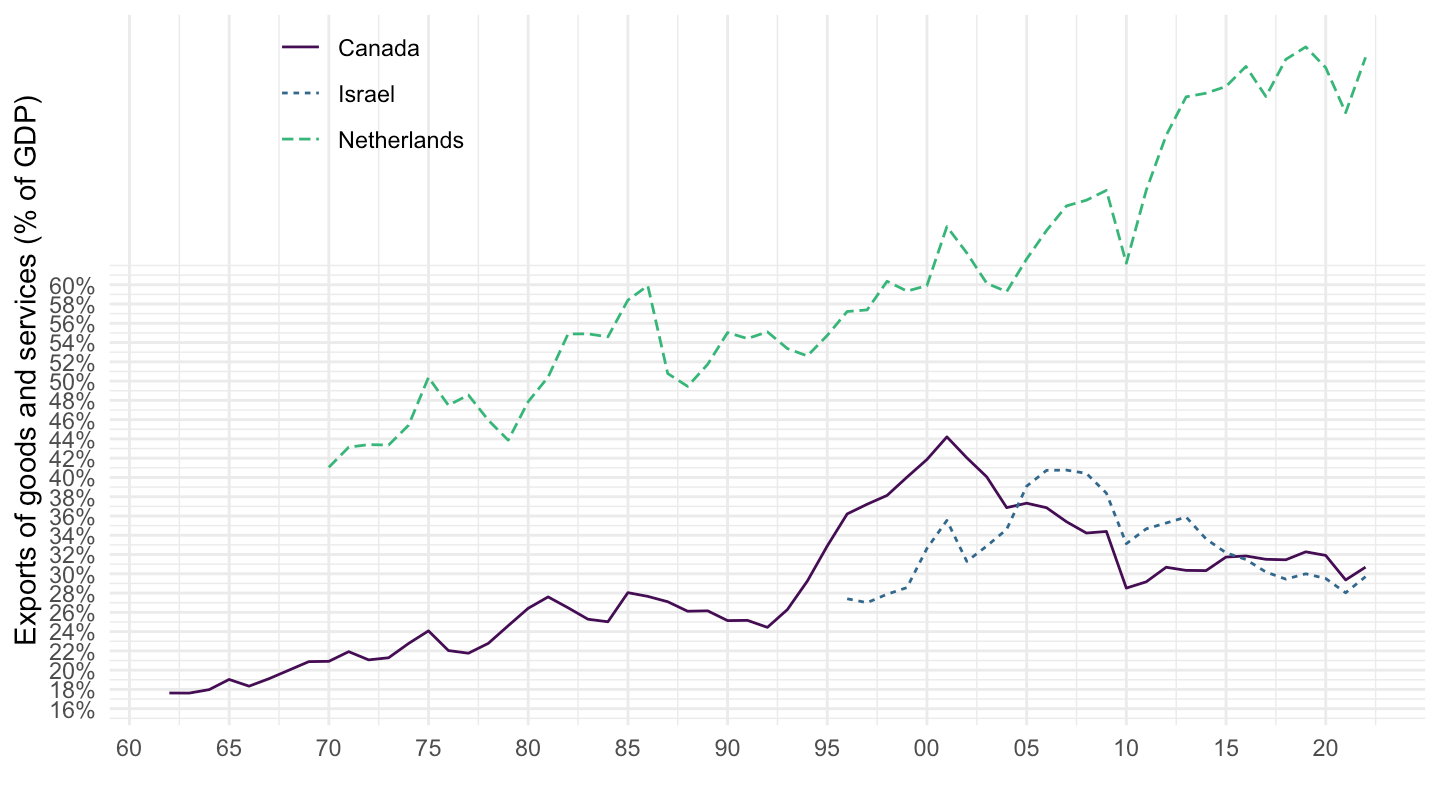
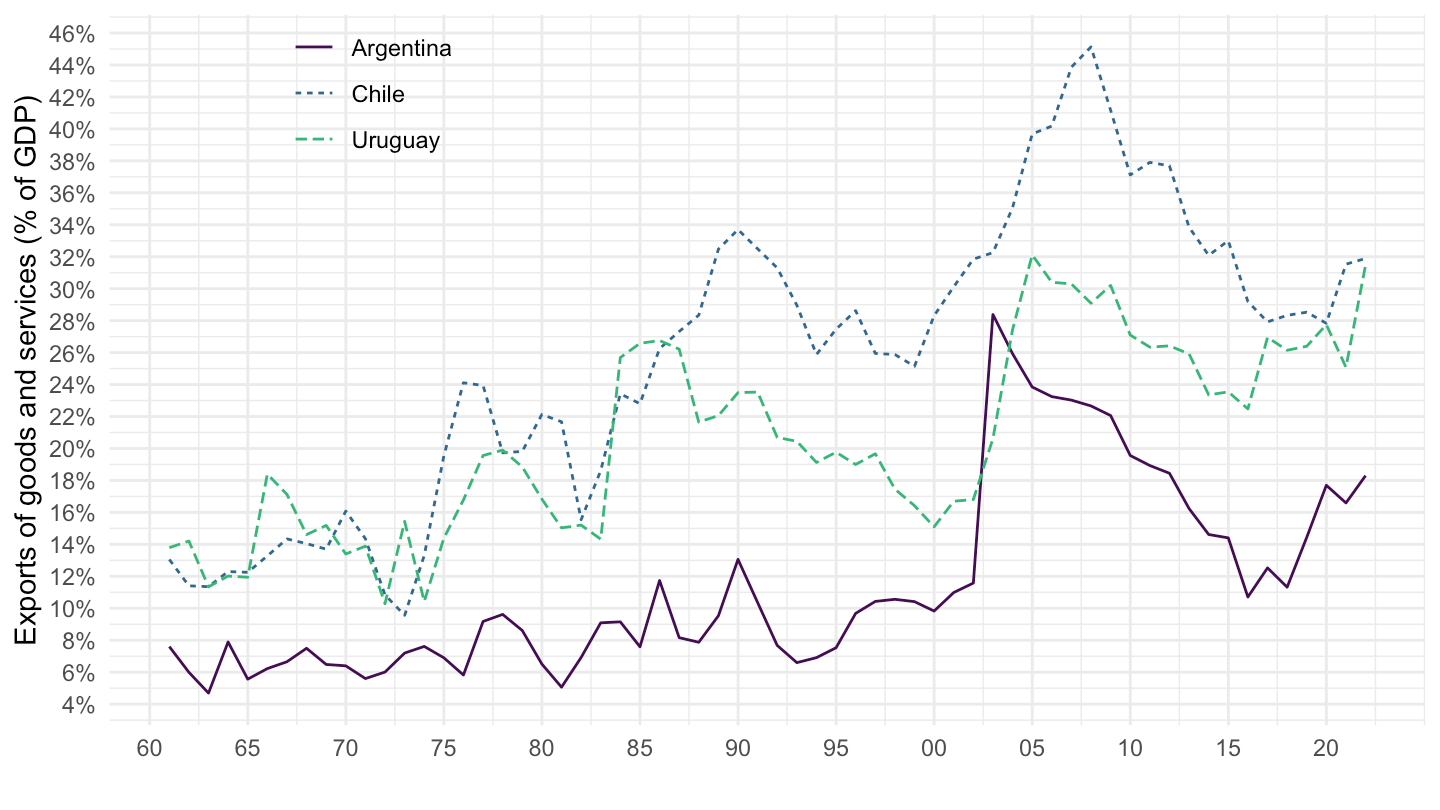
Argentina, Chile, Uruguay
NE.EXP.GNFS.ZS %>%
  filter(iso2c %in% c("AR", "CL", "UY")) %>%
  left_join(iso2c, by = "iso2c") %>%
  year_to_enddate %>%
  ggplot(.) +
  geom_line(aes(x = date, y = NE.EXP.GNFS.ZS/100, color = Iso2c, linetype = Iso2c)) +
  theme_minimal() + scale_color_manual(values = viridis(4)[1:3]) +
  theme(legend.title = element_blank(),
        legend.position = c(0.2, 0.9)) +
  scale_x_date(breaks = seq(1950, 2020, 5) %>% paste0("-01-01") %>% as.Date,
               labels = date_format("%y")) +
  scale_y_continuous(breaks = 0.01*seq(-60, 60, 2),
                     labels = scales::percent_format(accuracy = 1)) +
  xlab("") + ylab("Exports of goods and services (% of GDP)")