Phillips Curve - phillips

Data - US

House Prices & Rents

All

Code
data <- shiller_house_prices %>%
  filter(month(date) == 1) %>%
  select(date, value = real_house_index) %>%
  mutate(variable = "real_index") %>%
  bind_rows(phillips %>%
              filter(variable %in% c("CUUR0000SEHA", "CPIAUCSL", "UNRATE")) %>%
              filter(month(date) == 1)) %>%
  spread(variable, value) %>%
  mutate(real_index = log(real_index) - lag(log(real_index), 1),
         rent_real = CUUR0000SEHA / CPIAUCSL,
         rent_real = log(rent_real) - lag(log(rent_real), 1),
         UNRATE = UNRATE / 100) %>%
  select(-CUUR0000SEHA, -CPIAUCSL) %>%
  gather(variable, value, -date) %>%
  mutate(variable_desc = case_when(variable == "rent_real" ~ "Rent inflation (rel. to overall CPI)",
                                   variable == "real_index" ~ "Real House Price inflation (Shiller's Index)",
                                   variable == "UNRATE" ~ "Unemployment Rate"))
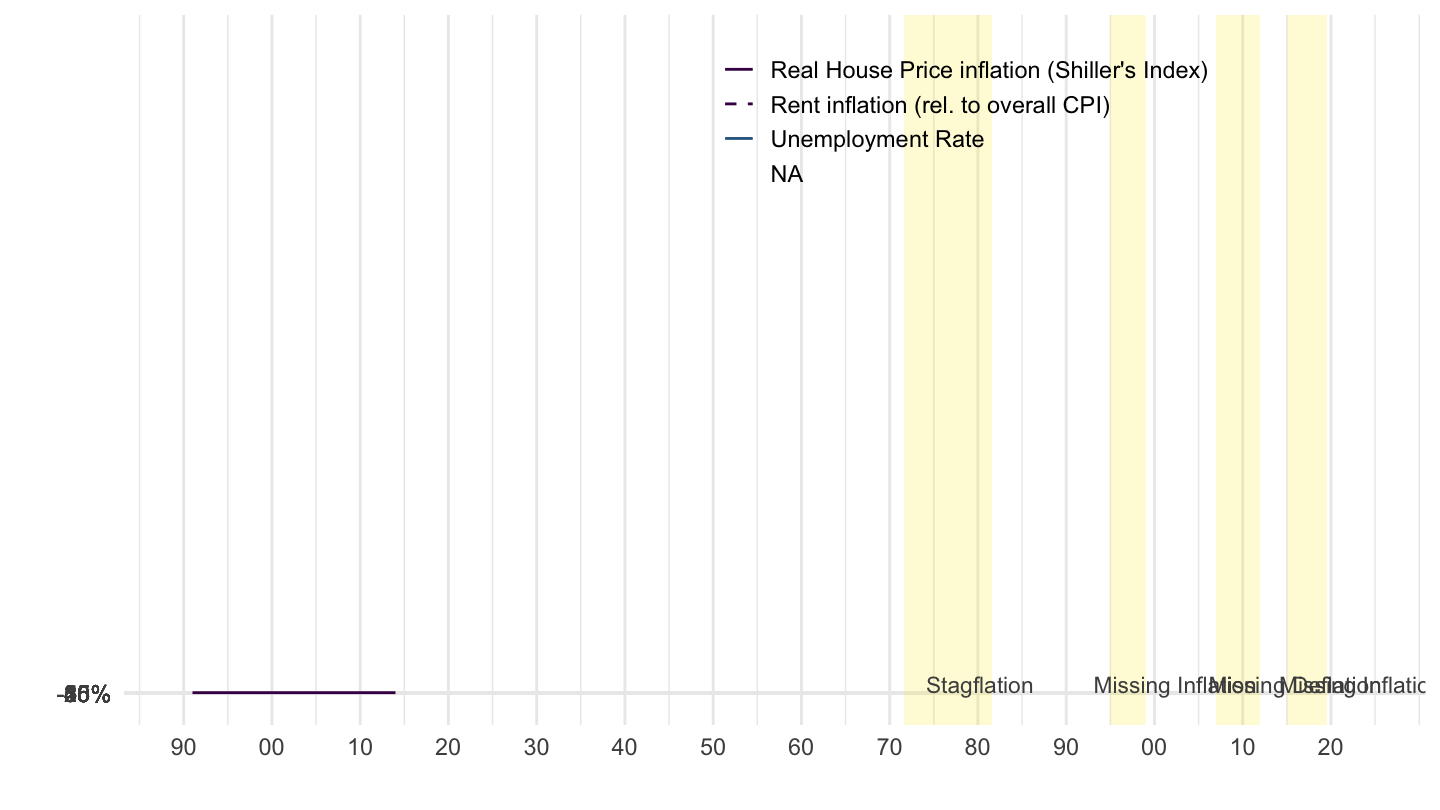
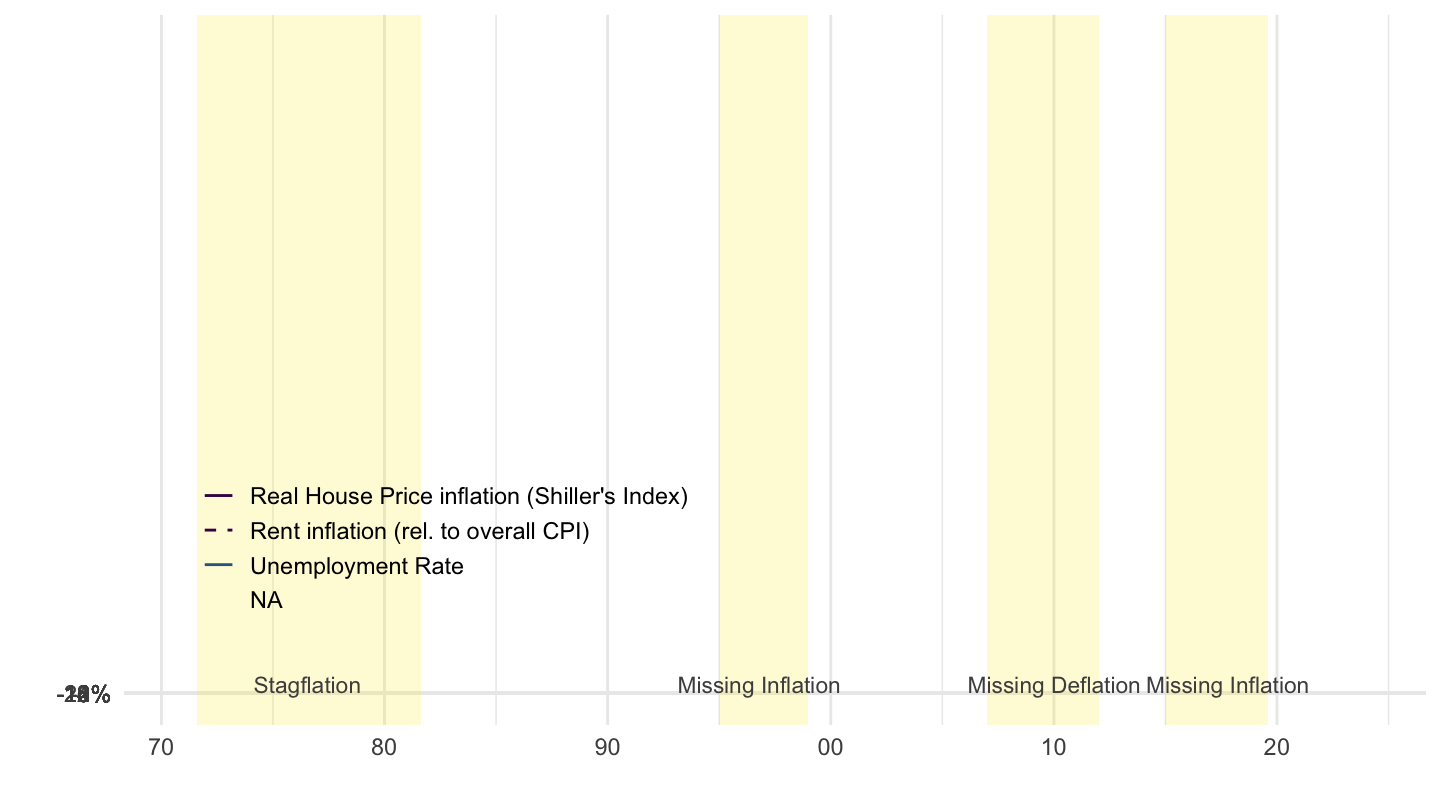
data %>%
  ggplot + geom_line(aes(x = date, y = value, color = variable_desc, linetype = variable_desc)) +
  ylab("") + xlab("") +
  theme_minimal() +
  scale_color_manual(values = c(viridis(4)[1], viridis(4)[1], viridis(4)[2])) +
  scale_linetype_manual(values = c("solid", "dashed", "solid")) +
  scale_x_date(breaks = seq(1700, 2025, 10) %>% paste0("-01-01") %>% as.Date,
               labels = date_format("%y")) +
  theme(legend.position = c(0.65, 0.85),
        legend.title = element_blank(),
        legend.key.size = unit(0.9, 'lines')) +
  scale_y_continuous(breaks = 0.01*seq(-20, 60, 5),
                     labels = scales::percent_format(accuracy = 1)) +
  geom_rect(data = data_frame(start = as.Date("1995-01-01"), 
                              end = as.Date("1999-01-01")),
            aes(xmin = start, xmax = end, ymin = -Inf, ymax = +Inf),
            fill = viridis(4)[4], alpha = 0.2) +
  geom_rect(data = data_frame(start = as.Date("1971-08-15"), 
                              end = as.Date("1981-08-15")),
            aes(xmin = start, xmax = end, ymin = -Inf, ymax = +Inf),
            fill = viridis(4)[4], alpha = 0.2) +
  geom_rect(data = data_frame(start = as.Date("2007-01-01"), 
                              end = as.Date("2012-01-01")),
            aes(xmin = start, xmax = end, ymin = -Inf, ymax = +Inf),
            fill = viridis(4)[4], alpha = 0.2) +
  geom_rect(data = data_frame(start = as.Date("2015-01-01"), 
                              end = as.Date("2019-08-01")),
            aes(xmin = start, xmax = end, ymin = -Inf, ymax = +Inf),
            fill = viridis(4)[4], alpha = 0.2) +
  geom_text(data = data_frame(start = c(1974, 1993, 2006, 2014) %>% paste0("-01-01") %>% as.Date, 
                              percent = c(-0.14,  -0.15, -0.14, -0.15),
                              name = c("Stagflation", "Missing Inflation", "Missing Deflation", "Missing Inflation")),
            aes(x = start, y = percent, label = name),
            size = 3, vjust = 0, hjust = 0, nudge_x = 50, color = grey(0.3))

1971 -

Code
data %>%
  filter(date >= as.Date("1971-01-01")) %>%
  ggplot + geom_line(aes(x = date, y = value, color = variable_desc, linetype = variable_desc)) +
  ylab("") + xlab("") +
  theme_minimal() +
  scale_color_manual(values = c(viridis(4)[1], viridis(4)[1], viridis(4)[2])) +
  scale_linetype_manual(values = c("solid", "dashed", "solid")) +
  scale_x_date(breaks = seq(1700, 2025, 10) %>% paste0("-01-01") %>% as.Date,
               labels = date_format("%y")) +
  theme(legend.position = c(0.25, 0.25),
        legend.title = element_blank(),
        legend.key.size = unit(0.9, 'lines')) +
  scale_y_continuous(breaks = 0.01*seq(-20, 20, 2),
                     labels = scales::percent_format(accuracy = 1)) +
  geom_rect(data = data_frame(start = as.Date("1995-01-01"), 
                              end = as.Date("1999-01-01")),
            aes(xmin = start, xmax = end, ymin = -Inf, ymax = +Inf),
            fill = viridis(4)[4], alpha = 0.2) +
  geom_rect(data = data_frame(start = as.Date("1971-08-15"), 
                              end = as.Date("1981-08-15")),
            aes(xmin = start, xmax = end, ymin = -Inf, ymax = +Inf),
            fill = viridis(4)[4], alpha = 0.2) +
  geom_rect(data = data_frame(start = as.Date("2007-01-01"), 
                              end = as.Date("2012-01-01")),
            aes(xmin = start, xmax = end, ymin = -Inf, ymax = +Inf),
            fill = viridis(4)[4], alpha = 0.2) +
  geom_rect(data = data_frame(start = as.Date("2015-01-01"), 
                              end = as.Date("2019-08-01")),
            aes(xmin = start, xmax = end, ymin = -Inf, ymax = +Inf),
            fill = viridis(4)[4], alpha = 0.2) +
  geom_text(data = data_frame(start = c(1974, 1993, 2006, 2014) %>% paste0("-01-01") %>% as.Date, 
                              percent = c(-0.14,  -0.15, -0.14, -0.15),
                              name = c("Stagflation", "Missing Inflation", "Missing Deflation", "Missing Inflation")),
            aes(x = start, y = percent, label = name),
            size = 3, vjust = 0, hjust = 0, nudge_x = 50, color = grey(0.3))