nber_recessions_extract <- nber_recessions %>%
filter(Peak >= as.Date("1871-01-01"))
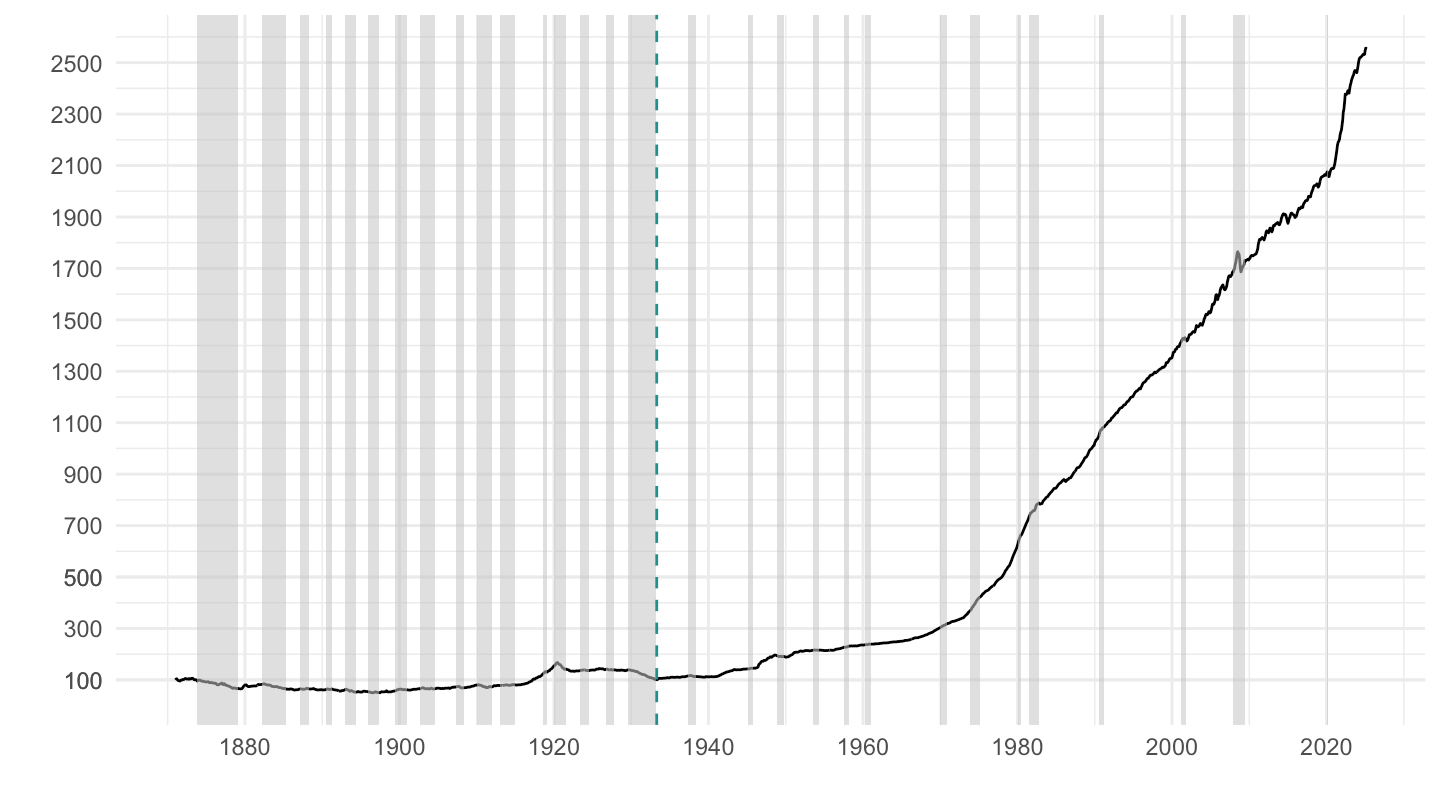
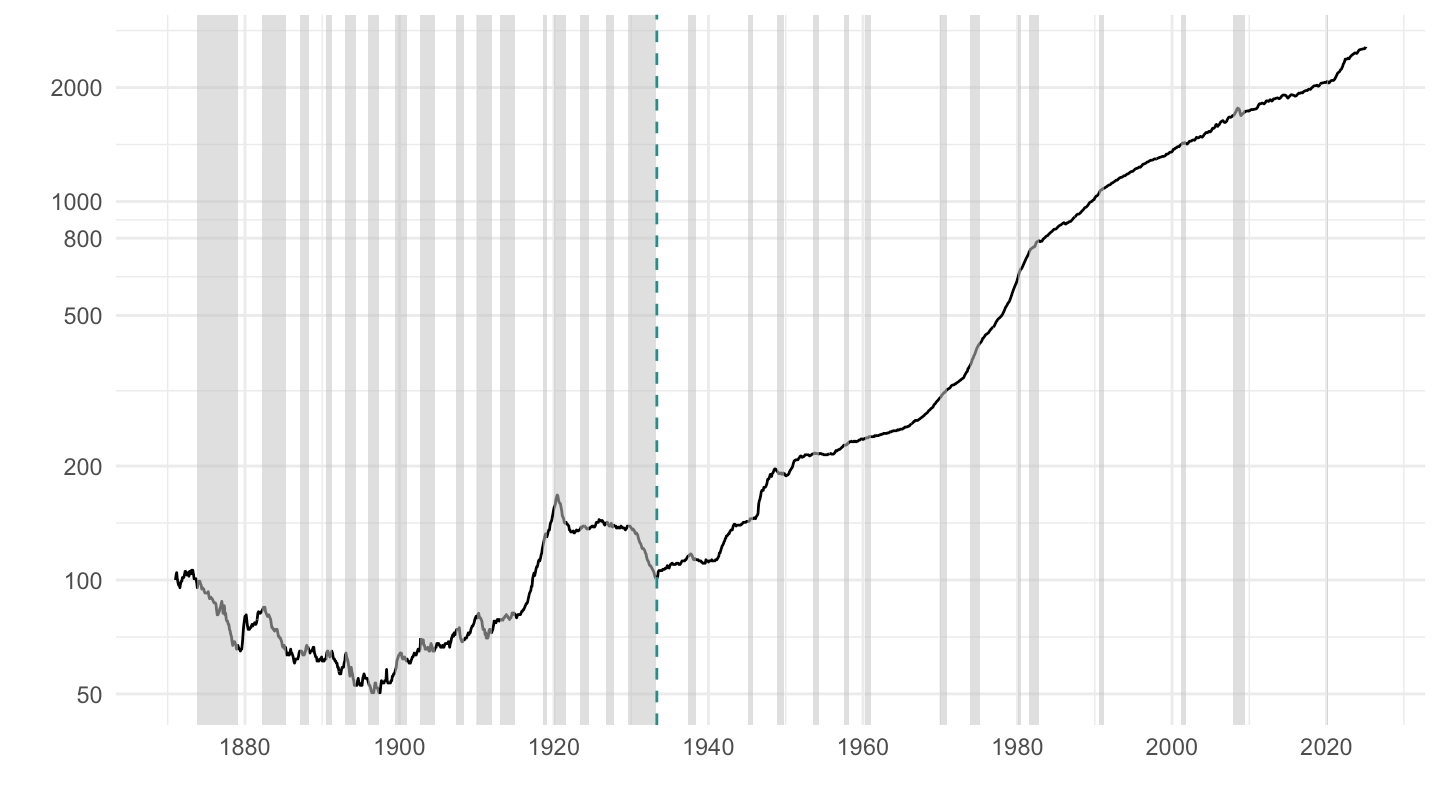
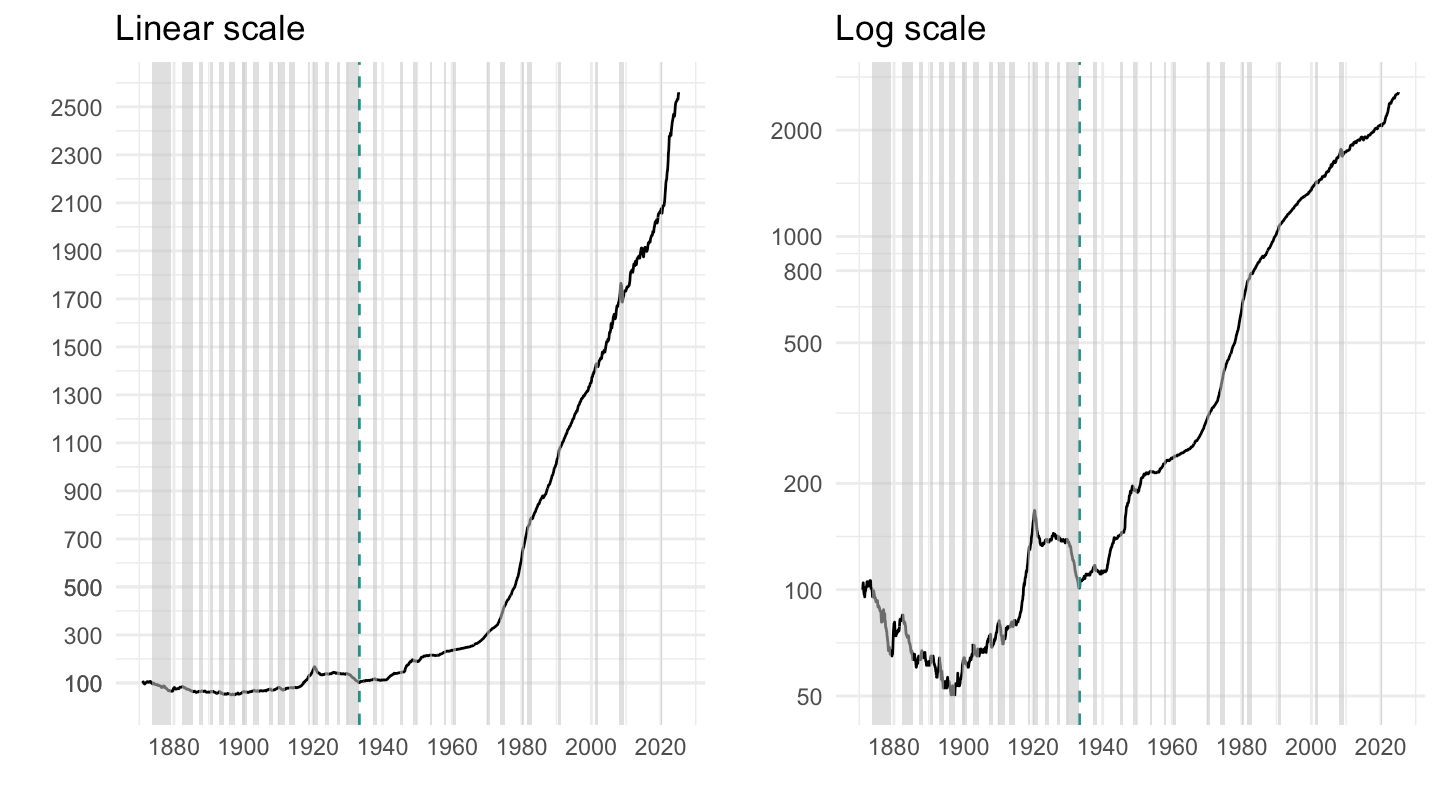
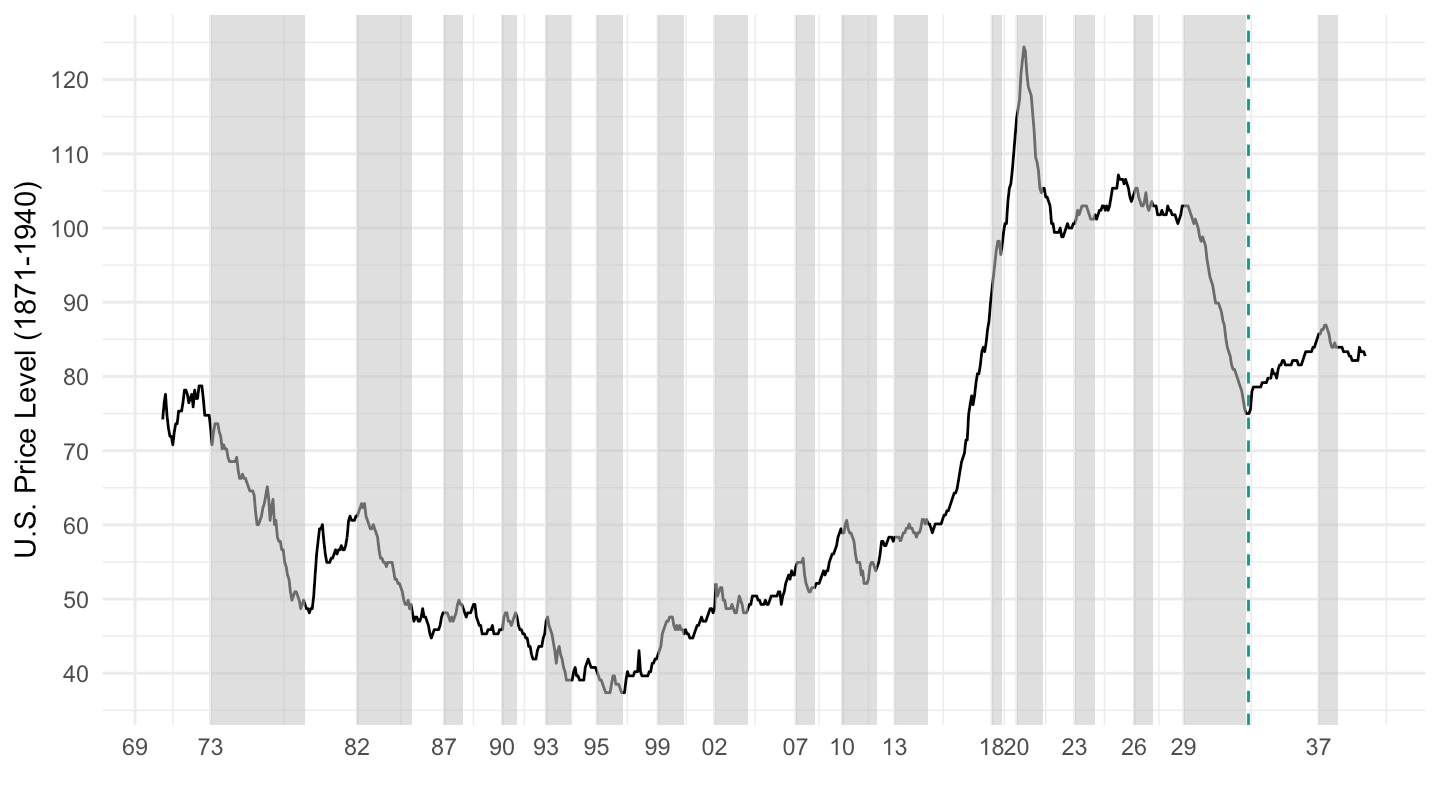
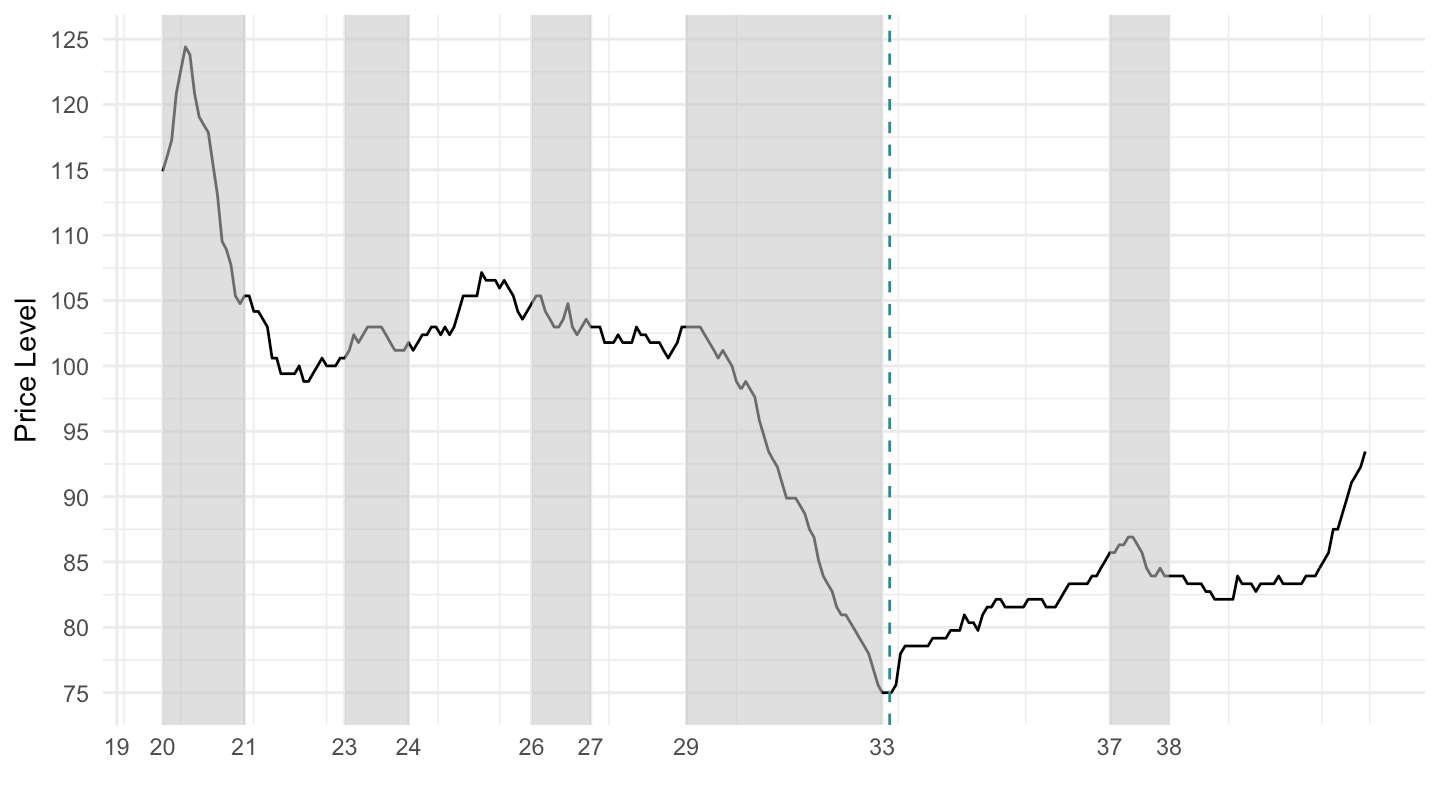
plot_linear <- cpi %>%
arrange(date) %>%
mutate(CPI = 100*CPI / CPI[1]) %>%
ggplot(.) + geom_line(aes(x = date, y = CPI)) +
ylab("") + theme_minimal() + xlab("") +
scale_x_date(breaks = as.Date(paste0(seq(1800, 2100, 20), "-01-01")),
labels = date_format("%Y")) +
geom_rect(data = nber_recessions_extract,
aes(xmin = Peak, xmax = Trough, ymin = -Inf, ymax = +Inf),
fill = 'grey', alpha = 0.5) +
scale_y_continuous(breaks = c(100, 500, seq(100, 5000, 200))) +
geom_vline(xintercept = as.Date("1933-04-20"), linetype = "dashed", color = viridis(3)[2])
plot_linear