Bank of England - BOE
Data
Example
Trade War
Trade War
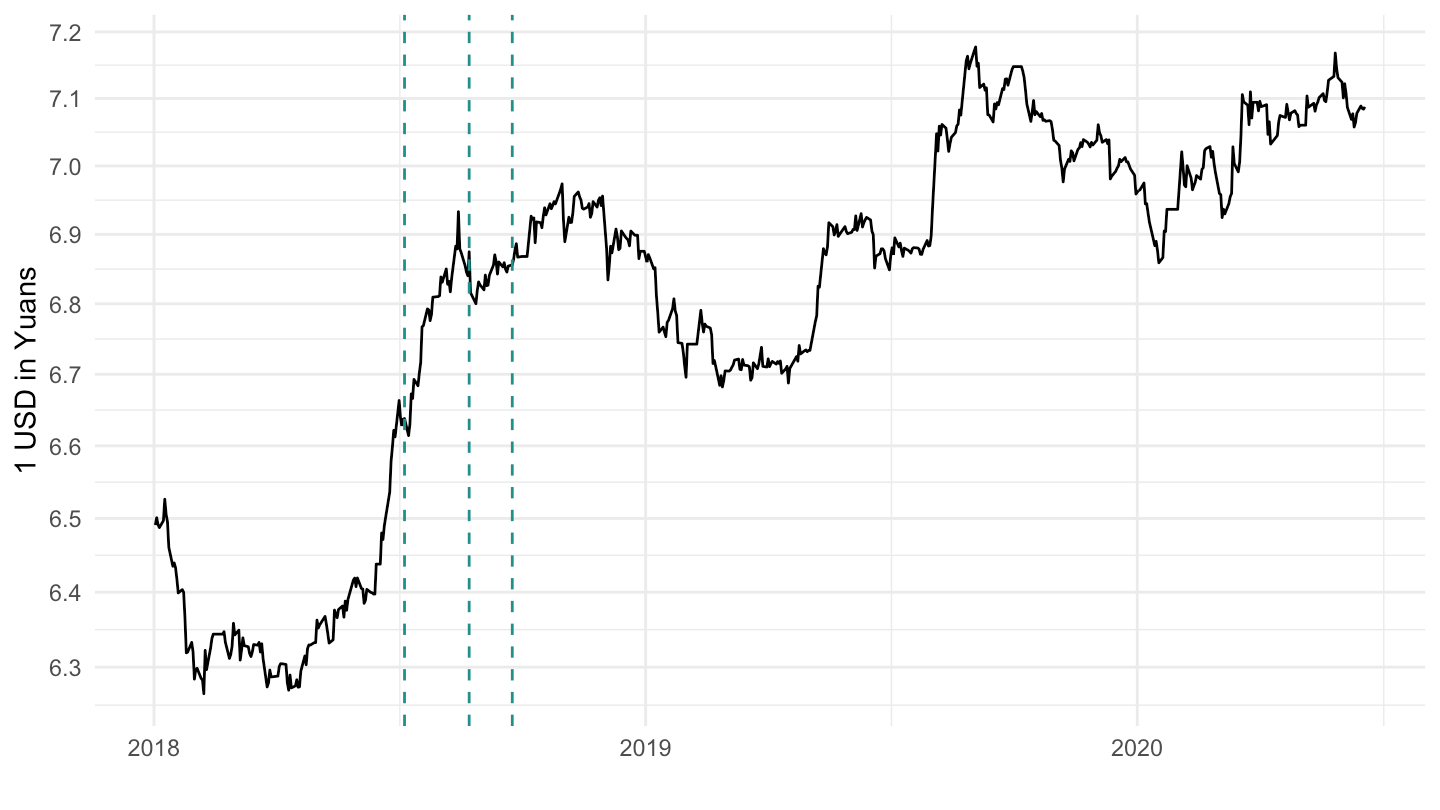
(ref:USD-CNY-trade-war) USD / Yuan Exchange Rate - Trade War
Code
BOE %>%
  filter(symbol %in% c("BOE/XUDLBK73")) %>%
  filter(date >= as.Date("2018-01-01")) %>%
  ggplot(.) + geom_line(aes(x = date, y = value)) +
  scale_x_date(breaks = "2 months",
               labels = date_format("%y-%m")) +
  scale_y_continuous(breaks = seq(6.2, 7, 0.1)) +
  xlab("") + ylab("1 USD in Yuans") +
  theme_minimal() +
  geom_vline(xintercept = as.Date("2018-07-06"), linetype = "dashed", color = "red") +
  geom_vline(xintercept = as.Date("2018-08-23"), linetype = "dashed", color = "red") +
  geom_vline(xintercept = as.Date("2018-09-24"), linetype = "dashed", color = "red")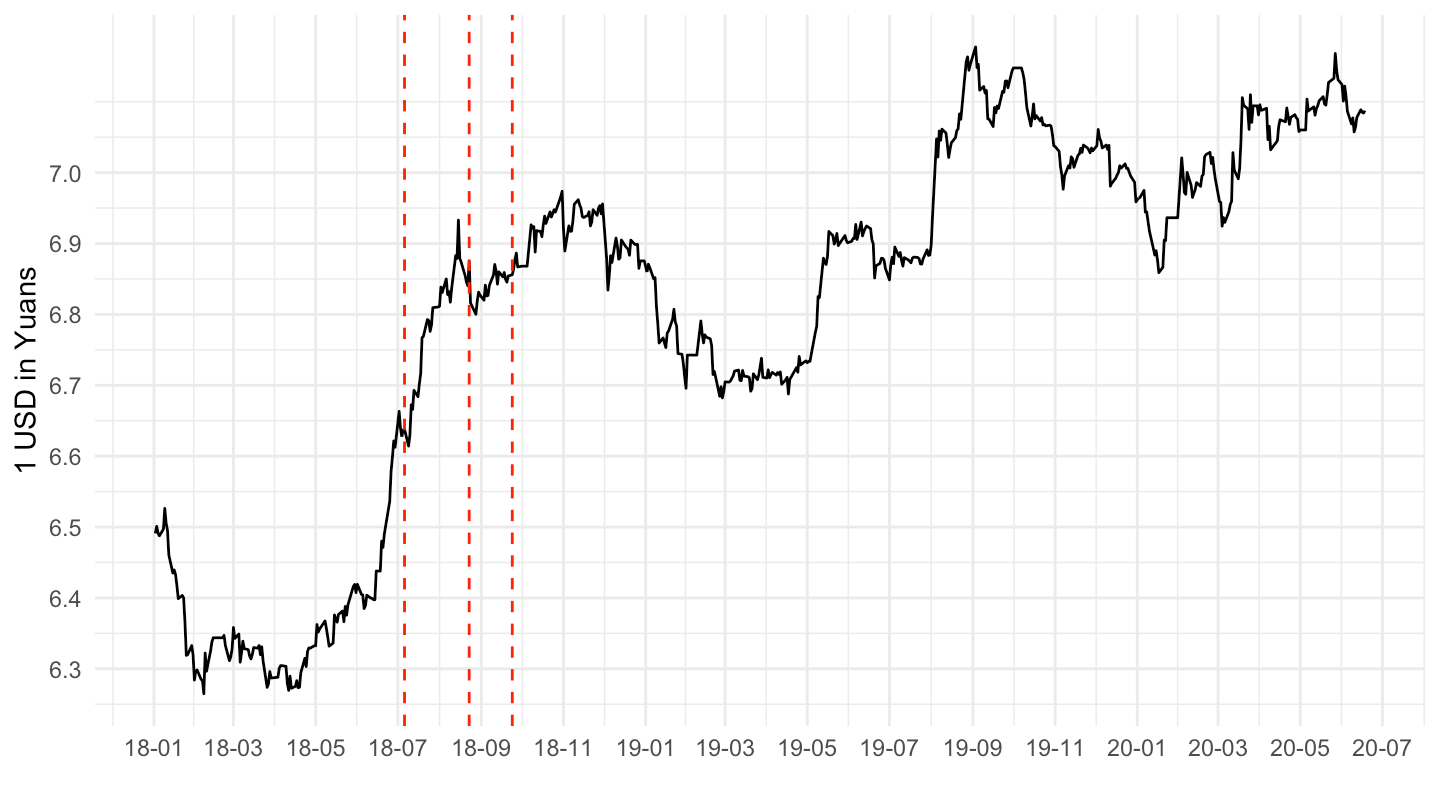
(ref:USD-CNY-16-20) USD / Yuan Exchange Rate (2016-2020)
Code
BOE %>%
  filter(symbol %in% c("BOE/XUDLBK73")) %>%
  filter(date >= as.Date("2018-01-01")) %>%
  ggplot(.) + geom_line(aes(x = date, y = value)) +
  scale_x_date(breaks = "year",
               labels = date_format("%Y")) +
  scale_y_log10(breaks = seq(6.2, 9, 0.1)) +
  xlab("") + ylab("1 USD in Yuans") +
  theme_minimal() +
  geom_vline(xintercept = as.Date("2018-07-06"), linetype = "dashed", color = viridis(3)[2]) +
  geom_vline(xintercept = as.Date("2018-08-23"), linetype = "dashed", color = viridis(3)[2]) +
  geom_vline(xintercept = as.Date("2018-09-24"), linetype = "dashed", color = viridis(3)[2])