Code
BCHAIN |>
  group_by(symbol) |>
  summarise(Nobs = n()) %>%
{if (is_html_output()) print_table(.) else .}| symbol | Nobs |
|---|---|
| BCHAIN/MKPRU | 4422 |
| BCHAIN/MKTCP | 4421 |
Data
BCHAIN |>
group_by(symbol) |>
summarise(Nobs = n()) %>%
{if (is_html_output()) print_table(.) else .}| symbol | Nobs |
|---|---|
| BCHAIN/MKPRU | 4422 |
| BCHAIN/MKTCP | 4421 |
BCHAIN |>
  filter(symbol == "BCHAIN/MKPRU",
         date >= as.Date("2020-04-01")) |>
  ggplot() + geom_line(aes(x = date, y = Value)) +
  theme_minimal() + xlab("") + ylab("Bitcoin Price") +
  scale_x_date(breaks ="1 month",
               labels = date_format("%b")) +
  scale_y_continuous(breaks = seq(0, 60000, 5000),
                     labels = dollar_format(ac = 1)) +
  scale_color_manual(values = viridis(3)[1:2]) +
  theme(legend.position = c(0.2, 0.9),
        legend.title = element_blank())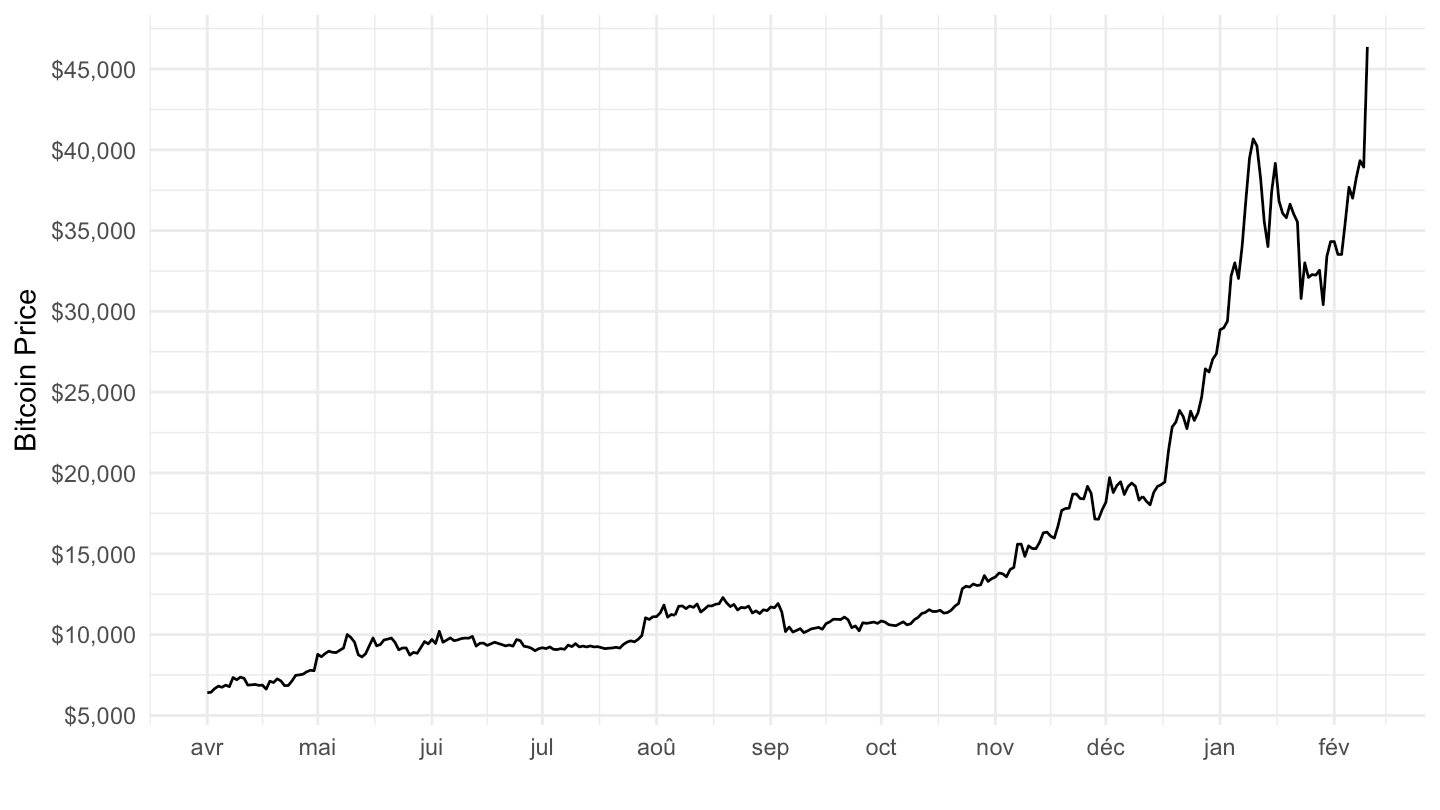
BCHAIN |>
  filter(symbol == "BCHAIN/MKTCP") |>
  ggplot() + geom_line(aes(x = date, y = Value/10^9)) +
  theme_minimal() + xlab("") + ylab("Capitalization of Bitcoin") +
  scale_x_date(breaks ="1 year",
               labels = date_format("%Y")) +
  scale_y_continuous(breaks = seq(0, 40000, 100),
                     labels = dollar_format(ac = 1, su = " Bn")) +
  scale_color_manual(values = viridis(3)[1:2]) +
  theme(legend.position = c(0.2, 0.9),
        legend.title = element_blank())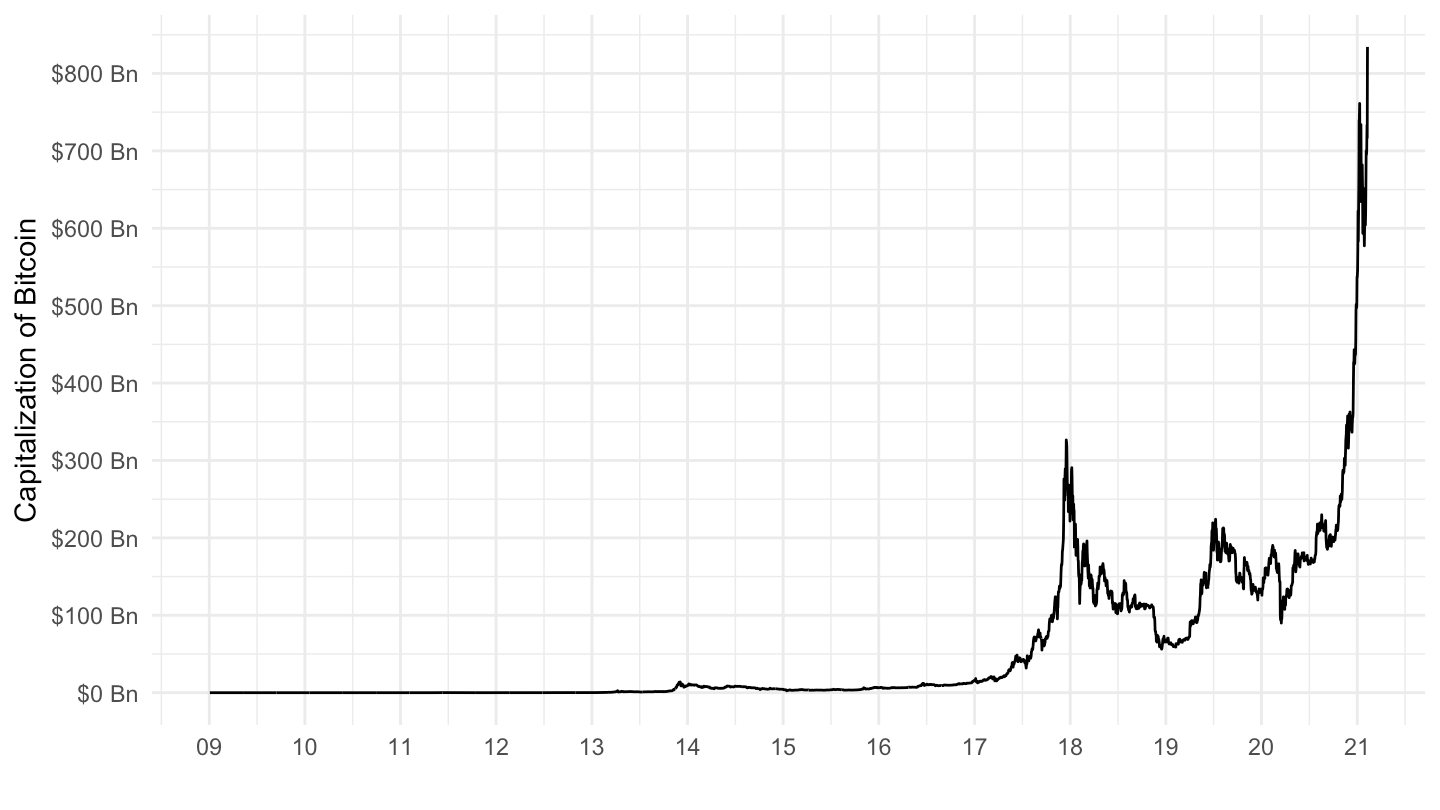
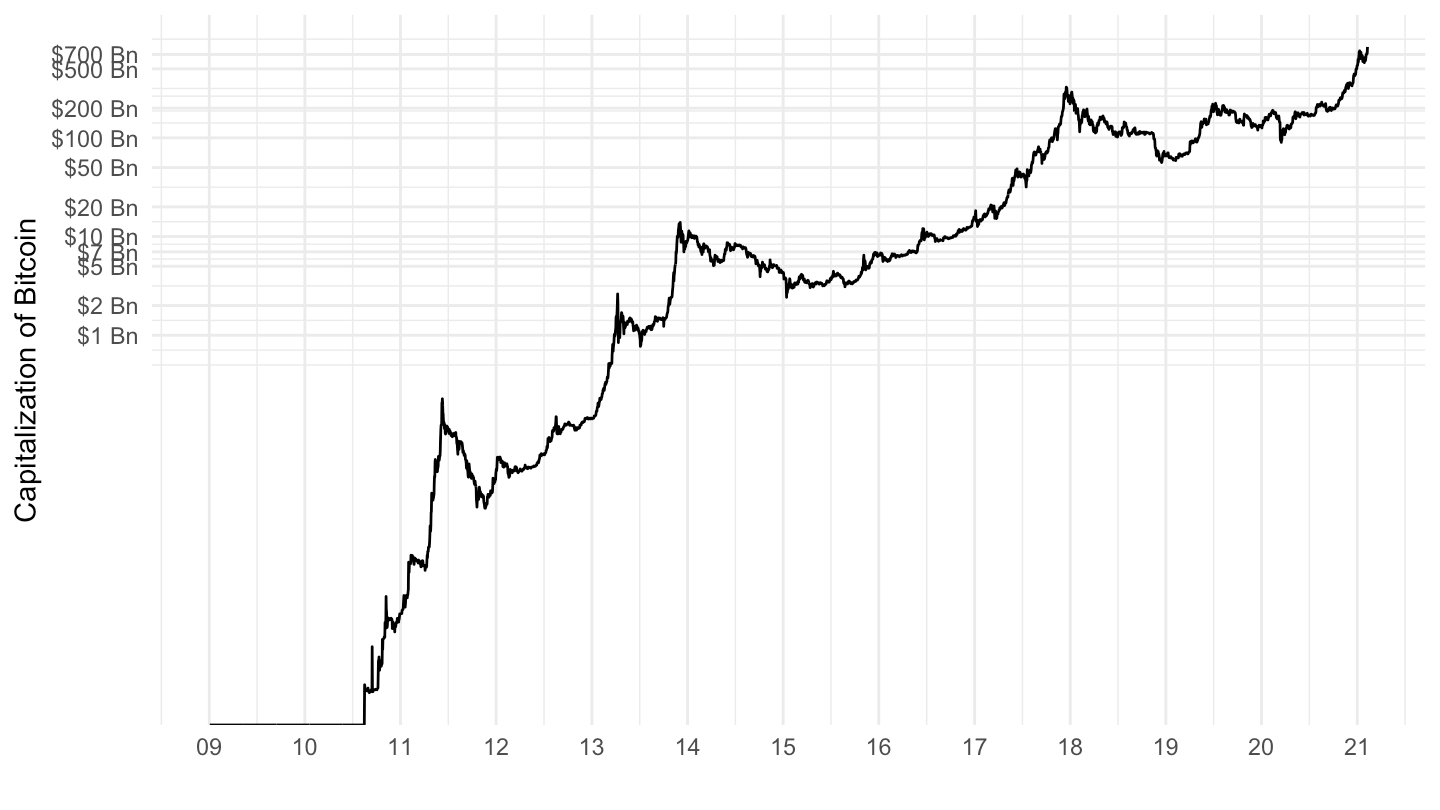
BCHAIN |>
  filter(symbol == "BCHAIN/MKTCP") |>
  ggplot() + geom_line(aes(x = date, y = Value/10^9)) +
  theme_minimal() + xlab("") + ylab("Capitalization of Bitcoin") +
  scale_x_date(breaks ="1 year",
               labels = date_format("%Y")) +
  scale_y_log10(breaks = c(1, 2, 5, 7, 10, 20, 50, 700, 100, 200, 500),
                     labels = dollar_format(ac = 1, su = " Bn")) +
  scale_color_manual(values = viridis(3)[1:2]) +
  theme(legend.position = c(0.2, 0.9),
        legend.title = element_blank())