Code
source (here:: here ("_rinit.R" ))source (here:: here ("data" , "paris" , "_paris.R" )) # arrondissements_sf() invisible (Sys.setlocale ("LC_TIME" , "fr_FR.UTF-8" ))# cd ~/iCloud/website/data/paris; /usr/local/bin/R -e 'quarto::quarto_render("indicateur-dlh-renovation.qmd")' :: opts_chunk$ set (echo = TRUE , message = FALSE , warning = FALSE ,fig.width = 8 , fig.height = 5 , dpi = 150 )<- here:: here ("data" , "paris" , "indicateur-dlh-renovation.parquet" )<- arrow:: read_parquet (reno_path) |> :: transmute (adresse = adresse_normalisee,ar = suppressWarnings (as.integer (substr (as.character (arrondissement), 4 , 5 ))),annee = as.integer (format (annee_de_vote_des_travaux, "%Y" )),n = nb_de_logts_finances<- nrow (reno)<- sum (reno$ n, na.rm = TRUE )<- arrondissements_sf ()<- theme_void (base_size = 12 ) + theme (plot.title = element_text (face = "bold" ),plot.subtitle = element_text (colour = "grey35" ),plot.margin = margin (5 , 12 , 5 , 5 ))<- theme_minimal (base_size = 12 ) + theme (plot.title = element_text (face = "bold" ),plot.subtitle = element_text (colour = "grey35" ),panel.grid.major.y = element_blank ())
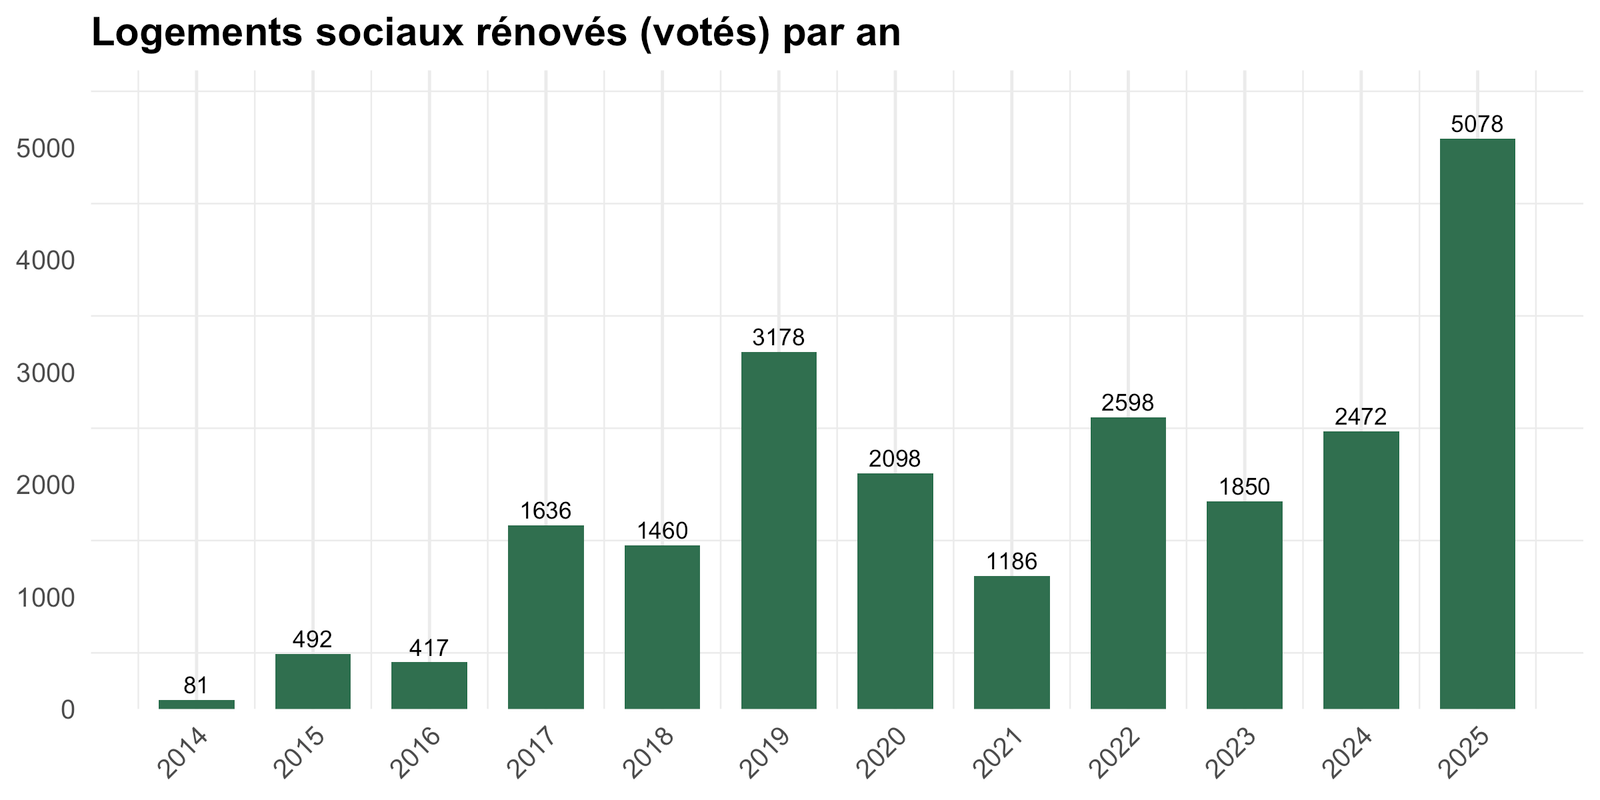
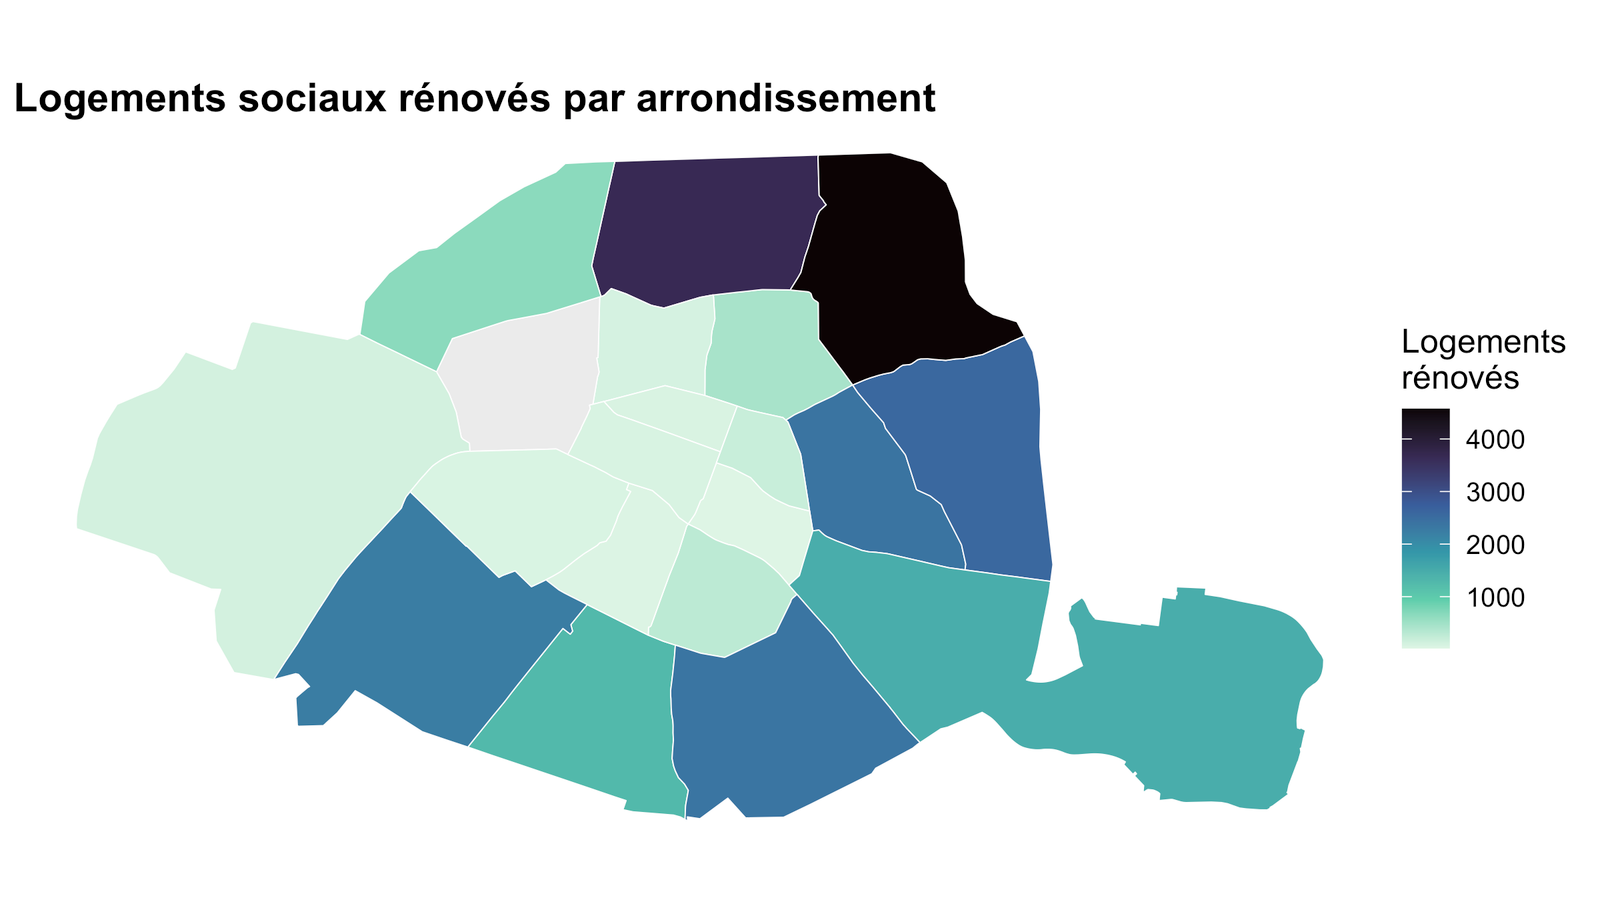
Suivi du programme « Éco Rénovons Paris + » : les opérations de rénovation énergétique de logements sociaux votées, adresse par adresse. 339 opérations entre 2014 et 2025, pour 22 546 logements rénovés au total.
Code
|> :: arrange (dplyr:: desc (n)) |> :: transmute (Adresse = adresse, Arrondissement = ar, Année = annee, Logements = n) |> head (8 ) |> :: gt () |> :: tab_header (title = "8 plus grandes opérations" ) |> :: tab_options (table.width = "100%" )
Adresse
Arrondissement
Année
Logements
8 RUE GUSTAVE ROUANET
18
2022
1037
14 RUE DE THIONVILLE
19
2025
450
147 RUE OBERKAMPF
11
2025
435
17-27BIS RUE VAUVENARGUES
18
2019
430
66 AVENUE D'IVRY
13
2020
408
21-25 QUAI ANDRE CITROEN
15
2021
329
26-36 RUE DE FONTARABIE
20
2019
316
34 BOULEVARD DE GRENELLE
15
2022
285
Évolution
Code
|> :: group_by (annee) |> :: summarise (n = sum (n, na.rm = TRUE ), operations = dplyr:: n (), .groups = "drop" ) |> ggplot (aes (annee, n)) + geom_col (fill = "#2f6f4f" , width = 0.65 ) + geom_text (aes (label = n), vjust = - 0.4 , size = 3 ) + scale_x_continuous (breaks = scales:: breaks_width (1 )) + scale_y_continuous (expand = expansion (mult = c (0 , 0.12 ))) + labs (title = "Logements sociaux rénovés (votés) par an" , x = NULL , y = NULL ) + + theme (axis.text.x = element_text (angle = 45 , hjust = 1 ))
Par arrondissement
Code
<- reno |> dplyr:: filter (! is.na (ar)) |> dplyr:: group_by (ar) |> :: summarise (n = sum (n, na.rm = TRUE ), .groups = "drop" )|> :: left_join (cnt, by = c ("c_ar" = "ar" )) |> ggplot () + geom_sf (aes (fill = n), colour = "white" , linewidth = 0.2 ) + scale_fill_viridis_c (option = "mako" , direction = - 1 , na.value = "grey92" , name = "Logements \n rénovés" ) + labs (title = "Logements sociaux rénovés par arrondissement" ) +
Toutes les opérations
Code
|> :: arrange (dplyr:: desc (annee), dplyr:: desc (n)) |> :: transmute (Adresse = adresse, Arrondissement = ar, Année = annee, Logements = n) |> :: reactable (searchable = TRUE ,filterable = TRUE ,pagination = TRUE ,defaultPageSize = 20 ,compact = TRUE ,resizable = TRUE ,highlight = TRUE ,wrap = TRUE ,defaultColDef = reactable:: colDef (align = "left" ,headerStyle = list (fontWeight = "bold" ),style = list (whiteSpace = "normal" , wordBreak = "break-word" )columns = list (Adresse = reactable:: colDef (minWidth = 220 ),Arrondissement = reactable:: colDef (minWidth = 90 , maxWidth = 130 ),= reactable:: colDef (minWidth = 70 , maxWidth = 90 ),Logements = reactable:: colDef (minWidth = 90 , maxWidth = 120 , align = "right" )
Source & données
Code
:: tibble (` ` = c ("Jeu de données" , "Producteur" , "Licence" , "Fichier" , "Mise à jour" , "Observations" ),` ` = c ("[Rénovation du logement social](https://opendata.paris.fr/explore/dataset/indicateur-dlh-renovation/information/)" ,"Direction du Logement et de l'Habitat (DLH) — Ville de Paris" ,"Open Database License (ODbL)" ,sprintf ("`data/paris/indicateur-dlh-renovation.parquet` (%s ko) + `arrondissements.parquet`" ,round (file.size (reno_path) / 1024 )),format (as.Date (file.mtime (reno_path)), "%d %B %Y" ),sprintf ("%d opérations, %s logements, %d-%d" , n_operations, format (n_logements, big.mark = " " ),min (reno$ annee), max (reno$ annee))|> :: gt () |> gt:: fmt_markdown (columns = ` ` ) |> :: tab_options (table.width = "100%" , column_labels.hidden = TRUE )
Jeu de données
Rénovation du logement social
Producteur
Direction du Logement et de l’Habitat (DLH) — Ville de Paris
Licence
Open Database License (ODbL)
Fichier
data/paris/indicateur-dlh-renovation.parquet (7 ko) + arrondissements.parquet
Mise à jour
09 octobre 2026
Observations
339 opérations, 22 546 logements, 2014-2025