Code
source (here:: here ("_rinit.R" ))source (here:: here ("data" , "paris" , "_paris.R" )) # wkb2sfc(), paris_basemap(), arrondissements_sf() invisible (Sys.setlocale ("LC_TIME" , "fr_FR.UTF-8" ))# cd ~/iCloud/website/data/paris; /usr/local/bin/R -e 'quarto::quarto_render("chantiers-perturbants.qmd")' :: opts_chunk$ set (echo = TRUE , message = FALSE , warning = FALSE ,fig.width = 8 , fig.height = 5 , dpi = 150 )<- here:: here ("data" , "paris" , "chantiers-perturbants.parquet" )<- arrow:: read_parquet (ch_path) |> :: mutate (ar = suppressWarnings (as.integer (substr (cp_arrondissement, 4 , 5 ))))<- nrow (chantiers)<- arrondissements_sf ()<- chantiers |> :: filter (lengths (geo_point_2d) > 0 ) |> # 1 chantier sans localisation :: mutate (geometry = wkb2sfc (geo_point_2d)) |> :: st_as_sf (crs = 4326 )<- theme_void (base_size = 12 ) + theme (plot.title = element_text (face = "bold" ),plot.subtitle = element_text (colour = "grey35" ),plot.margin = margin (5 , 12 , 5 , 5 ))<- theme_minimal (base_size = 12 ) + theme (plot.title = element_text (face = "bold" ),plot.subtitle = element_text (colour = "grey35" ),panel.grid.major.y = element_blank ())
Les 120 grands chantiers ayant un impact notable sur la circulation — réseaux de chaleur (CPCU/Fraîcheur de Paris), RATP, RTE, SNCF, Eau de Paris… — avec leur emprise, leurs dates prévisionnelles (certaines courent jusqu’en 2031) et leur impact sur la voirie.
Code
|> :: arrange (dplyr:: desc (date_debut)) |> :: transmute (Voie = voie, Arrondissement = ar, ` Maître d'ouvrage ` = maitre_ouvrage,Objet = objet, Début = date_debut, Fin = date_fin,` Impact circulation ` = impact_circulation) |> head (8 ) |> :: gt () |> :: sub_missing (missing_text = "—" ) |> :: tab_header (title = "8 chantiers les plus récemment ouverts" ) |> :: tab_options (table.width = "100%" )
Voie
Arrondissement
Maître d'ouvrage
Objet
Début
Fin
Impact circulation
77rue de Maubeuge au Boulevard de Magenta
10
Fraicheur de Paris
CREATION_RESEAUX
2027-10-04
2027-02-01
RESTREINTE
22-24 quai d'Austerlitz
13
—
REHABILITATION_IMMEUBLE
2027-03-29
2027-11-26
RESTREINTE
boulevard du Palais 75004_
4
APIJ
REHABILITATION_IMMEUBLE
2026-11-16
2031-03-31
RESTREINTE
rue de Maubeuge (67 au 75)
10
Fraicheur de Paris
CREATION_RESEAUX
2026-11-16
2026-12-14
RESTREINTE
avenue Victor Hugo
16
Fraîcheur de Paris
RACCORDEMENT_RESEAU
2026-11-16
2026-11-27
RESTREINTE
rue de Vaugirard 75006_
6
Sénat
REHABILITATION_IMMEUBLE
2026-11-13
2027-08-31
RESTREINTE
avenue du Maine 75014
14
Eau de Paris
ENTRETIEN_RESEAU
2026-11-12
2026-12-18
RESTREINTE
avenue Victor Hugo
16
Fraîcheur de Paris
RACCORDEMENT_RESEAU
2026-11-09
2026-12-18
RESTREINTE
Carte
Code
<- leaflet:: colorFactor ("Set1" , domain = chantiers$ impact_circulation):: leaflet (pts_sf, options = leaflet:: leafletOptions (minZoom = 11 )) |> paris_basemap () |> :: addPolygons (data = arr_sf, fill = FALSE , color = "#999" , weight = 1 ) |> :: addCircleMarkers (radius = 6 , stroke = FALSE , fillOpacity = 0.8 ,fillColor = ~ pal (impact_circulation),label = ~ sprintf ("%s — %s" , voie, maitre_ouvrage),popup = ~ sprintf ("<b>%s</b><br>%s<br>%s<br>Du %s au %s<br>Impact : %s" ,format (date_debut, "%d/%m/%Y" ),format (date_fin, "%d/%m/%Y" ), impact_circulation)|> :: addLegend ("bottomright" , pal = pal, values = ~ impact_circulation,title = "Impact circulation" , opacity = 0.9 )
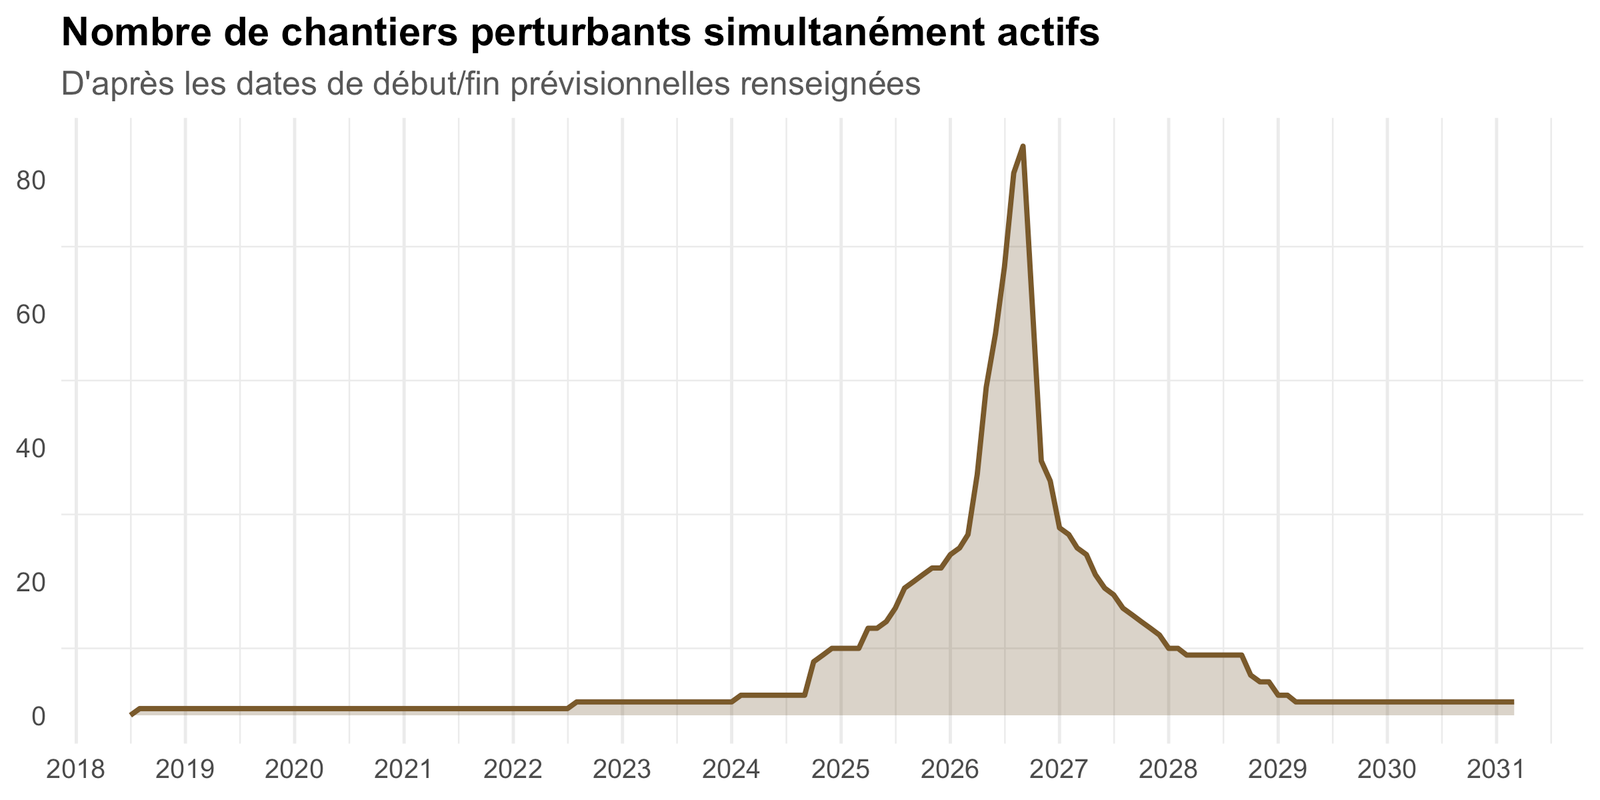
Combien de chantiers en même temps
Code
<- seq (as.Date (cut (min (chantiers$ date_debut, na.rm = TRUE ), "month" )),as.Date (cut (max (chantiers$ date_fin, na.rm = TRUE ), "month" )), by = "month" )<- vapply (mois_seq, function (m)sum (chantiers$ date_debut <= m & chantiers$ date_fin >= m, na.rm = TRUE ), integer (1 )):: tibble (mois = mois_seq, n = n_actifs) |> ggplot (aes (mois, n)) + geom_area (fill = "#7a5a2b" , alpha = 0.3 ) + geom_line (colour = "#7a5a2b" , linewidth = 0.9 ) + scale_x_date (date_labels = "%Y" , date_breaks = "1 year" ) + labs (title = "Nombre de chantiers perturbants simultanément actifs" ,subtitle = "D'après les dates de début/fin prévisionnelles renseignées" ,x = NULL , y = NULL ) +
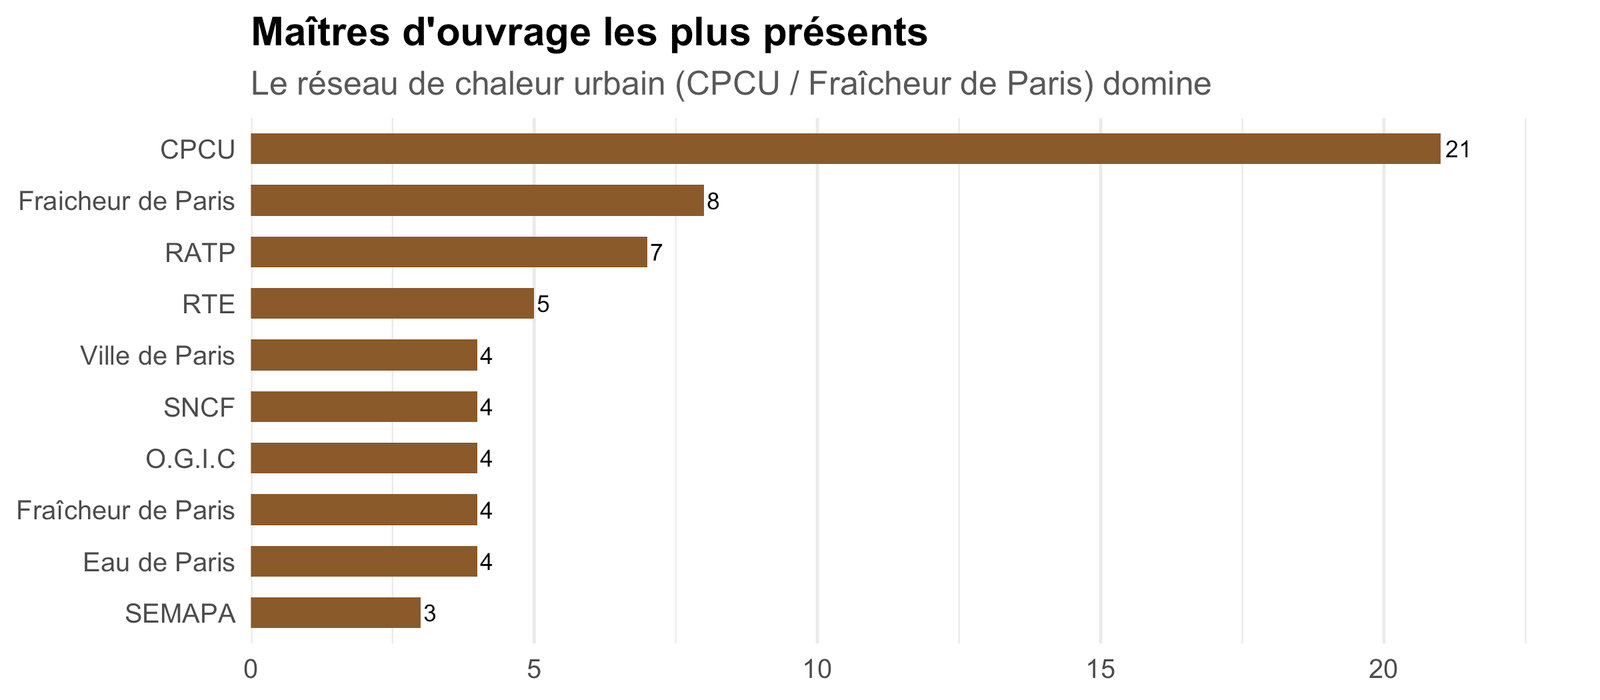
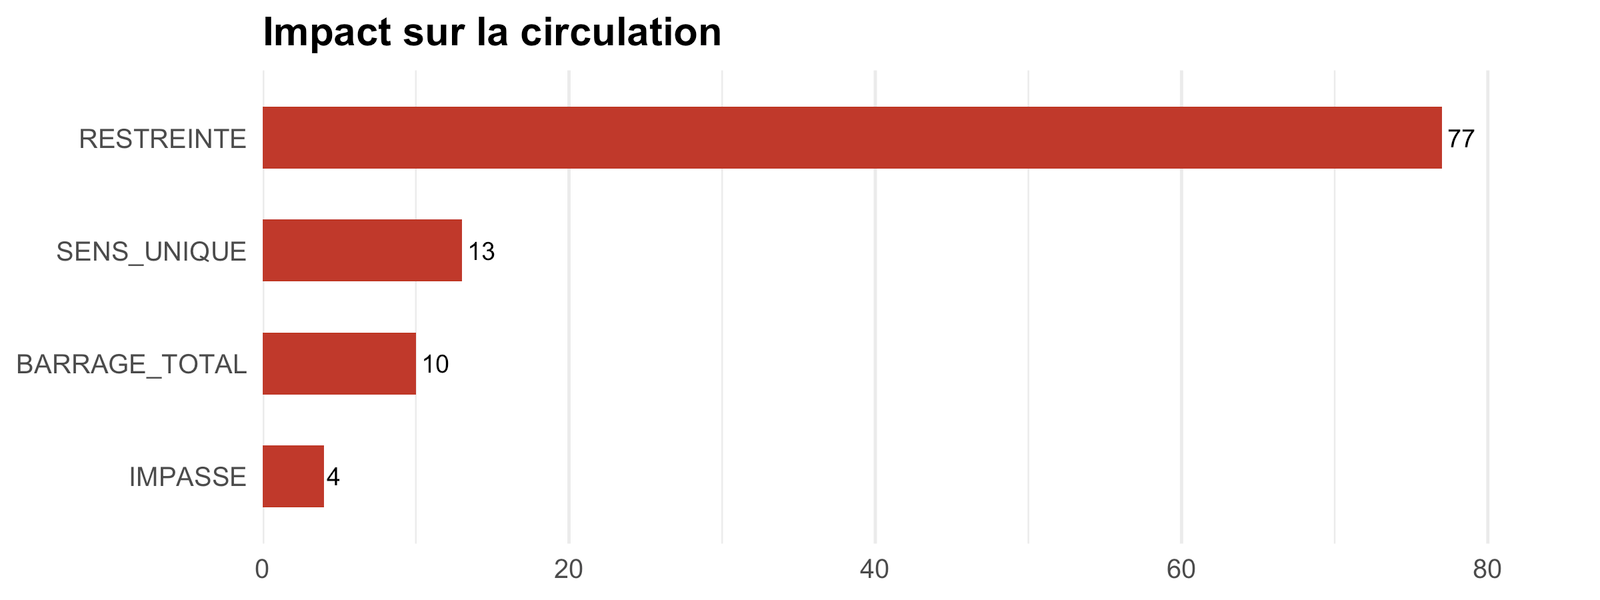
Qui creuse, et où
Code
|> :: filter (! is.na (maitre_ouvrage)) |> :: count (maitre_ouvrage, sort = TRUE ) |> head (10 ) |> :: mutate (maitre_ouvrage = forcats:: fct_reorder (maitre_ouvrage, n)) |> ggplot (aes (n, maitre_ouvrage)) + geom_col (fill = "#8a5a2b" , width = 0.6 ) + geom_text (aes (label = n), hjust = - 0.2 , size = 3 ) + scale_x_continuous (expand = expansion (mult = c (0 , 0.12 ))) + labs (title = "Maîtres d'ouvrage les plus présents" ,subtitle = "Le réseau de chaleur urbain (CPCU / Fraîcheur de Paris) domine" ,x = NULL , y = NULL ) +
Code
|> :: filter (! is.na (impact_circulation)) |> :: count (impact_circulation, sort = TRUE ) |> :: mutate (impact_circulation = forcats:: fct_reorder (impact_circulation, n)) |> ggplot (aes (n, impact_circulation)) + geom_col (fill = "#c0392b" , width = 0.55 ) + geom_text (aes (label = n), hjust = - 0.2 , size = 3.2 ) + scale_x_continuous (expand = expansion (mult = c (0 , 0.12 ))) + labs (title = "Impact sur la circulation" , x = NULL , y = NULL ) +
Le jeu de données porte aussi des codes niveau_perturbation, statut et typologie — non documentés par la source (pas de légende publiée dans le catalogue ODS), donc non repris ici pour éviter d’en inventer le sens.
Tous les chantiers
Code
|> :: arrange (date_debut) |> :: transmute (Voie = voie, Arrondissement = ar, ` Maître d'ouvrage ` = maitre_ouvrage,Objet = objet, Début = date_debut, Fin = date_fin,` Impact ` = impact_circulation) |> :: reactable (searchable = TRUE ,filterable = TRUE ,pagination = TRUE ,defaultPageSize = 20 ,compact = TRUE ,resizable = TRUE ,highlight = TRUE ,wrap = TRUE ,defaultColDef = reactable:: colDef (align = "left" ,headerStyle = list (fontWeight = "bold" ),style = list (whiteSpace = "normal" , wordBreak = "break-word" )columns = list (Voie = reactable:: colDef (minWidth = 160 ),Arrondissement = reactable:: colDef (minWidth = 70 , maxWidth = 110 ),` Maître d'ouvrage ` = reactable:: colDef (minWidth = 130 ),Objet = reactable:: colDef (minWidth = 130 ),= reactable:: colDef (minWidth = 90 , maxWidth = 110 ),Fin = reactable:: colDef (minWidth = 90 , maxWidth = 110 ),Impact = reactable:: colDef (minWidth = 100 )
Source & données
Code
:: tibble (` ` = c ("Jeu de données" , "Producteur" , "Licence" , "Fichier" , "Mise à jour" , "Observations" ),` ` = c ("[Chantiers perturbants](https://opendata.paris.fr/explore/dataset/chantiers-perturbants/information/)" ,"Direction de la Voirie et des Déplacements — Ville de Paris" ,"Open Database License (ODbL)" ,sprintf ("`data/paris/chantiers-perturbants.parquet` (%s ko) + `arrondissements.parquet`" ,round (file.size (ch_path) / 1024 )),format (as.Date (file.mtime (ch_path)), "%d %B %Y" ),sprintf ("%d chantiers, %s à %s" , n_tot, format (min (chantiers$ date_debut, na.rm = TRUE ), "%Y" ),format (max (chantiers$ date_fin, na.rm = TRUE ), "%Y" ))|> :: gt () |> gt:: fmt_markdown (columns = ` ` ) |> :: tab_options (table.width = "100%" , column_labels.hidden = TRUE )
Jeu de données
Chantiers perturbants
Producteur
Direction de la Voirie et des Déplacements — Ville de Paris
Licence
Open Database License (ODbL)
Fichier
data/paris/chantiers-perturbants.parquet (31 ko) + arrondissements.parquet
Mise à jour
09 octobre 2026
Observations
120 chantiers, 2018 à 2031