Last data update: 05 oct. 2026, 00:49
Last compile: 05 oct. 2026, 00:49
twitch_leak |>
  filter(Rank <= 200) |>
  ggplot() + theme_minimal() + xlab("Gross Earning") + ylab("Rank") +
  geom_point(aes(x = GrossEarning / 1000000, y = Rank)) +
  scale_x_log10(breaks = 0.001*c(250, 800, 1000, 1500, 2000, 3000, 4000, 6000, 8000),
                labels = dollar_format(accuracy = .1, suffix = "M")) +
  scale_y_log10(breaks = c(1, 2, 4, 8, 16, 32, 64, 100, 200))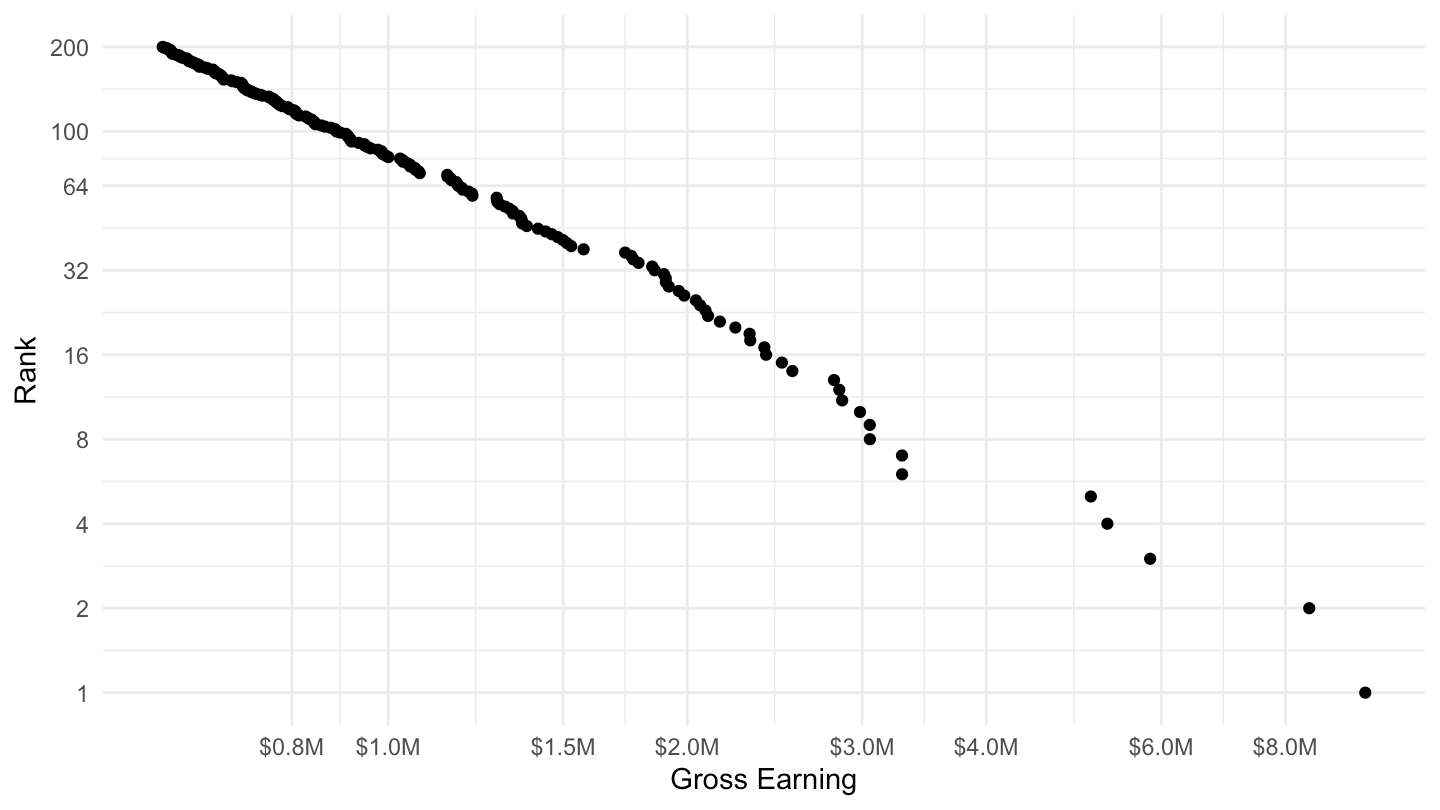
fit1 <- twitch_leak |>
  filter(Rank <= 200) %>%
  lm(log(Rank) ~ log(GrossEarning / 1000000), data = .)

summ(fit1)| Observations | 200 |
| Dependent variable | log(Rank) |
| Type | OLS linear regression |
| F(1,198) | 29214.72 |
| R² | 0.99 |
| Adj. R² | 0.99 |
| Est. | S.E. | t val. | p | |
|---|---|---|---|---|
| (Intercept) | 4.39 | 0.01 | 788.91 | 0.00 |
| log(GrossEarning/1e+06) | -1.79 | 0.01 | -170.92 | 0.00 |
| Standard errors: OLS |
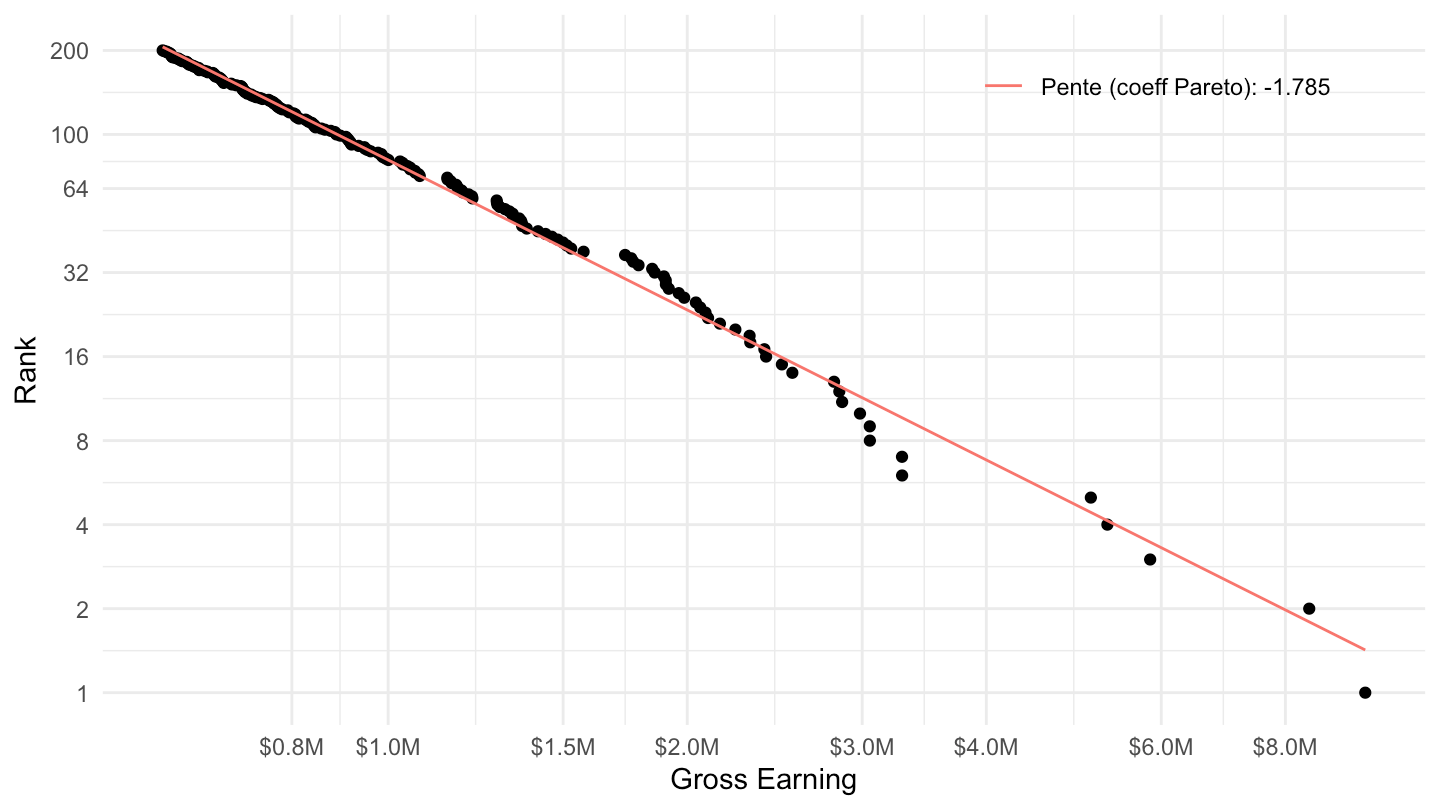
twitch_leak |>
  filter(Rank <= 200) |>
  ggplot() + theme_minimal() + xlab("Gross Earning") + ylab("Rank") +
  geom_point(aes(x = GrossEarning / 1000000, y = Rank)) +
  scale_x_log10(breaks = 0.001*c(250, 800, 1000, 1500, 2000, 3000, 4000, 6000, 8000),
                labels = dollar_format(accuracy = .1, suffix = "M")) +
  scale_y_log10(breaks = c(1, 2, 4, 8, 16, 32, 64, 100, 200)) +
  geom_function(aes(colour = paste0("Pente (coeff Pareto): ", round(fit1$coefficients[2],3))), fun = function(x) exp(fit1$coefficients[1] + fit1$coefficients[2]*log(x))) +
  theme(legend.position = c(0.8, 0.9),
        legend.title = element_blank())