Code
TABLE_III1_var %>%
  pluck("SCHED") %>%
{if (is_html_output()) print_table(.) else .}| id | label |
|---|---|
| SCHED_01 | 1 |
| SCHED_02 | 2 |
| SCHED_03 | 3 |
Data - OECD
TABLE_III1_var %>%
pluck("SCHED") %>%
{if (is_html_output()) print_table(.) else .}| id | label |
|---|---|
| SCHED_01 | 1 |
| SCHED_02 | 2 |
| SCHED_03 | 3 |
TABLE_III1_var %>%
  pluck("TAX_BASE") %>%
{if (is_html_output()) print_table(.) else .}| id | label |
|---|---|
| WGE | Weekly gross earnings |
| MGE | Monthly gross earnings |
| AGE | Annual gross earnings |
| TY | Taxable income measured for central government tax purposes |
| TYS | Taxable income modified for sub-central government purposes |
TABLE_III1_var %>%
  pluck("RATE_THRESH") %>%
{if (is_html_output()) print_table(.) else .}| id | label |
|---|---|
| LUMP_SUM | Lump sum charge |
| 01_MR | 01 Marginal rate |
| 01_LOW_TH | 01 Lower threshold |
| 01_UP_TH | 01 Upper threshold |
| 02_MR | 02 Marginal rate |
| 02_LOW_TH | 02 Lower threshold |
| 02_UP_TH | 02 Upper threshold |
| 03_MR | 03 Marginal rate |
| 03_LOW_TH | 03 Lower threshold |
| 03_UP_TH | 03 Upper threshold |
| 04_MR | 04 Marginal rate |
| 04_LOW_TH | 04 Lower threshold |
| 04_UP_TH | 04 Upper threshold |
| 05_MR | 05 Marginal rate |
| 05_LOW_TH | 05 Lower threshold |
| 05_UP_TH | 05 Upper threshold |
| 06_MR | 06 Marginal rate |
| 06_LOW_TH | 06 Lower threshold |
| 06_UP_TH | 06 Upper threshold |
| 07_MR | 07 Marginal rate |
| 07_LOW_TH | 07 Lower threshold |
| 07_UP_TH | 07 Upper threshold |
| MAX_CONTR | Maximum contribution |
| DEDUC_BASE | % of payment given as relief from personal income tax |
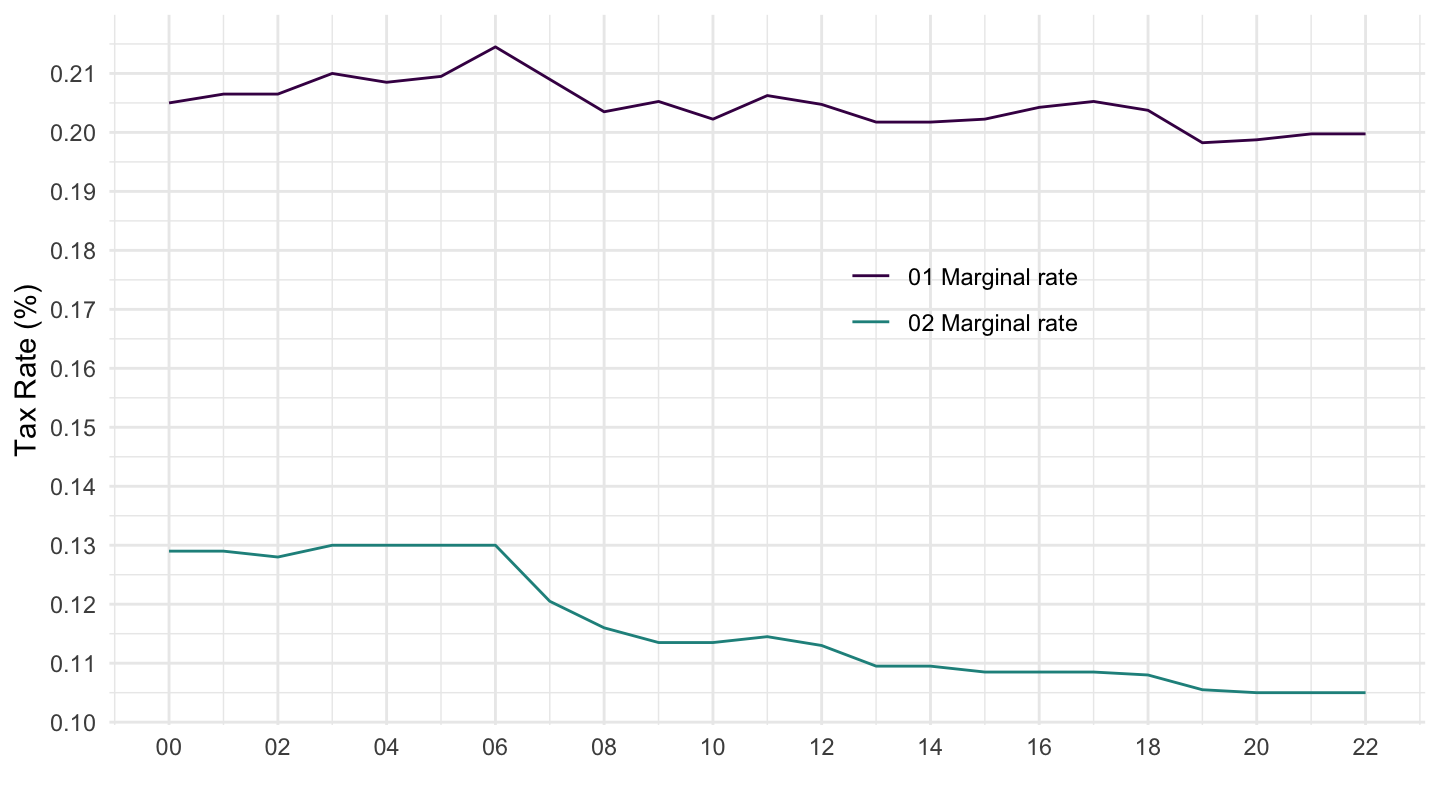
TABLE_III1 %>%
  filter(COU == "DEU") %>%
  year_to_date %>%
  left_join(TABLE_III1_var %>% pluck("RATE_THRESH"), by = c("RATE_THRESH" = "id")) %>%
  rename(RATE_THRESH_desc = label) %>%
  mutate(obsValue = obsValue/100) %>%
  filter(grepl("rate", RATE_THRESH_desc)) %>%
  ggplot() + geom_line(aes(x = date, y = obsValue, color = RATE_THRESH_desc)) +
  scale_color_manual(values = viridis(3)[1:2]) +
  theme_minimal() +
  scale_x_date(breaks = seq(1920, 2025, 2) %>% paste0("-01-01") %>% as.Date,
               labels = date_format("%y")) +
  theme(legend.position = c(0.65, 0.6),
        legend.title = element_blank()) +
  scale_y_continuous(breaks = 0.01*seq(0, 70, 1)) +
  ylab("Tax Rate (%)") + xlab("")